Research Article | | Peer-Reviewed

Integrated Transcriptomic and Genetic Analyses Identify Four Candidate Genes in Alzheimer’s Disease

Received: 9 September 2026     Accepted: 4 October 2026     Published: 10 November 2026
Views:       Downloads:
Abstract

Alzheimer’s disease (AD) involves convergent neuronal, metabolic, vascular, and immune disturbances, yet reproducible genes linking tissue-level dysregulation to genetic liability remain incompletely defined. This study integrated three human hippocampal bulk-transcriptome datasets, two-sample Mendelian randomization (MR), and single-nucleus transcriptomic data to identify and characterize candidate AD genes. Differential expression was analyzed separately in GSE29378, GSE36980, and GSE48350, and ranked gene lists were combined by robust rank aggregation (RRA). Genetically supported genes were obtained using expression-associated variants as exposures and FinnGen AD summary statistics as the outcome. RRA genes were intersected with directionally concordant MR results. Human hippocampal nuclei from GSE163577 were processed with Seurat and Harmony and annotated using SingleR with marker-based review. The three bulk datasets were then merged after ComBat batch correction for gene set enrichment analysis (GSEA), CIBERSORT immune deconvolution, gene-immune correlation analysis, and construction of a four-gene nomogram with decision curve analysis (DCA). RRA and MR converged on four genes: HVCN1 and LAPTM5 were upregulated and associated with increased AD odds, whereas GAS7 and PARM1 were downregulated and associated with reduced odds. Single-nucleus mapping localized HVCN1 and LAPTM5 predominantly to microglia, while GAS7 showed broader neuronal and oligodendroglial expression. GSEA separated immune/complement programs from neuronal and bioenergetic pathways across the four genes. Gene expression also correlated with selected immune-cell fractions, and the combined model showed positive net benefit across a broad range of threshold probabilities. These findings nominate HVCN1, LAPTM5, PARM1, and GAS7 as biologically coherent candidate markers connecting genetic susceptibility, cell-type specificity, immune remodeling, and hippocampal dysfunction in AD. Independent cohorts and experimental studies are required before clinical translation.

Published in American Journal of Biomedical and Life Sciences (Volume 14, Issue 6)
DOI 10.11648/j.ajbls.20261406.11
Page(s) 116-123
Creative Commons

This is an Open Access article, distributed under the terms of the Creative Commons Attribution 4.0 International License (http://creativecommons.org/licenses/by/4.0/), which permits unrestricted use, distribution and reproduction in any medium or format, provided the original work is properly cited.

Copyright

Copyright © The Author(s), 2026. Published by Science Publishing Group

Keywords

Alzheimer’s Disease, Hippocampus, Robust Rank Aggregation, Mendelian Randomization, Single-nucleus Rna Sequencing, Immune Infiltration, Nomogram

1. Introduction
Alzheimer’s disease (AD) is a progressive neurodegenerative disorder in which amyloid and tau pathology unfolds within a multicellular tissue response involving synapses, glia, vasculature, metabolism, and innate immunity. The hippocampus is particularly vulnerable, but molecular signals measured in post-mortem tissue vary across cohorts, platforms, brain subregions, and cellular composition. Consequently, a gene detected in one expression dataset may reflect technical noise or downstream disease effects rather than a robust component of AD biology .
Public transcriptomic resources provide complementary evidence. GSE29378 profiled regional and cell-type-associated changes in AD, GSE36980 characterized post-mortem brains from the Hisayama study, and GSE48350 examined age- and disease-associated expression across multiple brain regions . In parallel, GSE163577 provides single-nucleus resolution of the human brain vasculature and associated hippocampal cell populations in control and AD samples . Integrating these resources can reduce cohort-specific bias while restoring cellular context that is lost in bulk tissue.
We therefore designed a triangulation workflow that required agreement between cross-cohort differential expression and genetic causal evidence. Ranked differential-expression signals from three bulk datasets were integrated by robust rank aggregation (RRA), then intersected with genes supported by two-sample MR. The resulting candidates were mapped to hippocampal cell types, linked to pathway activity and inferred immune composition, and combined in an exploratory diagnostic model. The analysis identified HVCN1, LAPTM5, PARM1, and GAS7 as four candidate genes connecting immune and bioenergetic alterations with AD susceptibility.
2. Materials and Methods
2.1. Study Design and Data Sources
The study was an in-silico secondary analysis of publicly available human data. Bulk hippocampal expression matrices and phenotype annotations were obtained from the Gene Expression Omnibus (GEO): GSE29378, GSE36980, and GSE48350 . The analyzed cohorts comprised 56 AD and 66 control profiles in total. Single-nucleus data were obtained from GSE163577 . Expression quantitative-trait exposure data were paired with FinnGen AD outcome summary statistics (outcome file finn-b-G6_ALZHEIMER) for two-sample MR. The workflow is summarized by the sequence: cohort-specific differential expression, RRA integration, MR filtering, single-cell localization, pathway and immune analyses, and exploratory prediction modeling.
Table 1. Public datasets used in the integrated analysis.

Dataset

Data type / platform

AD

Control

Role

GSE29378

Bulk; Illumina HumanHT-12 v3

31

32

Differential expression, RRA, merged analysis

GSE36980

Bulk; Affymetrix Human Gene 1.0 ST

7

10

Differential expression, RRA, merged analysis

GSE48350

Bulk; Affymetrix U133 Plus 2.0

18

24

Differential expression, RRA, merged analysis

GSE163577

Human single-nucleus RNA sequencing

9

8

Cell annotation, proportions, candidate-gene mapping

2.2. Bulk Differential Expression and RRA
Probe-level matrices were mapped to gene symbols and duplicate probes were averaged. Within each dataset, AD and control samples were compared using limma . Genes with |log2 fold change| > 0.5 and adjusted P < 0.05 were classified as differentially expressed for the volcano plots. For cross-cohort integration, genes were ranked separately from most upregulated to most downregulated in each dataset. The RobustRankAggreg package was used to calculate an RRA probability for concordant ranks . Candidate RRA genes were retained at P < 0.05 with mean log2 fold change > 0.3 for upregulation or < -0.3 for downregulation; Bonferroni-adjusted values were also calculated and reported in the RRA output.
2.3. Two-Sample Mendelian Randomization
Expression-associated single-nucleotide polymorphisms passing P < 5 × 10⁻⁸ were used as instrumental variables. Exposure and FinnGen AD outcome alleles were harmonized with TwoSampleMR . Variants not retained after harmonization or directly associated with the outcome at P ≤ 0.05 were excluded. Causal estimates were generated using MR-Egger, weighted median, inverse-variance weighted (IVW), simple mode, and weighted mode methods. Screening required IVW P < 0.05, concordant odds-ratio direction across all five estimators when all were available, and no evidence of directional horizontal pleiotropy (MR-Egger intercept P > 0.05). RRA-upregulated genes were intersected with MR odds ratios > 1, whereas RRA-downregulated genes were intersected with odds ratios < 1.
2.4. Single-nucleus Processing and Cell Annotation
GSE163577 count matrices were analyzed in Seurat . Genes detected in at least five nuclei and nuclei with >100 expressed genes were retained; nuclei with mitochondrial transcript percentage ≥10% were excluded. Counts were log-normalized (scale factor 10,000), 1,500 variable genes were selected, and 20 principal components were computed. Sample effects were integrated with Harmony, followed by graph-based clustering at resolution 0.6 and t-distributed stochastic neighbor embedding (t-SNE). Cell identities were assigned using SingleR with the Human Primary Cell Atlas and manually reviewed against canonical markers . Seven major classes were used: astrocytes, endothelial cells, microglia, neurons, oligodendrocytes, oligodendrocyte precursor cells (OPCs), and vascular smooth muscle cells (VSMCs). Cell-type markers required |average log2 fold change| > 1 and adjusted P < 0.05. Candidate-gene expression was summarized by mean expression and percentage of positive nuclei.
2.5. Integrated Pathway and Immune Analyses
Genes shared across the three bulk matrices were merged, and dataset batch was adjusted by parametric empirical-Bayes ComBat in the sva package . AD samples were divided at the median expression of each candidate gene. A ranked difference between high- and low-expression groups was tested against the MSigDB C2 curated KEGG collection using clusterProfiler GSEA; pathways with nominal P < 0.05 were displayed . CIBERSORT with 1,000 permutations estimated 22 leukocyte fractions, and samples with deconvolution P < 0.05 were retained . Among AD samples, Spearman correlations were calculated between each candidate gene and each non-invariant immune fraction. Link significance was defined as P < 0.05; line width represented |rho|.
2.6. Nomogram, Decision Curves, and Statistical Analysis
A multivariable logistic regression model containing HVCN1, LAPTM5, PARM1, and GAS7 was fitted to the ComBat-adjusted combined cohort using rms, and a nomogram converted total points to predicted AD probability. Clinical utility was explored with rmda DCA over threshold probabilities from 0 to 1 with 50 bootstrap resamples . Except where adjusted P values were explicitly used, tests were two-sided and P < 0.05 was considered statistically significant. Because the model was developed and evaluated in the same merged dataset, its performance was interpreted as exploratory rather than externally validated.
3. Results
3.1. Cross-cohort Expression and MR Converged on Four Genes
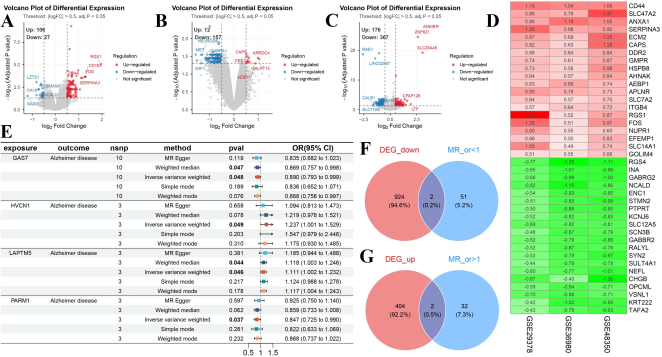
At the prespecified volcano-plot thresholds, GSE29378 contained 106 upregulated and 27 downregulated genes, GSE36980 contained 12 upregulated and 157 downregulated genes, and GSE48350 contained 176 upregulated and 367 downregulated genes (Figure 1A-C). Despite marked variation in the number and direction of DEGs, RRA recovered a consistent cross-dataset signature (Figure 1D). The RRA-down/MR-protective intersection contained GAS7 and PARM1, whereas the RRA-up/MR-risk intersection contained HVCN1 and LAPTM5 (Figure 1F, G).
IVW MR estimates were directionally concordant with the bulk expression results: GAS7, odds ratio (OR) 0.890 (95% confidence interval [CI] 0.793-0.999; P = 0.048); PARM1, OR 0.847 (95% CI 0.725-0.990; P = 0.037); HVCN1, OR 1.237 (95% CI 1.001-1.529; P = 0.049); and LAPTM5, OR 1.111 (95% CI 1.002-1.232; P = 0.046) (Figure 1E). Thus, both expression direction and genetically estimated effect direction supported the same four candidates.
Figure 1. Multi-cohort differential expression, robust rank aggregation, and Mendelian randomization identify four candidate genes. (A-C) Volcano plots for GSE29378, GSE36980, and GSE48350, respectively (|log2 fold change| > 0.5; adjusted P < 0.05). (D) RRA heatmap showing representative consistently upregulated (red) and downregulated (green) genes and their mean log2 fold changes across datasets. (E) Forest plot of five MR estimators for GAS7, HVCN1, LAPTM5, and PARM1; the principal estimates reported in the text are IVW estimates. (F) Intersection of RRA-downregulated genes with MR genes having OR < 1. (G) Intersection of RRA-upregulated genes with MR genes having OR > 1. CI, confidence interval; DEG, differentially expressed gene; IVW, inverse-variance weighted; MR, Mendelian randomization; OR, odds ratio; RRA, robust rank aggregation.
3.2. Single-nucleus Analysis Resolved Cell-type Context
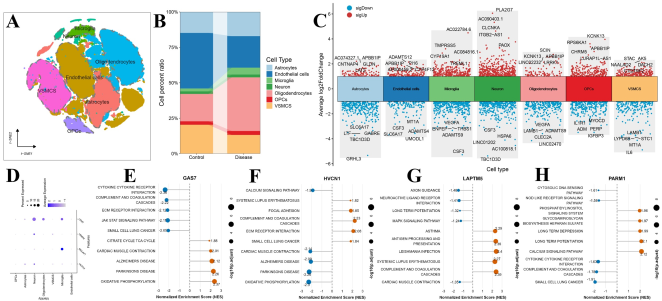
t-SNE separated seven major hippocampal cell classes, including neural, glial, and vascular populations (Figure 2A). Control and AD samples showed visibly different cell-type compositions, with disease-associated expansion of the oligodendrocyte fraction and relative changes in endothelial and vascular smooth muscle compartments (Figure 2B); these descriptive proportions were not treated as formal compositional tests. Cell-type marker analysis revealed distinct transcriptional programs across all seven classes (Figure 2C). Candidate-gene mapping showed preferential microglial expression of LAPTM5 and HVCN1, broader neuronal and oligodendroglial expression of GAS7, and comparatively sparse PARM1 detection (Figure 2D). These patterns placed the two risk-direction genes within an immune-resident cellular context and the strongest protective-direction signal within neural/glial compartments.
3.3. Candidate Genes Marked Opposing Immune and Bioenergetic Programs
Gene-stratified GSEA in the batch-adjusted AD cohort revealed coordinated but distinct pathway profiles (Figure 2E-H). High GAS7 expression was positively associated with the tricarboxylic-acid cycle, oxidative phosphorylation, and neurodegeneration-related KEGG sets, while cytokine-receptor, complement/coagulation, extracellular-matrix (ECM) receptor, and JAK-STAT programs were enriched in the low-GAS7 group. HVCN1 displayed the reciprocal pattern: high expression tracked with complement/coagulation, ECM-receptor interaction, focal adhesion, and systemic lupus erythematosus pathways, whereas low expression tracked with calcium signaling, oxidative phosphorylation, and AD/Parkinson disease sets. High LAPTM5 expression was associated with antigen processing, complement/coagulation, systemic lupus erythematosus, and infection-related immune pathways; low expression was associated with axon guidance, neuroactive ligand–receptor interaction, long-term potentiation, and MAPK signaling. PARM1 showed positive enrichment of phosphatidylinositol, calcium, and synaptic plasticity pathways, with immune-sensing and complement pathways enriched in the low-expression group.
Figure 2. Cellular localization and pathway associations of the four candidate genes. (A) t-SNE map of GSE163577 nuclei annotated into seven major hippocampal cell classes. (B) Descriptive cell-type proportions in control and AD samples. (C) Cell-type marker volcano plot; red and blue denote significantly upregulated and downregulated markers. (D) Dot plot of GAS7, PARM1, LAPTM5, and HVCN1; dot size represents the percentage of expressing nuclei and color represents average expression. (E-H) KEGG GSEA for GAS7, HVCN1, LAPTM5, and PARM1, respectively, after ComBat integration of GSE29378, GSE36980, and GSE48350. Positive normalized enrichment scores indicate enrichment in the high-expression group, and negative scores indicate enrichment in the low-expression group. AD, Alzheimer’s disease; GSEA, gene set enrichment analysis; OPC, oligodendrocyte precursor cell; t-SNE, t-distributed stochastic neighbor embedding; VSMC, vascular smooth muscle cell.
3.4. Immune Correlations and Exploratory Clinical Utility
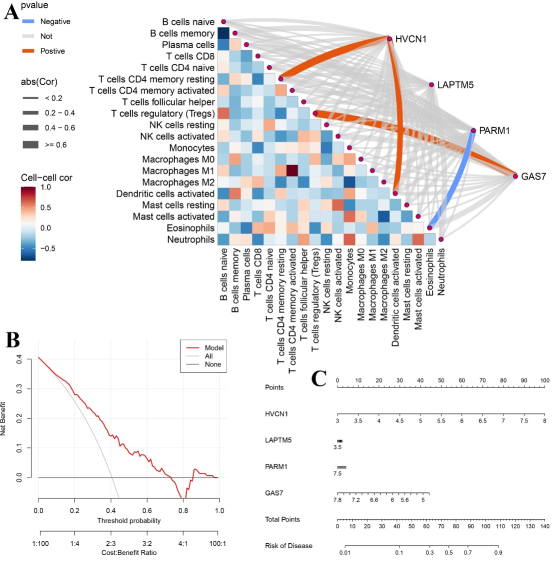
The LinkET network integrated correlations among inferred immune fractions with gene-immune associations in AD samples (Figure 3A). Significant links included positive associations of HVCN1 with resting CD4 memory T-cell and activated dendritic-cell fractions, a positive association of GAS7 with regulatory T-cell abundance, and an inverse association between PARM1 and eosinophils. The remaining gene–cell pairs were weaker or non-significant. These results support immune coupling but do not establish recruitment, cell number, or direction of causation.
The four-gene logistic model was translated into a nomogram that assigned expression-dependent points for HVCN1, LAPTM5, PARM1, and GAS7 and mapped total points to AD probability (Figure 3C). In DCA, the model provided greater net benefit than the treat-all and treat-none strategies across much of the clinically relevant threshold range, with benefit declining and becoming unstable at high thresholds (Figure 3B). Because the same merged cohort supported model fitting and evaluation, these curves demonstrate potential utility rather than transportable diagnostic accuracy.
Figure 3. Immune associations and exploratory four-gene prediction model. (A) LinkET visualization of immune-cell intercorrelations and Spearman associations between candidate-gene expression and CIBERSORT fractions in AD samples. Heatmap color denotes immune-cell correlations; connecting-line color denotes positive, negative, or non-significant gene-immune associations, and line width denotes absolute correlation magnitude. (B) Decision curve analysis of the HVCN1-LAPTM5-PARM1-GAS7 logistic model compared with treat-all and treat-none strategies. (C) Nomogram estimating AD probability from the four-gene model. AD, Alzheimer’s disease.

4. Discussion
This integrative analysis nominated four genes whose directions agreed across heterogeneous transcriptomic cohorts and genetically anchored MR. HVCN1 and LAPTM5 formed an immune/lysosomal axis: both were upregulated in bulk AD tissue, had ORs above 1 in IVW MR, and were preferentially expressed in microglia. Their high-expression GSEA profiles emphasized complement, antigen processing, ECM interaction, and inflammatory signaling. By contrast, GAS7 and PARM1 showed protective-direction MR estimates and lower expression in AD, with pathway associations involving neuronal energetics, calcium signaling, and synaptic plasticity.
The cell-specific findings are compatible with the recognized cellular phase of AD, in which microglial and complement responses can contribute to synapse remodeling and loss . HVCN1 encodes the voltage-gated proton channel Hv1, which supports charge compensation during phagocyte NADPH-oxidase activity; experimental work in brain injury has linked Hv1-dependent microglial reactive oxygen species to neuronal damage . Its association with complement/ECM pathways and inferred immune fractions therefore provides a plausible, although not AD-specific, inflammatory mechanism. LAPTM5 is a lysosomal transmembrane protein enriched in hematopoietic lineages, consistent with the observed microglial localization and antigen-processing signature. The present data prioritize both genes for experiments examining microglial activation state, lysosomal flux, and neuron-glia interactions.
GAS7 is involved in cytoskeletal organization and neuronal morphogenesis. Its broader neuronal/oligodendroglial distribution, protective-direction MR estimate, and association with oxidative phosphorylation and tricarboxylic-acid-cycle pathways suggest that reduced GAS7 may accompany loss of structural and bioenergetic resilience. PARM1 was detected at lower levels but linked genetically to reduced AD odds and transcriptionally to phosphatidylinositol, calcium, and long-term plasticity pathways.
The nomogram and DCA offer a compact translation of the four-gene signature, but they should not be considered a clinical diagnostic tool. Post-mortem hippocampal expression cannot directly substitute for a blood, cerebrospinal-fluid, or imaging biomarker. In addition, optimistic performance is expected when feature selection, model fitting, and DCA occur in related or identical data. External validation, calibration assessment, comparison with age/APOE/neuropathology covariates, and evaluation in accessible biospecimens are required.
Several limitations warrant emphasis. First, the bulk cohorts differ in platform, demographic structure, neuropathological definitions, and hippocampal sampling; ComBat reduces technical batch effects but cannot remove biological confounding. Second, RRA thresholds used nominal aggregation P values, and GSEA pathways were displayed at nominal P < 0.05; these findings require multiplicity-aware replication. Third, CIBERSORT estimates immune-like signatures rather than histologically measured leukocyte abundance in brain tissue. Fourth, MR inference depends on instrument relevance, independence, exclusion restriction, and absence of horizontal pleiotropy; the modest instrument counts and borderline IVW P values limit certainty . Finally, single-nucleus proportions can be altered by tissue processing and capture efficiency. These limitations make the study hypothesis-generating, while the agreement across expression direction, genetic effect, cell localization, and pathway context provides a strong basis for targeted validation.
5. Conclusions
Integration of three hippocampal bulk-transcriptome cohorts with MR and single-nucleus profiling identified HVCN1, LAPTM5, PARM1, and GAS7 as candidate AD genes. HVCN1 and LAPTM5 highlighted microglial immune programs, whereas GAS7 and PARM1 connected neuronal, metabolic, and signaling pathways. The four-gene model showed exploratory net benefit, but independent molecular, experimental, and clinical validation is essential before biomarker or therapeutic application.
Abbreviations

AD

Alzheimer’s disease

CI

Confidence Interval

DCA

Decision Curve Analysis

DEG

Differentially Expressed Gene

ECM

Extracellular Matrix

GEO

Gene Expression Omnibus

GSEA

Gene Set Enrichment Analysis

IVW

Inverse-variance Weighted

MR

Mendelian Randomization

OPC

Oligodendrocyte Precursor Cell

OR

Odds Ratio

RRA

Robust Rank Aggregation

t-SNE

t-Distributed Stochastic Neighbor Embedding

VSMC

Vascular Smooth Muscle Cell

Acknowledgments
The authors thank the investigators and participants who generated and shared the GEO and FinnGen resources used in this study.
Author Contributions
Xin Liu: Conceptualization, Formal Analysis, Methodology, Software, Visualization, Writing – original draft
Qiu Yingxin: Data curation, Investigation, Validation
Chuang Guo: Project Administration, Supervision, Writing – review & editing
Funding
This study was funded by the Natural Science Foundation of China (No. 32371037), and Key Laboratory of Bioresource Research and Development of Liaoning Province (2022JH13/10200026).
Data Availability Statement
The transcriptomic datasets are publicly available in NCBI GEO under accession numbers GSE29378, GSE36980, GSE48350, and GSE163577. AD GWAS summary statistics were obtained from FinnGen. Analysis code is available from the corresponding author upon reasonable request.
Conflicts of Interest
The authors declare no conflicts of interest.
References
[1] De Strooper, B., Karran, E. The Cellular Phase of Alzheimer’s Disease. Cell. 2016, 164(4), 603–615.
[2] Miller, J. A., Woltjer, R. L., Goodenbour, J. M., Horvath, S., Geschwind, D. H. Genes and Pathways Underlying Regional and Cell Type Changes in Alzheimer’s Disease. Genome Medicine. 2013, 5, 48.
[3] Hokama, M., Oka, S., Leon, J., Ninomiya, T., Honda, H., Sasaki, K., et al. Altered Expression of Diabetes-Related Genes in Alzheimer’s Disease Brains: The Hisayama Study. Cerebral Cortex. 2014, 24(9), 2476–2488.
[4] Berchtold, N. C., Sabbagh, M. N., Beach, T. G., Kim, R. C., Cribbs, D. H., Cotman, C. W. Brain Gene Expression Patterns Differentiate Mild Cognitive Impairment from Normal Aged and Alzheimer’s Disease. Neurobiology of Aging. 2014, 35(9), 1961–1972.
[5] Yang, A. C., Vest, R. T., Kern, F., Lee, D. P., Agam, M., Maat, C. A., et al. A Human Brain Vascular Atlas Reveals Diverse Mediators of Alzheimer’s Risk. Nature. 2022, 603(7903), 885–892.
[6] Ritchie, M. E., Phipson, B., Wu, D., Hu, Y., Law, C. W., Shi, W., Smyth, G. K. limma Powers Differential Expression Analyses for RNA-Sequencing and Microarray Studies. Nucleic Acids Research. 2015, 43(7), e47.
[7] Kolde, R., Laur, S., Adler, P., Vilo, J. Robust Rank Aggregation for Gene List Integration and Meta-Analysis. Bioinformatics. 2012, 28(4), 573–580.
[8] Hemani, G., Zheng, J., Elsworth, B., Wade, K. H., Haberland, V., Baird, D., et al. The MR-Base Platform Supports Systematic Causal Inference Across the Human Phenome. eLife. 2018, 7, e34408.
[9] Kurki, M. I., Karjalainen, J., Palta, P., Sipilä, T. P., Kristiansson, K., Donner, K. M., et al. FinnGen Provides Genetic Insights from a Well-Phenotyped Isolated Population. Nature. 2023, 613, 508–518.
[10] Stuart, T., Butler, A., Hoffman, P., Hafemeister, C., Papalexi, E., Mauck, W. M., et al. Comprehensive Integration of Single-Cell Data. Cell. 2019, 177(7), 1888–1902.e21.
[11] Aran, D., Looney, A. P., Liu, L., Wu, E., Fong, V., Hsu, A., et al. Reference-Based Analysis of Lung Single-Cell Sequencing Reveals a Transitional Profibrotic Macrophage. Nature Immunology. 2019, 20(2), 163–172.
[12] Johnson, W. E., Li, C., Rabinovic, A. Adjusting Batch Effects in Microarray Expression Data Using Empirical Bayes Methods. Biostatistics. 2007, 8(1), 118–127.
[13] Subramanian, A., Tamayo, P., Mootha, V. K., Mukherjee, S., Ebert, B. L., Gillette, M. A., et al. Gene Set Enrichment Analysis: A Knowledge-Based Approach for Interpreting Genome-Wide Expression Profiles. Proceedings of the National Academy of Sciences USA. 2005, 102(43), 15545–15550.
[14] Newman, A. M., Liu, C. L., Green, M. R., Gentles, A. J., Feng, W., Xu, Y., et al. Robust Enumeration of Cell Subsets from Tissue Expression Profiles. Nature Methods. 2015, 12(5), 453–457.
[15] Vickers, A. J., Elkin, E. B. Decision Curve Analysis: A Novel Method for Evaluating Prediction Models. Medical Decision Making. 2006, 26(6), 565–574.
[16] Hong, S., Beja-Glasser, V. F., Nfonoyim, B. M., Frouin, A., Li, S., Ramakrishnan, S., et al. Complement and Microglia Mediate Early Synapse Loss in Alzheimer Mouse Models. Science. 2016, 352(6286), 712–716.
[17] Wu, L. J., Wu, G., Akhavan Sharif, M. R., Baker, A., Jia, Y., Fahey, F. H., et al. The Voltage-Gated Proton Channel Hv1 Enhances Brain Damage from Ischemic Stroke. Nature Neuroscience. 2012, 15(4), 565–573.
[18] Davies, N. M., Holmes, M. V., Davey Smith, G. Reading Mendelian Randomisation Studies: A Guide, Glossary, and Checklist for Clinicians. BMJ. 2018, 362, k601.
Cite This Article
  • APA Style

    Liu, X., Qiu, Y., Guo, C. (2026). Integrated Transcriptomic and Genetic Analyses Identify Four Candidate Genes in Alzheimer’s Disease. American Journal of Biomedical and Life Sciences, 14(6), 116-123. https://doi.org/10.11648/j.ajbls.20261406.11

    Copy | Download

    ACS Style

    Liu, X.; Qiu, Y.; Guo, C. Integrated Transcriptomic and Genetic Analyses Identify Four Candidate Genes in Alzheimer’s Disease. Am. J. Biomed. Life Sci. 2026, 14(6), 116-123. doi: 10.11648/j.ajbls.20261406.11

    Copy | Download

    AMA Style

    Liu X, Qiu Y, Guo C. Integrated Transcriptomic and Genetic Analyses Identify Four Candidate Genes in Alzheimer’s Disease. Am J Biomed Life Sci. 2026;14(6):116-123. doi: 10.11648/j.ajbls.20261406.11

    Copy | Download

  • @article{10.11648/j.ajbls.20261406.11,
      author = {Xin Liu and Yingxin Qiu and Chuang Guo},
      title = {Integrated Transcriptomic and Genetic Analyses Identify Four Candidate Genes in Alzheimer’s Disease},
      journal = {American Journal of Biomedical and Life Sciences},
      volume = {14},
      number = {6},
      pages = {116-123},
      doi = {10.11648/j.ajbls.20261406.11},
      url = {https://doi.org/10.11648/j.ajbls.20261406.11},
      eprint = {https://article.sciencepublishinggroup.com/pdf/10.11648.j.ajbls.20261406.11},
      abstract = {Alzheimer’s disease (AD) involves convergent neuronal, metabolic, vascular, and immune disturbances, yet reproducible genes linking tissue-level dysregulation to genetic liability remain incompletely defined. This study integrated three human hippocampal bulk-transcriptome datasets, two-sample Mendelian randomization (MR), and single-nucleus transcriptomic data to identify and characterize candidate AD genes. Differential expression was analyzed separately in GSE29378, GSE36980, and GSE48350, and ranked gene lists were combined by robust rank aggregation (RRA). Genetically supported genes were obtained using expression-associated variants as exposures and FinnGen AD summary statistics as the outcome. RRA genes were intersected with directionally concordant MR results. Human hippocampal nuclei from GSE163577 were processed with Seurat and Harmony and annotated using SingleR with marker-based review. The three bulk datasets were then merged after ComBat batch correction for gene set enrichment analysis (GSEA), CIBERSORT immune deconvolution, gene-immune correlation analysis, and construction of a four-gene nomogram with decision curve analysis (DCA). RRA and MR converged on four genes: HVCN1 and LAPTM5 were upregulated and associated with increased AD odds, whereas GAS7 and PARM1 were downregulated and associated with reduced odds. Single-nucleus mapping localized HVCN1 and LAPTM5 predominantly to microglia, while GAS7 showed broader neuronal and oligodendroglial expression. GSEA separated immune/complement programs from neuronal and bioenergetic pathways across the four genes. Gene expression also correlated with selected immune-cell fractions, and the combined model showed positive net benefit across a broad range of threshold probabilities. These findings nominate HVCN1, LAPTM5, PARM1, and GAS7 as biologically coherent candidate markers connecting genetic susceptibility, cell-type specificity, immune remodeling, and hippocampal dysfunction in AD. Independent cohorts and experimental studies are required before clinical translation.},
     year = {2026}
    }
    

    Copy | Download

  • TY  - JOUR
    T1  - Integrated Transcriptomic and Genetic Analyses Identify Four Candidate Genes in Alzheimer’s Disease
    AU  - Xin Liu
    AU  - Yingxin Qiu
    AU  - Chuang Guo
    Y1  - 2026/11/10
    PY  - 2026
    N1  - https://doi.org/10.11648/j.ajbls.20261406.11
    DO  - 10.11648/j.ajbls.20261406.11
    T2  - American Journal of Biomedical and Life Sciences
    JF  - American Journal of Biomedical and Life Sciences
    JO  - American Journal of Biomedical and Life Sciences
    SP  - 116
    EP  - 123
    PB  - Science Publishing Group
    SN  - 2330-880X
    UR  - https://doi.org/10.11648/j.ajbls.20261406.11
    AB  - Alzheimer’s disease (AD) involves convergent neuronal, metabolic, vascular, and immune disturbances, yet reproducible genes linking tissue-level dysregulation to genetic liability remain incompletely defined. This study integrated three human hippocampal bulk-transcriptome datasets, two-sample Mendelian randomization (MR), and single-nucleus transcriptomic data to identify and characterize candidate AD genes. Differential expression was analyzed separately in GSE29378, GSE36980, and GSE48350, and ranked gene lists were combined by robust rank aggregation (RRA). Genetically supported genes were obtained using expression-associated variants as exposures and FinnGen AD summary statistics as the outcome. RRA genes were intersected with directionally concordant MR results. Human hippocampal nuclei from GSE163577 were processed with Seurat and Harmony and annotated using SingleR with marker-based review. The three bulk datasets were then merged after ComBat batch correction for gene set enrichment analysis (GSEA), CIBERSORT immune deconvolution, gene-immune correlation analysis, and construction of a four-gene nomogram with decision curve analysis (DCA). RRA and MR converged on four genes: HVCN1 and LAPTM5 were upregulated and associated with increased AD odds, whereas GAS7 and PARM1 were downregulated and associated with reduced odds. Single-nucleus mapping localized HVCN1 and LAPTM5 predominantly to microglia, while GAS7 showed broader neuronal and oligodendroglial expression. GSEA separated immune/complement programs from neuronal and bioenergetic pathways across the four genes. Gene expression also correlated with selected immune-cell fractions, and the combined model showed positive net benefit across a broad range of threshold probabilities. These findings nominate HVCN1, LAPTM5, PARM1, and GAS7 as biologically coherent candidate markers connecting genetic susceptibility, cell-type specificity, immune remodeling, and hippocampal dysfunction in AD. Independent cohorts and experimental studies are required before clinical translation.
    VL  - 14
    IS  - 6
    ER  - 

    Copy | Download

Author Information
  • Abstract
  • Keywords
  • Document Sections

    1. 1. Introduction
    2. 2. Materials and Methods
    3. 3. Results
    4. 4. Discussion
    5. 5. Conclusions
    Show Full Outline
  • Abbreviations
  • Acknowledgments
  • Author Contributions
  • Funding
  • Data Availability Statement
  • Conflicts of Interest
  • References
  • Cite This Article
  • Author Information