Abstract
Seismic performance evaluation of high-rise buildings plays a crucial role in maintaining structural safety within earthquake-prone regions. The growing frequency and intensity of seismic activities worldwide require innovative approaches to structural design that focus on resilience, creating sustainable solutions and safety assurance. The conventional force-based methods fail to properly capture nonlinear structural behaviors. On the other hand, energy-based seismic analysis provides a better understanding of how seismic energy get absorbed and distributed within buildings that is to say, the pathways through which earthquake energy flows. This study analyzes the behavior of a 10-story reinforced concrete (RC) building using pushover analysis (POA) and response spectrum analysis (RSA) in ETABS, following the Bangladesh National Building Code (BNBC 2020). The building is modeled with typical gravity and lateral load-resisting systems, considering BNBC seismic code specifications. The POA provides insights into the nonlinear performance of the structure, identifying hinge locations and performance levels under increasing lateral loads. Meanwhile, RSA assesses building responses to seismic motions through vibration pattern studies. A comparative evaluation of base shear, story displacement and drift ratios is conducted to determine whether the structure meets BNBC safety limits. Results suggest that while response spectrum analysis is effective for preliminary design, pushover analysis offers deeper insight into potential failure mechanisms. This study emphasizes the significance of integrating both static and dynamic approaches for a comprehensive seismic evaluation of high-rise buildings.
Keywords
Static, Dynamic, Seismic Analysis, Pushover Analysis, Response Spectrum Analysis, ETABS
1. Introduction
Earthquakes are the sudden release of energy in the crust of the earth as a result of the movement of tectonic plates. The release of energy results in seismic waves, leading to ground shaking. The magnitude of an earthquake can be affected by the different factors such as the magnitude, the depth and the geological conditions. Past earthquakes have shown that earthquakes can lead to devastating effects to buildings and infrastructure, severe economic losses and significant human casualties especially in congested urban areas. As a result of rapid urbanization and limited land availability, multistorey reinforced concrete (RC) buildings have become the predominant structural form in modern cities
. Multistory buildings reinforced with concrete are particularly vulnerable to seismic activities because of their high height, uneven mass distribution and high lateral flexibility. The rapid urbanization, particularly in developing countries, has led to an increase in the construction of medium and high-rise buildings which has further increased the demand for reliable seismic analysis and design methods. Seismic analysis, therefore, is an important element to define structural response to earthquake loading and to ensure that designs are safe, serviceable and economical to construct within seismic environments
| [2] | M. M. Khan, M. F. A. Khan, K. Karimuddin, K. S. Charan. Comparative Study of Linear Static and Linear Dynamic Method of Seismic Analysis of RCC Multistoried Building Using ETABS. International Journal for Research in Applied Science & Engineering Technology (IJRASET). 2022, 10(5), 735-744. https://doi.org/10.22214/ijraset.2022.42322 |
[2]
. The safety and usability of buildings during earthquakes depend on their ability to undergo inelastic deformation and dissipate energy without collapse. Strong seismic motions cause significant nonlinear behavior, making purely elastic analysis methods inadequate. As a result, ductility and energy dissipation are key factors in seismic design. Engineers use various analytical techniques, including finite element modeling and seismic analysis methods such as dynamic time-history, equivalent static, response spectrum and pushover analyses, to assess structural resilience. Since result accuracy depends strongly on the chosen methodology and software, these approaches are often compared to determine the most appropriate method for a given structure
. Choosing appropriate methods requires evaluating factors like building height, structural rigidity and seismic zone classification
| [4] | E. Meral, B. T. Cayci, M. Inel. Comparative study on the linear and nonlinear dynamic analysis of typical RC buildings. Revista de la Construcción. 2024, 23(3), 587-607.
https://doi.org/10.7764/RDLC.23.3.587 |
[4]
. Methods such as Pushover Analysis (POA) and Response Spectrum Analysis (RSA) are widely used to evaluate the seismic performance of reinforced concrete (RC) buildings, helping engineers identify weaknesses and improve designs. Pushover Analysis helps evaluate how structures behave when major earthquakes occur, while response spectrum analysis evaluates the dynamic characteristics and elastic seismic demand of structures
| [5] | M. N. Mahmood, H. J. Mohamad. dynamic and pushover analysis of multi-storey reinforced concrete building using different load distribution pattern. Journal of Applied Engineering Science. 2022, 20(4), 1325-1334. https://doi.org/10.5937/jaes0-37318 |
| [6] | C, A. Rodríguez, A. M. R. Pérez, R. López, J. J. C. Mancera. Comparative Analysis and Evaluation of Seismic Response in Structures: Perspectives from Non-Linear Dynamic Analysis to Pushover Analysis. Applied Sciences. 2024, 14(6), 2504.
https://doi.org/10.3390/app14062504 |
[5, 6]
. POA is particularly effective in assessing seismic risk in masonry and irregular or asymmetric buildings, as it captures post-elastic behavior, force redistribution and failure mechanisms that cannot be identified using linear elastic analysis methods
. Unlike linear analysis methods, Pushover Analysis explicitly considers material nonlinearity and stiffness degradation in reinforced concrete structures subjected to strong earthquakes. In this method, a predefined lateral load pattern is incrementally applied until a target displacement or collapse mechanism is reached. A key advantage of POA is its ability to capture the progressive formation of plastic hinges in beams, columns and shear walls, allowing identification of critical regions where seismic damage is likely to initiate and propagate
| [8] | R. N. Bagu, S. G. Sanagapalli. Nonlinear Pushover Analysis of Multi-Storied Structure Using ETABS Software. International Journal of Research Publication and Reviews (IJRPR). 2023, 4(4), 4186-4190. https://doi.org/10.55248/gengpi.4.423.37763 |
[8]
. Despite its advantages, the accuracy of POA is highly dependent on modeling assumptions, particularly the chosen lateral load distribution and higher vibration modes. Conventional POA is typically dominated by the first vibration mode, which can limit its reliability for taller buildings where higher mode effects become significant
. RSA is a widely used linear dynamic method for seismic design and assessment of multistory buildings. It estimates peak structural response by accounting for the structure’s dynamic properties and combining modal responses using seismic codes. It is particularly effective in evaluating elastic seismic demand parameters such as base shear, story displacement, story drift and member forces and is therefore commonly required for mid- and high-rise buildings in modern seismic design standards
. In RSA, structural response is determined through modal superposition by combining contributions from multiple vibration modes. Research emphasizes that adequate modal participation is essential to achieve accurate results, particularly for taller buildings where higher-mode effects significantly influence response. ETABS-based studies show that including a sufficient number of modes to achieve near-complete mass participation is critical for reliable prediction of displacement and drift, as neglecting higher modes may underestimate seismic demand, especially at upper stories
| [11] | H. H. Abbas, A. J. Zedan, A. M. Ibrahim, M. L. Mansour. Dynamic Analysis of a Multistory Building Using Response Spectrum Method. University of Thi-Qar Journal for Engineering Sciences. 2025, 15(1), 38-70.
https://doi.org/10.31663/utjes.15.1.685 |
[11]
. Building height and higher-mode effects further distinguish the two methods. RSA inherently incorporates higher-mode contributions through modal superposition, making it well suited for mid and high-rise buildings. In contrast, POA is typically dominated by the first mode and may not accurately capture higher-mode effects unless advanced multimodal procedures are employed, a limitation that becomes more pronounced as building height increases
| [12] | A. Y. Yusuf, Manu. SE. static & dynamic analysis of highrise building (B+G+35) by using response spectrum, time history & pushover analysis. International Research Journal of Modernization in Engineering Technology and Science. 2023, 5(5), 9597-9623. https://doi.org/10.13140/RG.2.2.32077.61929 |
| [13] | H. Dilek, A. Sadeghpour. A Comparison of Different Linear and Non-linear Structural Analysis Methods. ENG Transactions. 2022, 3, 1-9. https://doi.org/10.52547/engt.3.2208102112805 |
[12, 13]
. Comparative ETABS-based studies show that RSA generally predicts lower story displacements and drift values as it reflects elastic behavior, whereas POA captures post-yield deformation. Studies on multistory RC buildings further indicates that base shear and displacement demand increase when nonlinear effects are considered in POA, highlighting the difference between elastic demand estimation and inelastic capacity evaluation
| [14] | S. D. Maniyar, P. J. Salunke. Comparative Study of Response Spectrum and Pushover Analysis for G+8+T RCC Buildings. International Journal of Innovative Research in Science, Engineering and Technology (IJIRSET). 2023, 12(8), 10698-10704. https://doi.org/10.15680/IJIRSET.2023.1208024 |
[14]
. From a computational perspective, RSA is more efficient and less time-consuming than POA as it requires fewer assumptions related to nonlinear behavior and is therefore widely used for routine design of multistory buildings. POA, although simpler than nonlinear time-history analysis, requires careful definition of hinge properties, load patterns and target displacement, making it more sensitive to modeling assumptions. Studies have shown that variations in lateral load distribution in POA can significantly in-fluence predicted capacity and displacement
| [15] | M. Youcef, K. Abderrahmane, C. Benazouz. Seismic Performance of RC Building Using Spectrum Response and Pushover Analyses. Facing the Challenges in Structural Engineering. 2017, 158–169.
https://doi.org/10.1007/978-3-319-61914-9_13 |
[15]
. The seismic vulnerability of residential buildings in Bangladesh is an increasing concern, particularly in seismically active regions. Many existing structures exhibit significant weaknesses, highlighting the need for improved design standards and risk management strategies. For high-rise buildings, dynamic analysis methods are essential to ensure seismic safety and the growing risk of strong earthquakes further underscores the need for advanced seismic assessment approaches to enhance structural resilience and preparedness
| [16] | Md. R. Basha, S. Yajdani. A Comparative Study on Equivalent Static Pushover Analysis and Response Spectrum Pushover Analysis. International Journal of Innovative Research in Science, Engineering and Technology (IJIRSET). 2016, 5(2), 2250-2255. https://doi.org/10.15680/IJIRSET.2016.050123 |
| [17] | K. M. Rana. Seismic Analysis of Multistory Building Using ETABS. International Journal of Science and Research (IJSR). 2025, 14(10), 1350-1357.
https://dx.doi.org/10.21275/SR251026111229 |
[16, 17]
. As earthquake-prone regions continue to experience population growth and infrastructure development, focus intensifies on performance-based engineering approaches to enhance structural safety and reduce seismic risk. This study aims to employ ETABS to conduct a seismic analysis using both Pushover Analysis and Response Spectrum Analysis to compare structural performance, energy dissipation capacity and overall resilience. By evaluating these methods, the research aims to identify which approach predicts actual building behavior during earthquakes, thereby supporting more effective seismic design practices.
1.1. Objectives of the Study
1) To evaluate the seismic performance of a RC building using two different analytical approaches and understand how these methods represent the structural behavior under earthquake load.
2) To identify weak zones in the structure that could compromise its safety during an earthquake.
1.2. Limitations
While numerous studies have explored seismic performance evaluation using various analytical methods, several key limitations have been identified. The global studies do not incorporate local building codes such as BNBC 2020, which affects the regional relevance of their results. This creates a gap in the application of findings to countries like Bangladesh, where local soil conditions and seismic zones vary significantly. Despite growing awareness of seismic risks in Bangladesh, particularly in the western regions of the country, there remains a significant lack of detailed research focused on cities like Rajshahi, which lies within Seismic Zone I as per BNBC 2020. 12 Most existing seismic performance studies in Bangladesh either focus on Dhaka or Sylhet. Rajshahi, though moderately active seismically, has very less detailed studies evaluating how structures would perform under local seismic loading conditions. Most available research in the region relies on linear static or dynamic methods, with little application of nonlinear analysis techniques like Pushover Analysis, which better reflect real structural performance during strong earthquakes
| [18] | M. Mojarab, N. Norouzi, M. Bayati, Z. Asadi, M. Eslami, M. G. Ashtiany, A. L. Helaly, S. Khoshnevis. Assessment of seismic hazard including equivalent-linear soil response analysis for Dhaka Metropolitan Region, Bangladesh. Natural Hazards. 2023, 117, 3145–3180.
https://doi.org/10.1007/s11069-023-05981-4 |
| [19] | Hossain Md. S., M. KABIR, S. ISLAM. Seismic Hazard Analysis at Site Specific Condition: Case Study in Araihazar, Bangladesh. Iut Journal of Engineering and Technology (JET). 2023, 15(1), 8-20. |
| [20] | Md. A. Islam, Md. A. A. Sarkar, H. M. A. Mahzuz, Md. J. Alam. A Study on Seismic Capacity Evaluation of Existing RC Buildings by Visual Rating Method in Sylhet City. Journal of Advances in Civil and Mechanical Engineering. 2024, 1(1), 1-12. |
| [21] | Md. S. H. Mahi, T. A. Ridoy, S. Hasan. Seismic Performance Assessment of Regular and Irregular RC Buildings Under BNBC 2020 Using ETABS. Disaster in Civil Engineering and Architecture. 2025, 2(1), 13-30.
https://doi.org/10.70028/dcea.v1i2.28 |
[18-21]
. This study aims to fill these gaps by analyzing a 10-story RC building using both POA and RSA in ETABS, guided by the seismic provisions of BNBC 2020.
2. Materials and Methods
For performance evaluation, Rajshahi was selected as the study location and the seismic demand for the site was determined in accordance with the BNBC-2020 guidelines. The structural performance of a ten-story building with an approximate height of 100 feet was assessed. This height category was intentionally chosen, as buildings of similar height are now widely prevalent in Rajshahi city.
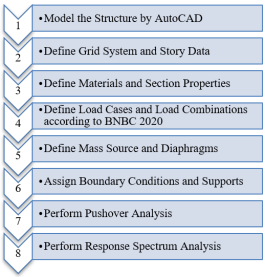
The study proposes to adopt the methodology outlined in
Figure 1.
Figure 1. Chart of Methodology.
2.1. Creating a Model
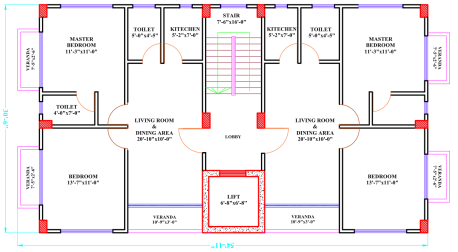
The structure was designed using AutoCAD 2025 and structural analysis was carried out using ETABS 19. The plan layout is presented in
Figure 2.
Figure 2. Layout of plan.
2.2. Materials
The structural model of the 10-story RC building is developed in ETABS, incorporating material properties, section properties and boundary conditions:
Concrete and reinforcing steel were used as the primary construction materials. The concrete grades and reinforcement properties employed in the analytical models are summarized through defined material parameters, including unit weight, modulus of elasticity and strength grade.
Concrete properties, such as, compressive strength of 4000 psi and 3500 psi was considered, both having a unit weight of 150 lb/ft³. The corresponding moduli of elasticity were taken as 3,604,997 psi for 4000 psi concrete and 3,372,166 psi for 3500 psi concrete. Reinforcing steel with a yield strength of 60,000 psi was used, having a unit weight of 490 lb/ft³ and a modulus of elasticity of 29,000,000 psi.
The frame elements were modeled using rectangular reinforced concrete sections. Beams of sizes 12 in × 24 in, 15 in × 24 in and 18 in × 24 in were assigned concrete with a compressive strength of 3500 psi. Columns of sizes 12 in × 24 in and 18 in × 24 in were modeled using higher-strength concrete with a compressive strength of 4000 psi.
Shell elements were defined to represent slabs and shear walls. A 6-inch-thick slab and a 9-inch-thick waist slab were modeled as membrane-type slab elements using 3500 psi concrete. Shear walls associated with the lift core were modeled as 12-inch-thick shell-thin wall elements using 4000 psi concrete.
All material and section properties were implemented in ETABS to ensure realistic stiffness, mass distribution and force transfer characteristics for accurate seismic performance assessment.
Table 1. Material properties, section characteristics and their contribution to stiffness and mass distribution.
Component | Element Type | Section/ Thickness | Concrete Strength (psi) | Unit Weight (lb/ft³) | Modulus of Elasticity (psi) | Role in Stiffness & Mass Distribution |
Concrete (Grade 1) | Material | - | 4000 | 150 | 3,604,997 | Provides higher stiffness for primary vertical and lateral load-resisting members |
Concrete (Grade 2) | Material | - | 3500 | 150 | 3,372,166 | Used for beams and slabs contributing to gravity load and floor mass |
Reinforcing Steel | Material | - | Fy = 60000 | 490 | 29,000,000 | Provides tensile strength and ductility for seismic energy dissipation |
Beam (Type B1) | Frame element | 12 in × 24 in | 3500 | 150 | 3,372,166 | Contributes to flexural stiffness and floor mass distribution |
Beam (Type B2) | Frame element | 15 in × 24 in | 3500 | 150 | 3,372,166 | Enhances lateral stiffness and load transfer between columns |
Beam (Type B3) | Frame element | 18 in × 24 in | 3500 | 150 | 3,372,166 | Increases stiffness in higher demand regions |
Column (Type C1) | Frame element | 12 in × 24 in | 4000 | 150 | 3,604,997 | Primary vertical load-carrying and lateral stiffness component |
Column (Type C2) | Frame element | 18 in × 24 in | 4000 | 150 | 3,604,997 | Major contributor to global stiffness and seismic resistance |
Floor Slab | Shell (Membrane) | 6 in thick | 3500 | 150 | 3,372,166 | Distributes mass uniformly at each floor and acts as diaphragm |
Waist Slab | Shell (Membrane) | 9 in thick | 3500 | 150 | 3,372,166 | Adds localized mass and stiffness in stair and lift regions |
Shear Wall | Shell-thin | 12 in thick | 4000 | 150 | 3,604,997 | Dominant lateral load-resisting system controlling drift and stiffness |
Boundary Condition | Support | Fixed at base | - | - | - | Ensures realistic transfer of seismic forces to foundation |
Table 1 summarizes the material properties, cross-sectional dimensions and element types adopted in the structural model, along with their respective roles in governing global stiffness and mass distribution.
2.3. Defining Static Load Cases
In this step, pushover load cases are defined to represent the increasing structural response subjected to lateral loads that simulates the effect of seismic loading. Nonlinear pushover analysis is performed to evaluate how the structure behaves when subjected to gradually increasing lateral forces until it reaches a predefined performance limit or a target displacement. This approach is essential for assessing the seismic response of the structure, as it allows the evaluation of structural capacity and deformation characteristics under earthquake-induced forces. The analysis applies lateral loads incrementally through a series of pushover load cases, enabling observation of the structural behavior as it transitions from elastic to inelastic response. For comprehensive assessment, pushover load cases are defined in both principal horizontal directions, namely the X and Y directions, typically denoted as PA-X and PA-Y.
1) Pushover Load Cases in X-direction: Lateral forces are applied along the X-axis, simulating an earthquake acting horizontally along the building’s length. The distribution of forces follows modal load pattern. Hinges are formed in beams, columns and shear walls, particularly in structural elements aligned along the X-direction. Base shear and roof displacement in the X-direction are recorded to generate the pushover curve (Base Shear vs. Displacement in X-direction). The performance levels of the structure are evaluated based on plastic hinge formation and displacement capacity.
2) Pushover Load Cases in Y-direction: Lateral forces are applied along the Y-axis, simulating an earthquake acting horizontally along the building’s width. The same force distribution pattern is used as in the X-direction analysis. Hinges develop in structural members oriented along the Y-direction, with special focus on shear walls and frame elements resisting lateral forces in this direction. A separate pushover curve (Base Shear vs. Displacement in Y-direction) is generated to evaluate the structural performance under lateral loads along the Y-axis.
Table 2. Modal load pattern definition for static pushover analysis.
Pushover Case | Direction | Load Pattern Type | Source Mode | Control DOF |
PA-X | X | Modal | Mode 1 | UX |
PA-Y | Y | Modal | Mode 1 | UY |
Table 2 represents pushover load cases defined for the nonlinear analysis. The pushover loads are derived from the first translational vibration mode. Separate load cases are applied in the X and Y directions to capture directional seismic behavior. The roof-level translational displacement (UX or UY) is selected as the control degree of freedom to monitor structural response and generate base shear–displacement capacity curves.
2.4. Defining Hinge Properties
Hinge properties are crucial in simulating the nonlinear behavior of structural elements during seismic loading. Hinges are assigned in both columns and beams at 0.1L and 0.9L of their length, where L is the total column length. The P-M2-M3 and M3 hinge property are used to define the degrees of freedom, incorporating axial force (P) and bending moments (M2, M3) along two orthogonal axes. Columns are assigned P–M2–M3 hinges to capture axial load and biaxial bending interaction, while beams are modeled with M3 moment hinges to represent flexural yielding. This modeling strategy aligns with FEMA 356 recommendations and is commonly used in nonlinear procedures in ETABS. Assigning hinge properties based on performance criteria enables realistic simulation of plastic hinge formation and damage progression during pushover analysis
| [5] | M. N. Mahmood, H. J. Mohamad. dynamic and pushover analysis of multi-storey reinforced concrete building using different load distribution pattern. Journal of Applied Engineering Science. 2022, 20(4), 1325-1334. https://doi.org/10.5937/jaes0-37318 |
| [22] | R. Folić, M. Čokić. Fragility and Vulnerability Analysis of an RC Building with the Application of Nonlinear Analysis. Buildings. 2021, 11(9), 390.
https://doi.org/10.3390/buildings11090390 |
| [23] | R. V. American Society of Civil Engineers, Prestandard and Commentary for the Seismic Rehabilitation of Buildings, Washington, D. C.: Federal Emergency Management Agency, 2000. |
[5, 22, 23]
.
2.5. Assigning Hinge Properties to Frame and Wall Objects
Hinge properties are assigned accurately to the structural members at critical points, such as beam ends, mid-span of columns and critical shear wall locations in Non-Linear Pushover Analysis using ETABS to capture inelastic deformations and failure modes. Hinges are assigned at the ends of frame elements, where plastic behavior is most likely to occur. This ensures a realistic representation of structural damage progression under seismic loading.
2.6. Running the Pushover Analysis
The static nonlinear pushover analysis is executed by selecting the defined pushover load cases in Set Load Cases to Run from ETABS. But before beginning, the nonlinear load cases must be defined. After running, ETABS incrementally applies lateral forces until the structure reaches failure or target displacement.
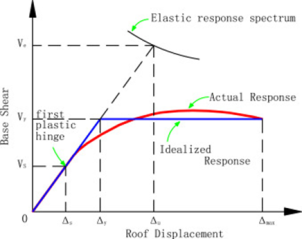
Figure 3 represents a pushover curve, which shows the relationship between base shear (y-axis) and roof displacement (x-axis) under increasing lateral loads. Key components of the curve are:
1) Elastic Response Spectrum (Black Curve): It represents the elastic response of the structure if it remained within the linear range without yielding. This curve is often used in seismic design to estimate the maximum force demand.
2) Actual Response (Red Curve): It represents the real behavior of the structure as it undergoes inelastic deformations during a pushover analysis. It represents yielding and plastic hinge formation in the structural elements.
3) Idealized Response (Blue Curve): This idealized curve helps in determining key structural properties such as yield strength, ultimate strength and displacement limits.
Initially, the structure follows the elastic range. As load increases, the structure yields and enters the plastic range, where plastic hinges form at critical points. The final phase occurs as the applied load is increased further, additional plastic hinges form. When the strength of the structure is surpassed, failure mechanisms will develop in the structure that typically leads to the collapse or large deformations of the structure.
Figure 3. Typical diagram of Pushover Analysis.
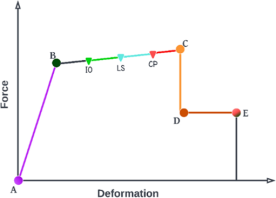
Figure 4 represents a force-deformation relationship for a structural element, typically used in pushover analysis to define hinge properties. Here's a breakdown of the key components:
1) Elastic Range (A to B): The structure behaves elastically, meaning it will return to its original shape if the load is removed. Point B represents the yielding point, where inelastic behavior begins.
2) B to C (Plastic Region): The structure undergoes inelastic deformations but still carries load. Here
a) IO (Immediate Occupancy): Slight deformation, but the structure remains fully functional.
b) LS (Life Safety): Significant damage, but the structure does not collapse, repairable.
c) CP (Collapse Prevention): Severe damage, structure is near failure but still standing.
3) C to D (Strength Degradation): At Point C, the structure reaches ultimate strength. After this, the structure loses strength, indicating failure progression.
4) D to E (Complete Failure): At point D, structure is unable to resist further forces as they loss more strength. Then at point E, total failure occurs; the structure can no longer carry load.
Numerous pushover analysis studies using ETABS adopt these performance criteria to evaluate hinge states, capacity curves and expected damage patterns in multistorey RC buildings
| [12] | A. Y. Yusuf, Manu. SE. static & dynamic analysis of highrise building (B+G+35) by using response spectrum, time history & pushover analysis. International Research Journal of Modernization in Engineering Technology and Science. 2023, 5(5), 9597-9623. https://doi.org/10.13140/RG.2.2.32077.61929 |
| [14] | S. D. Maniyar, P. J. Salunke. Comparative Study of Response Spectrum and Pushover Analysis for G+8+T RCC Buildings. International Journal of Innovative Research in Science, Engineering and Technology (IJIRSET). 2023, 12(8), 10698-10704. https://doi.org/10.15680/IJIRSET.2023.1208024 |
| [23] | R. V. American Society of Civil Engineers, Prestandard and Commentary for the Seismic Rehabilitation of Buildings, Washington, D. C.: Federal Emergency Management Agency, 2000. |
[12, 14, 23]
.
The performance levels (IO, LS, CP) help in defining acceptable damage limits during an earthquake. This graph is a crucial tool in performance-based seismic design, ensuring buildings can withstand earthquakes while minimizing damage and risk to occupants.
Figure 4. Different phases of Pushover curve.
2.7. Defining Response Spectrum Load Cases
For dynamic response spectrum analysis, the load case is defined using BNBC -designated seismic response spectra. Spectral acceleration is calculated based on seismic zone factor (Z), importance factor (I) and response reduction factor (R).
The seismic zone factor (Z) represents the regional seismic hazard and reflects the expected peak ground acceleration for a given location. Rajshahi lies in a moderate seismic zone and the corresponding zone factor is selected as per BNBC-2020 seismic zoning provisions.
The importance factor (I) accounts for the functional significance of the structure. Residential buildings are generally assigned an importance factor of 1.0.
The response reduction factor (R) represents the ductility and overstrength of the structural system, reducing elastic seismic forces to design-level forces. For reinforced concrete moment-resisting frame systems, BNBC-2020 permits higher R values due to their energy dissipation capability.
Site class, soil conditions and appropriate response spectrum function are defined as per BNBC code, the damping ratio is selected for reinforced concrete structures. Load cases are assigned in X and Y directions to capture the dynamic response of the structure.
Site effects are incorporated through the site class, which reflects soil stiffness and amplification characteristics. Medium soil conditions are commonly assumed for urban regions such as Rajshahi unless detailed geotechnical data indicate otherwise.
A damping ratio of 5% is adopted, which is standard for reinforced concrete buildings and consistent with BNBC-2020 recommendations.
Table 3. Seismic parameters used for response spectrum analysis.
Parameter | Value | Basis / BNBC-2020 Provision |
Location | Rajshahi, Bangladesh | Project location |
Seismic Zone | Zone I | BNBC-2020 Seismic Zoning Map |
Seismic Zone Factor | 0.12 | BNBC 2020; Table 6.2.15 |
Importance Factor | 1 | BNBC 2020; Table 6.2.17 |
Response Reduction Factor | 5 | BNBC 2020; Table 6.2.19 |
Site Class | SD | BNBC 2020; Table 6.2.17 |
Damping Ratio | 5% | BNBC-2020; Page-3194 |
Table 3 presents the key seismic design parameters adopted from BNBC-2020 for response spectrum analysis. The table summarizes the project location, seismic zoning, zone factor, importance factor, response reduction factor, site classification and damping ratio. These parameters ensure that the seismic demand applied in the analysis accurately reflects regional seismic hazard, structural importance, energy dissipation capacity and local soil conditions in accordance with BNBC-2020 provisions.
2.8. Running the Response Spectrum Analysis
The response spectrum analysis is executed in ETABS by performing Set Load Cases to Run and select the Response Spectrum Analysis (RSA) load case. ETABS computes the maximum responses of the structure for different vibration modes.
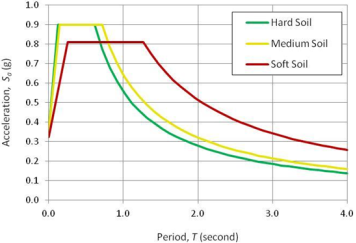
Figure 5. Typical diagram of Response Spectrum Analysis.
Figure 5 represents a Response Spectrum Curve, which is used to determine the maximum spectral acceleration (Sa) experienced by a structure at different natural periods (T) of vibration. X-axis represents the natural vibration period of a structure. Short-period structures (rigid buildings) are on the left, while long-period structures (flexible buildings) are on the right. Y-axis represents the maximum acceleration a structure will experience under seismic loads, normalized by gravity (g). Initially, the period increases from zero, spectral acceleration increases sharply, indicating that very stiff structures experience lower accelerations. After that, the flat peak region represents the constant acceleration zone, where mid-period structures experience the highest acceleration demands. Finally, the period increases further, spectral acceleration starts to decrease, indicating that flexible structures experience lower acceleration but higher displacement.
3. Results & Discussion
3.1. Pushover Analysis in X-direction
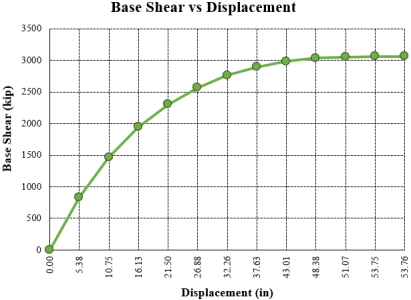
Figure 6. Capacity Curve for X-direction.
Figure 6 represents the pushover curve for the X-direction. The curve shows how the base shear force (kip) varies with increasing lateral displacement (in). The displacement ranges from 0 to 53.76 inches, indicating the level of deformation before the structure reaches its ultimate capacity. At the initial stage, the structure exhibits linear elastic behavior, where base shear increases almost proportionally with displacement. Up to a roof displacement of approximately 5.4 in, the base shear reaches about 835 kip, representing the elastic response range with no significant plastic hinge formation. As the displacement increases beyond this point, the slope of the curve gradually reduces, indicating the onset of yielding and nonlinear behavior. At a displacement of around 10.8–16.1 in, the base shear increases from approximately 1468 kip to 1945 kip, marking the beginning of distributed plasticity in beams and some columns. Based on hinge states and deformation levels, the following performance points are identified on the pushover curve:
1) IO: The IO performance level is reached at a roof displacement of approximately 10–12 in, with a corresponding base shear of about 1500 kip. At this stage, only minor inelastic deformations occur and the structure remains essentially elastic with full post-earthquake functionality.
2) LS: The LS performance level corresponds to a roof displacement in the range of 25–30 in, where the base shear is approximately 2550–2750 kip. Significant plastic hinge formation is observed in beams and some columns. This level represents the target performance for design-level earthquakes.
3) CP: The CP limit state is reached at a roof displacement of approximately 43–48 in, with base shear values close to the maximum capacity of about 3000–3050 kip. At this stage, extensive hinge formation occurs and the structure approaches its ultimate deformation capacity while still retaining residual load-carrying ability.
Beyond a displacement of approximately 50 in, the pushover curve almost flattens, indicating negligible increase in base shear despite increasing displacement. The peak base shear of about 3060 kip occurs at a roof displacement of roughly 53.7 in, representing the ultimate capacity of the structure. Overall, the pushover curve demonstrates adequate ductility and energy dissipation capacity, with clearly distinguishable IO, LS and CP performance levels.
3.2. Pushover Analysis in Y-direction
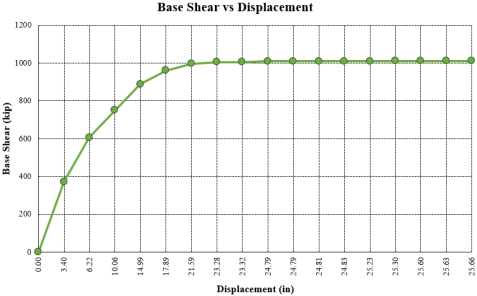
Figure 7. Capacity Curve for Y-direction.
Figure 7 represents the pushover curve in the Y-direction. This curve shows the relationship between base shear and lateral displacement of a structure under increasing lateral loads. At the initial stage, the structure exhibits elastic behavior, where base shear increases almost linearly with displacement. Up to a displacement of approximately 3.4 in, the base shear reaches about 371 kip, indicating that the structure remains within the elastic range with negligible damage. As the displacement increases, yielding begins to occur and the response gradually becomes nonlinear. At a roof displacement of around 6.2 in, the base shear increases to approximately 607 kip, followed by 750 kip at 10.1 in displacement. This region marks the onset of plastic hinge formation, primarily in beam elements. Based on hinge development and deformation demand, the following performance levels are identified on the pushover curve:
1) IO: The IO performance level is attained at a roof displacement of approximately 6–8 in, corresponding to a base shear of about 600–650 kip. At this stage, inelastic deformations are minor, structural damage is limited and the building remains fully functional after the earthquake.
2) LS: The LS performance level occurs at a roof displacement in the range of 14–18 in, where the base shear reaches approximately 880–960 kip. Significant plastic hinge formation is observed in beams and some columns. This level represents the desired performance objective for design-level seismic events.
3) Collapse Prevention (CP): The CP limit state is reached at a roof displacement of approximately 22–25 in, with base shear values approaching the maximum capacity of about 1000–1010 kip. At this stage, extensive hinge formation occurs and the structure approaches its ultimate deformation capacity while still retaining residual load-carrying ability.
Beyond a roof displacement of approximately 23 in, the pushover curve exhibits a plateau, indicating that the structure has reached its maximum lateral strength. The base shear remains nearly constant at around 1009–1011 kip despite increasing displacement up to approximately 25.6 in. Overall, the pushover curve demonstrates a stable post-yield response with adequate ductility, as evidenced by the gradual strength saturation and absence of sudden strength degradation.
3.3. Response Spectrum Analysis
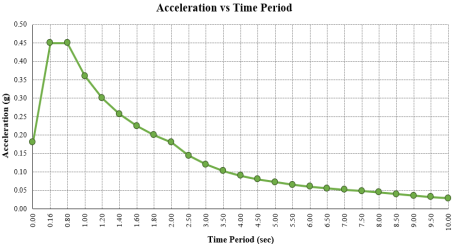
Figure 8. Response Spectrum Curve.
Figure 8 represents a Response Spectrum Curve, which shows the relationship between Acceleration (g) and Time Period (sec). This curve helps to determine how a structure responds to different frequencies of ground motion. The curve peaks at T ≈ 0.45s, indicating resonance effects where structures with this natural period experience maximum acceleration demands. As the period increases beyond the peak, damping effects cause a gradual decline in acceleration. Beyond the peak, the curve shows a gradual decrease in acceleration values. This declining trend represents the effect of damping, where structural and soil damping mechanisms dissipate the earthquake-induced energy, reducing the response acceleration.
3.4. Identification of Weak Zones in the Structure
3.4.1. Weak Zones Identified by Pushover Analysis in X-direction
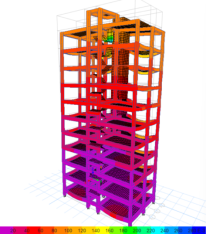
Figure 9 displays the performance of the structure under lateral loading in the X-direction using Pushover Analysis. The color gradient indicates the distribution of plastic hinge formations or displacement demands across the height of the building. The results show a clear increase in lateral displacement with building height, indicating a response dominated by the fundamental translational mode. Minimum displacements occur at the base due to fixed boundary conditions, while maximum values are observed at the roof level. The smooth variation of deformation along the height suggests a uniform stiffness distribution and the absence of soft-story behavior. These deformations arise from diaphragm action, where floor slabs translate laterally to maintain compatibility with frame and shear wall deformations.
Figure 9. Weak Zones Based on Pushover Analysis in X-Direction.
The color scale represents total displacement magnitude, varying from low to high values across the height of the structure.
Table 4. Legend for identification of weak zones by pushover analysis in X-direction.
Displacement Magnitude (in) | Interpretation |
0 – 40 | Very small deformation |
40-80 | Moderate deformation |
80-160 | Significant lateral deformation |
160-220 | High deformation |
220-280 | Maximum deformation demand |
Table 4 defines the displacement magnitude ranges used to interpret deformation contours from the pushover analysis in X-direction. The legend assists in identifying weak zones by relating displacement levels to the severity of structural deformation under lateral seismic loading.
3.4.2. Weak Zones Identified by Pushover Analysis in Y-direction
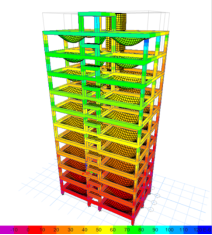
In
Figure 10, Pushover Analysis results in the Y-direction are shown. Similar to the X-direction, the higher stories of the building exhibit significant deformation, indicating that the upper side of the structure is more susceptible to seismic damage. The performance in the Y-direction varies due to the asymmetry in geometry and stiffness distribution, which highlights the irregular behavior of the structure during lateral seismic loads. The smooth deformation pattern along the height suggests a uniform stiffness distribution without evidence of soft-story behavior, while the reduced deformation in the shear wall core confirms its role as the primary lateral load-resisting system. The relatively large slab deformations observed in the figure represent global story drift and diaphragm translation rather than local slab bending and are further amplified for visualization purposes.
Figure 10. Weak Zones Based on Pushover Analysis in Y-Direction.
Table 5. Legend for identification of weak zones by pushover analysis in Y-direction.
Displacement Magnitude (in) | Interpretation |
> 0 | Very small deformation |
0-20 | Moderate deformation |
20-60 | Significant lateral deformation |
60-90 | High deformation |
90-120 | Maximum deformation demand |
Table 5 presents the displacement magnitude ranges used to interpret deformation contours obtained from pushover analysis in Y-direction. The legend helps identify weak zones by correlating displacement demand with the level of structural deformation under lateral seismic loading in the Y direction.
3.4.3. Weak Zones Identified by Response Spectrum Analysis
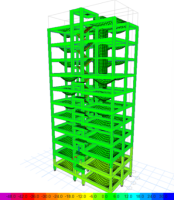
Figure 11 represents the structural response obtained from Response Spectrum Analysis, showing the distribution of displacement throughout the building. The predominance of green-to-yellow colors indicates moderate global displacement, suggesting that the structure largely remains within the elastic or early inelastic response range for the considered loading condition. The absence of abrupt color changes between consecutive floors implies a uniform stiffness distribution and no evidence of soft-story behavior. Since slabs are modeled as shell or membrane elements, their lateral movement is explicitly captured as part of the floor diaphragm responding to frame and shear wall deformations. Additionally, deformation magnification applied for visualization purposes accentuates slab displacement. These observations indicate that the slabs are deforming compatibly with the overall structural drift, rather than experiencing excessive flexural demand. Overall, the deformation pattern reflects stable global behavior, controlled lateral response and appropriate diaphragm action, with slab deformations representing global seismic drift effects rather than structural distress.
Figure 11. Weak Zones Based on Response Spectrum.
Table 6. Legend for identification of weak zones by response spectrum analysis.
Displacement Magnitude (in) | Interpretation |
> -42 | Very small deformation |
−42 to −30 | Moderate deformation |
-30 to -6 | Significant lateral deformation |
-6 to 12 | High deformation |
12< | Maximum deformation demand |
Table 6 summarizes the displacement ranges adopted to interpret response spectrum deformation contours. The legend provides a basis for identifying zones of higher seismic response by correlating displacement demand with the intensity of structural deformation under dynamic loading.
3.5. Comparison of Structural Response Parameters Using Pushover and Response Spectrum Analyses
3.5.1. Story Displacement
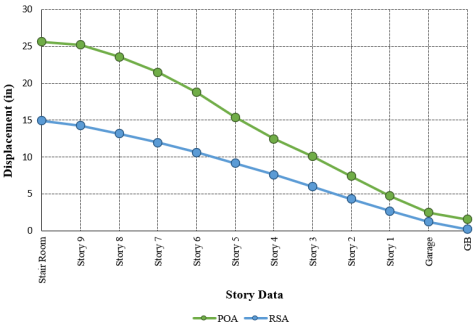
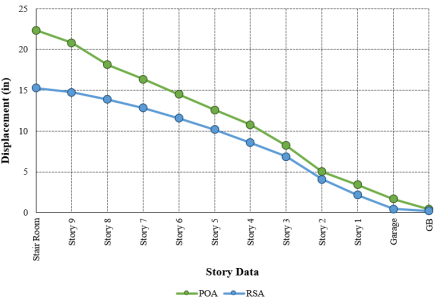
Pushover analysis is a nonlinear static analysis that progressively pushes a structure until it collapses, revealing its ultimate capacity and potential for large displacements. Response spectrum analysis, on the other hand, is a linear dynamic analysis that estimates the peak response of a structure to a seismic event, often resulting in lower displacement values. The comparative analysis of story displacements between Pushover Analysis (POA) and Response Spectrum Analysis (RSA) reveals fundamental differences in predicted structural behavior under seismic loading. For instance, at the roof level, POA predicts displacements approximately 40-50% greater than RSA values.
Figures 12 and 13 compare lateral displacements obtained from RSA and POA in the X- and Y-directions, respectively. In both directions, lateral displacement increases from the garage level to the top stories. However, POA generally predicts higher displacements than RSA, as it captures nonlinear behavior up to near-failure conditions, whereas RSA is primarily intended to keep structural response within acceptable elastic or limited inelastic ranges.
In the X-direction (
Figure 12), POA results are noticeably higher than RSA, particularly in the upper stories, with maximum displacement occurring at the stair room level. This increasing divergence indicates significant nonlinear behavior and possible stiffness irregularities in the X-direction. In contrast, the Y-direction response (
Figure 13) shows minimal difference between RSA and POA, with both analyses producing similar maximum displacements of approximately 23 inches. This suggests a more uniform stiffness distribution and stable seismic response in the Y-direction.
Overall, the structure demonstrates greater vulnerability in the X-direction, while the Y-direction exhibits a more consistent and predictable seismic performance.
Figure 12. Comparison of Story Displacement in X-direction.
Figure 13. Comparison of Story Displacement in Y-direction.
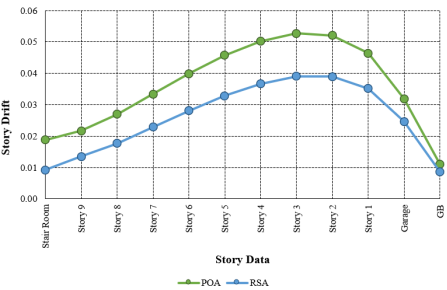
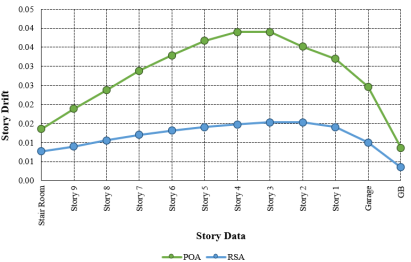
3.5.2. Story Drift
Pushover analysis is a nonlinear static procedure that captures progressive yielding, plastic hinge formation, stiffness degradation and potential failure mechanisms under increasing lateral loads, thereby providing a more realistic estimation of structural drift. In contrast, response spectrum analysis is a linear dynamic method that estimates peak seismic response and does not fully represent nonlinear behavior or large drift demands. Accordingly, POA predicts consistently higher inter-story drifts than RSA, especially in the mid-to-upper stories, with peak values reaching approximately 2.8% compared to about 1.9% from RSA at critical locations. This 30–40% increase in drift demand reflects the influence of nonlinear effects and P–Δ behavior that are not captured by the elastic assumptions inherent in RSA.
Figures 14 and 15 compare story drift ratios obtained from RSA and POA in the X- and Y-directions. In both directions, POA predicts significantly higher drift than RSA, particularly at mid-height stories, highlighting the influence of nonlinear behavior and stiffness degradation.
Figure 14. Comparison of Story Drift in X-direction.
Figure 15. Comparison of Story Drift in Y-direction.
In the X-direction (
Figure 14), POA shows a clear drift concentration at Stories 3–5, with a peak value of about 0.055, nearly twice the RSA value of 0.028. The Y-direction response (
Figure 15) exhibits a more uniform drift distribution with lower peak concentrations, overall drift levels in the Y-direction are higher than those in the X-direction, indicating greater flexibility and reduced stiffness in that direction.
Overall, the comparison confirms that while RSA yields code-compliant drift values, POA identifies substantially higher drift demands, revealing potential seismic vulnerability under strong earthquake loading.
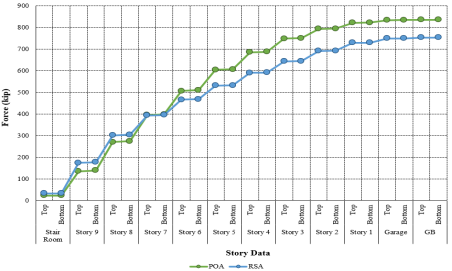
3.5.3. Story Shear
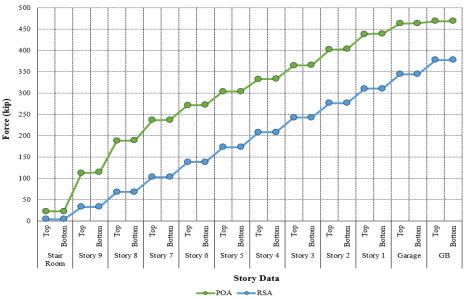
Pushover Analysis generally produces higher base and story shear demands than Response Spectrum Analysis because it captures nonlinear behavior beyond yield, including force redistribution due to plastic hinge formation. In contrast, Response Spectrum Analysis is a linear-dynamic method that reflects primarily elastic structural response. Comparative results show that POA predicts 15–25% higher shear forces in lower stories than RSA. While RSA exhibits a relatively uniform shear distribution along the building height, POA indicates shear concentration at specific stories where inelastic action and soft-story behavior develop. Consequently, RSA satisfies code-based elastic demand checks, whereas POA exposes actual shear capacity and potential weaknesses in the lateral force-resisting system under severe seismic loading.
Figures 16 and 17 compare base shear distributions obtained from RSA and POA in the X- and Y-directions. Base shear represents the total seismic force at the foundation level and its variation along the building height reflects story-wise force demand.
Figure 16. Comparison of Base Shear in X-direction.
Figure 17. Comparison of Base Shear in Y-direction.
In the X-direction (
Figure 16), POA predicts higher base shear values than RSA for most stories, particularly from the base up to Story 5. Peak forces occur at the lower levels and gradually reduce toward the top, with POA consistently exceeding RSA due to its consideration of nonlinear behavior under strong seismic loading.
A similar trend is observed in the Y-direction (
Figure 17), where POA generally produces higher shear forces than RSA, especially in the lower and mid-height stories, although the overall force magnitude is lower than in the X-direction. This indicates directional variation in lateral load resistance, with the Y-direction exhibiting a more uniform shear distribution and comparatively better seismic performance.
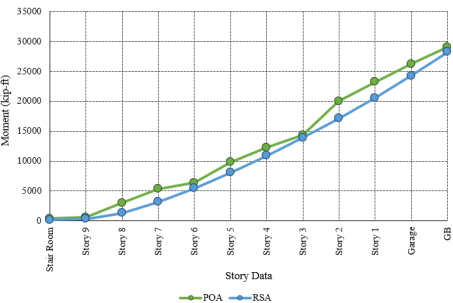
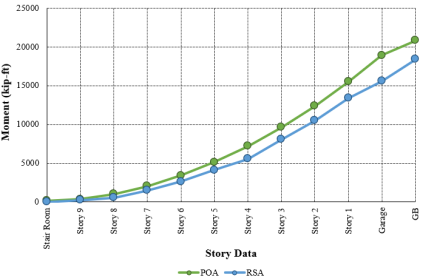
3.5.4. Overturning Moment
Pushover Analysis applies a gradually increasing lateral load to a structure until it reaches a critical point, simulating a failure scenario. This process can exaggerate the overturning moment because it pushes the structure beyond its normal operating range. Response Spectrum Analysis uses a pre-defined earthquake acceleration spectrum to determine the maximum structural response. While it accounts for dynamic effects, it doesn't necessarily capture the full extent of potential overturning moments under extreme loading conditions like pushover.
Figure 18. Comparison of Overturning Moment in X-direction.
Figure 19. Comparison of Overturning Moment in Y-direction.
Figures 18 and 19 highlight differences in the building’s rotational response under seismic loading. In the X-direction (
Figure 18), POA predicts significantly higher overturning moments than RSA, especially in lower stories with a maximum difference of about 18,000 kip-ft at the base, reflecting nonlinear effects like P-delta and plastic hinge formation.
In the Y-direction (
Figure 19), RSA and POA are closer in the upper stories but diverge in the lower third, with POA reaching 22,000 kip-ft at the base versus 18,000 kip-ft for RSA. The Y-direction moments are generally larger than in the X-direction, indicating greater susceptibility to overturning. Overall, POA captures higher rotational demands, revealing potential design-critical effects not reflected by RSA.
4. Conclusions
4.1. Research Summary
This study demonstrates ETABS as an effective and user-friendly tool for seismic and performance-based analysis, enabling realistic simulation of structural behavior and identification of potential weaknesses prior to construction.
1) Story Displacement obtained from both methods showed a similar trend, increasing with height. However, values from POA were generally higher, especially near the top stories, due to the plastic hinge formation and inelastic behavior considered in nonlinear analysis.
2) Story Drift was within acceptable limits as per BNBC guidelines in both methods. Pushover Analysis showed slightly higher drift values, which is expected due to its consideration of post-yield deformation.
3) Story shear was maximum at the base and decreased with height, as expected under lateral loading. POA showed higher shear forces than RSA at almost every level, highlighting its better representation of inelastic behavior and structural response during seismic events.
4) The overturning moment increased steadily from the top floors to the base, with maximum values observed at the ground level. POA results were consistently higher than RSA in both directions, indicating that POA captures nonlinear behavior and redistribution effects more accurately.
5) The analysis successfully identified weak zones in the structure, including areas with excessive deformation or early hinge development.
4.2. Limitations
Although this study offers valuable insights into the seismic performance of a 10-story RC building using Pushover Analysis and Response Spectrum Analysis, certain limitations should be recognized:
1) The study focuses on pushover and response spectrum analysis, which can simplify the building’s true seismic behavior. Using dynamic time-history analysis could provide more accurate representation of the structure’s response under real earthquake conditions.
2) ETABS considers perfect material behavior and ignoring construction imperfections like rigid floor diaphragms, fixed supports at the base, idealized material properties etc. Real buildings often experience irregularities, stiffness discontinuities, cracking and foundation flexibility, none of which were explicitly considered.
3) The study does not consider the effects of soil flexibility, damping or nonlinear soil response. Foundation behavior, liquefaction potential and soil–structure interaction can substantially alter seismic demand but were not included.
4) Plastic hinge properties in ETABS rely on FEMA/ATC default models, which may not fully represent local concrete cracking, bar slip, confinement irregularities, shear failures etc. Thus, actual structural behavior could differ from modeled hinge responses.
4.3. Future Scope of the Work
Based on the findings and identified limitations, several directions for future research are suggested:
1) The current analysis assumes fixed supports. Future research could evaluate soil flexibility, foundation uplift or rocking, liquefaction effects, etc. through SSI modeling to more accurately reflect ground behavior during earthquakes.
2) Further work can analyze buildings with plan irregularity, vertical setbacks, soft-story behavior, torsional irregularity, etc. These models would help understand real-world challenges where buildings rarely have perfectly regular geometry.
3) Future studies can include nonlinear dynamic time-history analysis to capture the building’s response under real earthquake records, providing a more accurate assessment of seismic performance.
Abbreviations
BNBC | Bangladesh National Building Code |
ETABS | Extended Three-Dimensional Analysis of Building System |
POA | Pushover Analysis |
RSA | Response Spectrum Analysis |
RC | Reinforced Concrete |
psf | Pounds per Square Foot |
ksf | Kilo-Pound per Square Foot |
psi | Pound per Square inch |
ksi | Kilo-Pound per Square Inch |
in | Inch |
ASCE | American Society of Civil Engineers |
Acknowledgments
In the beginning, I am profoundly grateful to my thesis supervisor, Md. Sohel Rana, Assistant Professor, Department of Civil Engineering, for his continuous support, valuable guidance and insightful suggestions throughout this research. His encouragement and mentorship played a vital role in the successful completion of this work. I am grateful for his willingness to share his knowledge and for the countless hours he dedicated to reviewing my work and providing thoughtful guidance. I would also like to express my sincere gratitude to Md. Atiqur Rahman and Ms. Fahmida Islam for their support during this research. Their valuable suggestions and encouragement contributed significantly to the successful completion of this thesis.
Author Contributions
Nafisa Anjum: Conceptualization, Formal Analysis, Investigation, Methodology, Project Administration, Resources, Software, Supervision, Validation, Visualization, Writing – original draft, Writing – review & editing
Md. Sohel Rana: Supervision, Validation
Fahmida Islam: Resources
Md. Atiqur Rahman: Resources
Funding
This study received no dedicated funding or financial support.
Data Availability Statement
The data is available from the corresponding author upon reasonable request. This publication has also included references to the data that support the findings of this investigation.
Conflicts of Interest
The authors declare no conflicts of interest.
References
| [1] |
V. M. Gote. Analysis Of Multistorey Building Using ETABS. Engineering and Technology Journal. 2025, 10(10), 7243-7249.
https://doi.org/10.47191/etj/v10i10.02
|
| [2] |
M. M. Khan, M. F. A. Khan, K. Karimuddin, K. S. Charan. Comparative Study of Linear Static and Linear Dynamic Method of Seismic Analysis of RCC Multistoried Building Using ETABS. International Journal for Research in Applied Science & Engineering Technology (IJRASET). 2022, 10(5), 735-744.
https://doi.org/10.22214/ijraset.2022.42322
|
| [3] |
P. Čada, J. Máca. COMPARISON OF METHODS USED FOR SEISMIC ANALYSIS OF STRUCTURES. Acta Polytechnica CTU Proceedings. 2017, 13(20), 20-28.
https://doi.org/10.14311/app.2017.13.0020
|
| [4] |
E. Meral, B. T. Cayci, M. Inel. Comparative study on the linear and nonlinear dynamic analysis of typical RC buildings. Revista de la Construcción. 2024, 23(3), 587-607.
https://doi.org/10.7764/RDLC.23.3.587
|
| [5] |
M. N. Mahmood, H. J. Mohamad. dynamic and pushover analysis of multi-storey reinforced concrete building using different load distribution pattern. Journal of Applied Engineering Science. 2022, 20(4), 1325-1334.
https://doi.org/10.5937/jaes0-37318
|
| [6] |
C, A. Rodríguez, A. M. R. Pérez, R. López, J. J. C. Mancera. Comparative Analysis and Evaluation of Seismic Response in Structures: Perspectives from Non-Linear Dynamic Analysis to Pushover Analysis. Applied Sciences. 2024, 14(6), 2504.
https://doi.org/10.3390/app14062504
|
| [7] |
V. VAWADRA, R. JOHN. Pushover analysis of G+20 RCC Structure with Horizontal Irregularity. Research Square. 2024.
https://doi.org/10.21203/rs.3.rs-4618065/v1
|
| [8] |
R. N. Bagu, S. G. Sanagapalli. Nonlinear Pushover Analysis of Multi-Storied Structure Using ETABS Software. International Journal of Research Publication and Reviews (IJRPR). 2023, 4(4), 4186-4190.
https://doi.org/10.55248/gengpi.4.423.37763
|
| [9] |
A. A. Hassan, A. A. Yasin. Pushover Analysis of Multi-Story Reinforced Concrete Frame Structure. Journal of Economics & Management Research. 2023, 4(2), 1-8.
https://doi.org/10.47363/JESMR/2023(4)175
|
| [10] |
M. Georgioudakis, V. Plevris. Response Spectrum Analysis of Multi-Story Shear Buildings Using Machine Learning Techniques. Computation. 2023, 11, 126.
https://doi.org/10.3390/computation11070126
|
| [11] |
H. H. Abbas, A. J. Zedan, A. M. Ibrahim, M. L. Mansour. Dynamic Analysis of a Multistory Building Using Response Spectrum Method. University of Thi-Qar Journal for Engineering Sciences. 2025, 15(1), 38-70.
https://doi.org/10.31663/utjes.15.1.685
|
| [12] |
A. Y. Yusuf, Manu. SE. static & dynamic analysis of highrise building (B+G+35) by using response spectrum, time history & pushover analysis. International Research Journal of Modernization in Engineering Technology and Science. 2023, 5(5), 9597-9623.
https://doi.org/10.13140/RG.2.2.32077.61929
|
| [13] |
H. Dilek, A. Sadeghpour. A Comparison of Different Linear and Non-linear Structural Analysis Methods. ENG Transactions. 2022, 3, 1-9.
https://doi.org/10.52547/engt.3.2208102112805
|
| [14] |
S. D. Maniyar, P. J. Salunke. Comparative Study of Response Spectrum and Pushover Analysis for G+8+T RCC Buildings. International Journal of Innovative Research in Science, Engineering and Technology (IJIRSET). 2023, 12(8), 10698-10704.
https://doi.org/10.15680/IJIRSET.2023.1208024
|
| [15] |
M. Youcef, K. Abderrahmane, C. Benazouz. Seismic Performance of RC Building Using Spectrum Response and Pushover Analyses. Facing the Challenges in Structural Engineering. 2017, 158–169.
https://doi.org/10.1007/978-3-319-61914-9_13
|
| [16] |
Md. R. Basha, S. Yajdani. A Comparative Study on Equivalent Static Pushover Analysis and Response Spectrum Pushover Analysis. International Journal of Innovative Research in Science, Engineering and Technology (IJIRSET). 2016, 5(2), 2250-2255.
https://doi.org/10.15680/IJIRSET.2016.050123
|
| [17] |
K. M. Rana. Seismic Analysis of Multistory Building Using ETABS. International Journal of Science and Research (IJSR). 2025, 14(10), 1350-1357.
https://dx.doi.org/10.21275/SR251026111229
|
| [18] |
M. Mojarab, N. Norouzi, M. Bayati, Z. Asadi, M. Eslami, M. G. Ashtiany, A. L. Helaly, S. Khoshnevis. Assessment of seismic hazard including equivalent-linear soil response analysis for Dhaka Metropolitan Region, Bangladesh. Natural Hazards. 2023, 117, 3145–3180.
https://doi.org/10.1007/s11069-023-05981-4
|
| [19] |
Hossain Md. S., M. KABIR, S. ISLAM. Seismic Hazard Analysis at Site Specific Condition: Case Study in Araihazar, Bangladesh. Iut Journal of Engineering and Technology (JET). 2023, 15(1), 8-20.
|
| [20] |
Md. A. Islam, Md. A. A. Sarkar, H. M. A. Mahzuz, Md. J. Alam. A Study on Seismic Capacity Evaluation of Existing RC Buildings by Visual Rating Method in Sylhet City. Journal of Advances in Civil and Mechanical Engineering. 2024, 1(1), 1-12.
|
| [21] |
Md. S. H. Mahi, T. A. Ridoy, S. Hasan. Seismic Performance Assessment of Regular and Irregular RC Buildings Under BNBC 2020 Using ETABS. Disaster in Civil Engineering and Architecture. 2025, 2(1), 13-30.
https://doi.org/10.70028/dcea.v1i2.28
|
| [22] |
R. Folić, M. Čokić. Fragility and Vulnerability Analysis of an RC Building with the Application of Nonlinear Analysis. Buildings. 2021, 11(9), 390.
https://doi.org/10.3390/buildings11090390
|
| [23] |
R. V. American Society of Civil Engineers, Prestandard and Commentary for the Seismic Rehabilitation of Buildings, Washington, D. C.: Federal Emergency Management Agency, 2000.
|
Cite This Article
-
APA Style
Anjum, N., Rana, M. S., Islam, F., Rahman, M. A. (2026). Seismic Performance Evaluation of a 10-story RC Building Using Pushover Analysis & Response Spectrum Analysis. American Journal of Civil Engineering, 14(1), 20-38. https://doi.org/10.11648/j.ajce.20261401.13
 Copy
|
Copy
|
 Download
ACS Style
Anjum, N.; Rana, M. S.; Islam, F.; Rahman, M. A. Seismic Performance Evaluation of a 10-story RC Building Using Pushover Analysis & Response Spectrum Analysis. Am. J. Civ. Eng. 2026, 14(1), 20-38. doi: 10.11648/j.ajce.20261401.13
Copy
|
Download
AMA Style
Anjum N, Rana MS, Islam F, Rahman MA. Seismic Performance Evaluation of a 10-story RC Building Using Pushover Analysis & Response Spectrum Analysis. Am J Civ Eng. 2026;14(1):20-38. doi: 10.11648/j.ajce.20261401.13
Copy
|
Download
-
@article{10.11648/j.ajce.20261401.13,
  author = {Nafisa Anjum and Md. Sohel Rana and Fahmida Islam and Md. Atiqur Rahman},
  title = {Seismic Performance Evaluation of a 10-story RC Building Using Pushover Analysis & Response Spectrum Analysis},
  journal = {American Journal of Civil Engineering},
  volume = {14},
  number = {1},
  pages = {20-38},
  doi = {10.11648/j.ajce.20261401.13},
  url = {https://doi.org/10.11648/j.ajce.20261401.13},
  eprint = {https://article.sciencepublishinggroup.com/pdf/10.11648.j.ajce.20261401.13},
  abstract = {Seismic performance evaluation of high-rise buildings plays a crucial role in maintaining structural safety within earthquake-prone regions. The growing frequency and intensity of seismic activities worldwide require innovative approaches to structural design that focus on resilience, creating sustainable solutions and safety assurance. The conventional force-based methods fail to properly capture nonlinear structural behaviors. On the other hand, energy-based seismic analysis provides a better understanding of how seismic energy get absorbed and distributed within buildings that is to say, the pathways through which earthquake energy flows. This study analyzes the behavior of a 10-story reinforced concrete (RC) building using pushover analysis (POA) and response spectrum analysis (RSA) in ETABS, following the Bangladesh National Building Code (BNBC 2020). The building is modeled with typical gravity and lateral load-resisting systems, considering BNBC seismic code specifications. The POA provides insights into the nonlinear performance of the structure, identifying hinge locations and performance levels under increasing lateral loads. Meanwhile, RSA assesses building responses to seismic motions through vibration pattern studies. A comparative evaluation of base shear, story displacement and drift ratios is conducted to determine whether the structure meets BNBC safety limits. Results suggest that while response spectrum analysis is effective for preliminary design, pushover analysis offers deeper insight into potential failure mechanisms. This study emphasizes the significance of integrating both static and dynamic approaches for a comprehensive seismic evaluation of high-rise buildings.},
 year = {2026}
}
Copy
|
Download
-
TY  - JOUR
T1  - Seismic Performance Evaluation of a 10-story RC Building Using Pushover Analysis & Response Spectrum Analysis
AU  - Nafisa Anjum
AU  - Md. Sohel Rana
AU  - Fahmida Islam
AU  - Md. Atiqur Rahman
Y1  - 2026/01/31
PY  - 2026
N1  - https://doi.org/10.11648/j.ajce.20261401.13
DO  - 10.11648/j.ajce.20261401.13
T2  - American Journal of Civil Engineering
JF  - American Journal of Civil Engineering
JO  - American Journal of Civil Engineering
SP  - 20
EP  - 38
PB  - Science Publishing Group
SN  - 2330-8737
UR  - https://doi.org/10.11648/j.ajce.20261401.13
AB  - Seismic performance evaluation of high-rise buildings plays a crucial role in maintaining structural safety within earthquake-prone regions. The growing frequency and intensity of seismic activities worldwide require innovative approaches to structural design that focus on resilience, creating sustainable solutions and safety assurance. The conventional force-based methods fail to properly capture nonlinear structural behaviors. On the other hand, energy-based seismic analysis provides a better understanding of how seismic energy get absorbed and distributed within buildings that is to say, the pathways through which earthquake energy flows. This study analyzes the behavior of a 10-story reinforced concrete (RC) building using pushover analysis (POA) and response spectrum analysis (RSA) in ETABS, following the Bangladesh National Building Code (BNBC 2020). The building is modeled with typical gravity and lateral load-resisting systems, considering BNBC seismic code specifications. The POA provides insights into the nonlinear performance of the structure, identifying hinge locations and performance levels under increasing lateral loads. Meanwhile, RSA assesses building responses to seismic motions through vibration pattern studies. A comparative evaluation of base shear, story displacement and drift ratios is conducted to determine whether the structure meets BNBC safety limits. Results suggest that while response spectrum analysis is effective for preliminary design, pushover analysis offers deeper insight into potential failure mechanisms. This study emphasizes the significance of integrating both static and dynamic approaches for a comprehensive seismic evaluation of high-rise buildings.
VL  - 14
IS  - 1
ER  -
Copy
|
Download