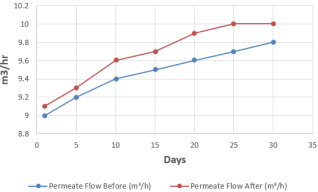
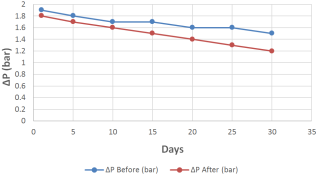
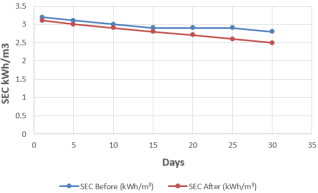
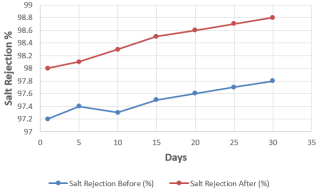
Reverse Osmosis (RO) systems are extensively employed in industrial water purification due to their ability to produce high-quality permeate for critical processes. However, long-term operation often suffers from performance deterioration caused by membrane fouling, sensor drift, and unstable operating conditions. These issues can lead to reduced permeate quality, increased differential pressure, and higher specific energy consumption, ultimately increasing operating costs and reducing system reliability. This study investigates the impact of online sensor calibration combined with continuous real-time monitoring on the operational performance of a 10 m3/h industrial RO plant over a one-month evaluation period. Key operational parameters—including permeate flow rate, differential pressure (ΔP), specific energy consumption (SEC), permeate total dissolved solids (TDS), salt rejection, and system recovery—were systematically monitored and analyzed before and after the implementation of a calibrated online monitoring system. The calibration process ensured improved accuracy and reliability of critical sensors, enabling more precise control of operating conditions and early identification of performance deviations. The results indicate a measurable improvement in both hydraulic and energy efficiency following the implementation of online calibration and real-time monitoring. Average permeate flow increased from 9.46 m3/h to 9.66 m3/h, while differential pressure across the membranes decreased from 1.69 bar to 1.50 bar, suggesting reduced fouling resistance and improved membrane performance. Furthermore, specific energy consumption decreased from 2.97 kWh/m3 to 2.80 kWh/m3, demonstrating enhanced energy efficiency without compromising system recovery, which remained stable throughout the study period. In terms of water quality, permeate TDS levels showed a significant reduction from a range of 28.6–22.7 ppm to 20.5–12.3 ppm. Correspondingly, average salt rejection improved from 97.5% to 98.4%, reflecting better separation efficiency and process control. These improvements collectively confirm that accurate online calibration and continuous real-time monitoring play a crucial role in mitigating membrane fouling, stabilizing system operation, and optimizing energy consumption. Overall, the findings highlight the importance of advanced monitoring and calibration strategies as effective operational tools for enhancing performance, ensuring consistent permeate quality, and improving the sustainability of industrial RO systems.
| Published in | American Journal of Chemical Engineering (Volume 14, Issue 3) |
| DOI | 10.11648/j.ajche.20261403.11 |
| Page(s) | 54-59 |
| Creative Commons |
This is an Open Access article, distributed under the terms of the Creative Commons Attribution 4.0 International License (http://creativecommons.org/licenses/by/4.0/), which permits unrestricted use, distribution and reproduction in any medium or format, provided the original work is properly cited. |
| Copyright |
Copyright © The Author(s), 2026. Published by Science Publishing Group |
Reverse Osmosis, Online Calibration, Real-time Monitoring, Salt Rejection, Specific Energy Consumption, Industrial Water Treatment
Day | Permeate Flow Before (m3/h) | Permeate Flow After (m3/h) | Salt Rejection Before (%) | Salt Rejection After (%) | ΔP Before (bar) | ΔP After (bar) | SEC Before (kWh/m3) | SEC After (kWh/m3) |
|---|---|---|---|---|---|---|---|---|
1 | 9.0 | 9.1 | 97.2 | 98.0 | 1.9 | 1.8 | 3.2 | 3.1 |
5 | 9.2 | 9.3 | 97.4 | 98.1 | 1.8 | 1.7 | 3.1 | 3.0 |
10 | 9.4 | 9.6 | 97.3 | 98.3 | 1.7 | 1.6 | 3.0 | 2.9 |
15 | 9.5 | 9.7 | 97.5 | 98.5 | 1.7 | 1.5 | 2.9 | 2.8 |
20 | 9.6 | 9.9 | 97.6 | 98.6 | 1.6 | 1.4 | 2.9 | 2.7 |
25 | 9.7 | 10.0 | 97.7 | 98.7 | 1.6 | 1.3 | 2.9 | 2.6 |
30 | 9.8 | 10.0 | 97.8 | 98.8 | 1.5 | 1.2 | 2.8 | 2.5 |
Parameter | Before Implementation | After Implementation |
|---|---|---|
Permeate Flow (m3/h) | 9.0 | 10 |
Salt Rejection (%) | 97.2 | 98.8 |
Differential Pressure (bar) | 1.9 | 1.2 |
Specific Energy Consumption (kWh/m3) | 3.2 | 2.5 |
Day | Feed TDS (ppm) | Permeate TDS Before (ppm) | Permeate TDS After (ppm) | Salt Rejection Before (%) | Salt Rejection After (%) | Recovery (%) |
|---|---|---|---|---|---|---|
1 | 1025 | 97.2 | 28.6 | 98.0 | 20.5 | 1025 |
5 | 1030 | 97.3 | 27.8 | 98.1 | 19.5 | 1030 |
10 | 1035 | 97.4 | 26.9 | 98.3 | 17.5 | 1035 |
15 | 1040 | 97.5 | 26.0 | 98.5 | 15.6 | 1040 |
20 | 1045 | 97.6 | 24.9 | 98.6 | 14.5 | 1045 |
25 | 1050 | 97.7 | 23.5 | 98.7 | 13.7 | 1050 |
30 | 1057 | 97.8 | 23.3 | 98.8 | 12.7 | 1057 |
RO | Reverse Osmosis |
TDS | Total Dissolved Solid |
SEC | Specific Energy Consumption |
SCADA | Supervisory Control and Data Acquisition |
(ΔP) | Differential Pressure |
| [1] | Lee, J., Kim, S. (2021). Applied Thermal Engineering, 182, 116046. |
| [2] | Zhang, L. et al. (2021). Journal of Membrane Science, 635, 119456. |
| [3] | Kumar, A. et al. (2022). Energy Conversion and Management, 254, 115224. |
| [4] | Chebil, S. et al. (2024). Water, 16(13), 1892. |
| [5] | Prediction of reverse osmosis membrane fouling in water reuse by integrated adsorption and data-driven models. Desalination, 576, 117353 (2024). Data-driven fouling prediction models. |
| [6] | Gao, L., et al. Real-Time Energy Optimal Control of Two-Stage Reverse Osmosis. Water, 17(16), 2363 (2025). Real-time control for energy optimization using plant sensor data. |
| [7] | Reverse Osmosis Membrane Engineering: Multidirectional Analysis Using Bibliometric, Machine Learning, Data, and Text Mining Approaches. Membranes, 14(12), 259 (2024). Bibliometric trends, including AI for RO optimization. |
| [8] | Screening the Performance of a Reverse Osmosis Pilot-Scale Process Treating Blended Feedwater. Membranes, 14(8), 164 (2024). Pilot-scale RO performance assessment. |
| [9] | Control strategies for reverse osmosis desalination systems using modern intelligent monitoring techniques. Desalination, 2025 (in press). Smart control architectures for RO optimization. |
| [10] | F. Hussein, Y., Impact of Temperature on RO Performance and Energy Consumption. Desalination Studies, 2025. |
| [11] | Patel, A., Effects of Feed Water Salinity on RO Performance. Desalination and Water Treatment, 2023. |
| [12] | Malik, S., Innovations in RO Instrumentation and Sensor Calibration. Journal of Water Process Engineering, 2024. |
| [13] | Zhang, D., et al., Impact of Conductivity Sensor Drift on RO Operational Efficiency. Water Quality Journal, 2021. |
| [14] | Abdullah, N., Comparison of Fouling Mitigation Techniques in RO Plants. Membrane Technology Review, 2023. |
| [15] | Chandran, S., Automated Calibration Framework for Industrial RO Plants. Industrial Instrumentation Journal, 2024. |
| [16] | Ozuah, O. G., Low-Energy RO Performance Using Variable Pressure Control. Energy & Fuels, 2022. |
| [17] | Reyes, M., et al., Fouling Rate Analysis in Brackish Water RO Operations. Journal of Environmental Engineering, 2020. |
| [18] | Kaur, R., Novel Membrane Cleaning Strategies for Industrial RO. Desalination Innovation, 2021. |
| [19] | Ibrahim, H., Hybrid NF-RO Systems for Peak Load Performance. Clean Water Journal, 2025. |
| [20] | Yousry, A., Performance Modeling and Real-Time Monitoring of RO Plants. Utilities Performance Journal, 2023. |
| [21] | Ahmed, S., & Hussein, M., Analytics-Driven Fouling Prediction Models in RO Water Reuse. Machine Intelligence and Water Journal, 2025. |
| [22] | Singh, D., Real-Time Monitoring and Plant Control of RO Membrane Fouling. Industrial Membranes Review, 2024. |
| [23] | Fernando, R., Comparative Energy Metrics for RO Plant Optimization. Energy Efficiency Journal, 2025. |
| [24] | Malik, T. R., Calibration Effects on RO Process Control Systems. Automation in Water Industry, 2023. |
| [25] | Khan, F., et al., Assessment of RO System Stability with IoT Based Sensors. Journal of Water Technology, 2025. |
APA Style
Abbas, S., Faizan, M. (2026). Reverse Osmosis (RO) Plant Performance Improvement Using Online Calibration and Monitoring: An Industrial Case Study. American Journal of Chemical Engineering, 14(3), 54-59. https://doi.org/10.11648/j.ajche.20261403.11
ACS Style
Abbas, S.; Faizan, M. Reverse Osmosis (RO) Plant Performance Improvement Using Online Calibration and Monitoring: An Industrial Case Study. Am. J. Chem. Eng. 2026, 14(3), 54-59. doi: 10.11648/j.ajche.20261403.11
AMA Style
Abbas S, Faizan M. Reverse Osmosis (RO) Plant Performance Improvement Using Online Calibration and Monitoring: An Industrial Case Study. Am J Chem Eng. 2026;14(3):54-59. doi: 10.11648/j.ajche.20261403.11
@article{10.11648/j.ajche.20261403.11,
  author = {Shafqat Abbas and Muhammad Faizan},
  title = {Reverse Osmosis (RO) Plant Performance Improvement Using Online Calibration and Monitoring: An Industrial Case Study},
  journal = {American Journal of Chemical Engineering},
  volume = {14},
  number = {3},
  pages = {54-59},
  doi = {10.11648/j.ajche.20261403.11},
  url = {https://doi.org/10.11648/j.ajche.20261403.11},
  eprint = {https://article.sciencepublishinggroup.com/pdf/10.11648.j.ajche.20261403.11},
  abstract = {Reverse Osmosis (RO) systems are extensively employed in industrial water purification due to their ability to produce high-quality permeate for critical processes. However, long-term operation often suffers from performance deterioration caused by membrane fouling, sensor drift, and unstable operating conditions. These issues can lead to reduced permeate quality, increased differential pressure, and higher specific energy consumption, ultimately increasing operating costs and reducing system reliability. This study investigates the impact of online sensor calibration combined with continuous real-time monitoring on the operational performance of a 10 m3/h industrial RO plant over a one-month evaluation period. Key operational parameters—including permeate flow rate, differential pressure (ΔP), specific energy consumption (SEC), permeate total dissolved solids (TDS), salt rejection, and system recovery—were systematically monitored and analyzed before and after the implementation of a calibrated online monitoring system. The calibration process ensured improved accuracy and reliability of critical sensors, enabling more precise control of operating conditions and early identification of performance deviations. The results indicate a measurable improvement in both hydraulic and energy efficiency following the implementation of online calibration and real-time monitoring. Average permeate flow increased from 9.46 m3/h to 9.66 m3/h, while differential pressure across the membranes decreased from 1.69 bar to 1.50 bar, suggesting reduced fouling resistance and improved membrane performance. Furthermore, specific energy consumption decreased from 2.97 kWh/m3 to 2.80 kWh/m3, demonstrating enhanced energy efficiency without compromising system recovery, which remained stable throughout the study period. In terms of water quality, permeate TDS levels showed a significant reduction from a range of 28.6–22.7 ppm to 20.5–12.3 ppm. Correspondingly, average salt rejection improved from 97.5% to 98.4%, reflecting better separation efficiency and process control. These improvements collectively confirm that accurate online calibration and continuous real-time monitoring play a crucial role in mitigating membrane fouling, stabilizing system operation, and optimizing energy consumption. Overall, the findings highlight the importance of advanced monitoring and calibration strategies as effective operational tools for enhancing performance, ensuring consistent permeate quality, and improving the sustainability of industrial RO systems.},
 year = {2026}
}
TY  - JOUR
T1  - Reverse Osmosis (RO) Plant Performance Improvement Using Online Calibration and Monitoring: An Industrial Case Study
AU  - Shafqat Abbas
AU  - Muhammad Faizan
Y1  - 2026/06/10
PY  - 2026
N1  - https://doi.org/10.11648/j.ajche.20261403.11
DO  - 10.11648/j.ajche.20261403.11
T2  - American Journal of Chemical Engineering
JF  - American Journal of Chemical Engineering
JO  - American Journal of Chemical Engineering
SP  - 54
EP  - 59
PB  - Science Publishing Group
SN  - 2330-8613
UR  - https://doi.org/10.11648/j.ajche.20261403.11
AB  - Reverse Osmosis (RO) systems are extensively employed in industrial water purification due to their ability to produce high-quality permeate for critical processes. However, long-term operation often suffers from performance deterioration caused by membrane fouling, sensor drift, and unstable operating conditions. These issues can lead to reduced permeate quality, increased differential pressure, and higher specific energy consumption, ultimately increasing operating costs and reducing system reliability. This study investigates the impact of online sensor calibration combined with continuous real-time monitoring on the operational performance of a 10 m3/h industrial RO plant over a one-month evaluation period. Key operational parameters—including permeate flow rate, differential pressure (ΔP), specific energy consumption (SEC), permeate total dissolved solids (TDS), salt rejection, and system recovery—were systematically monitored and analyzed before and after the implementation of a calibrated online monitoring system. The calibration process ensured improved accuracy and reliability of critical sensors, enabling more precise control of operating conditions and early identification of performance deviations. The results indicate a measurable improvement in both hydraulic and energy efficiency following the implementation of online calibration and real-time monitoring. Average permeate flow increased from 9.46 m3/h to 9.66 m3/h, while differential pressure across the membranes decreased from 1.69 bar to 1.50 bar, suggesting reduced fouling resistance and improved membrane performance. Furthermore, specific energy consumption decreased from 2.97 kWh/m3 to 2.80 kWh/m3, demonstrating enhanced energy efficiency without compromising system recovery, which remained stable throughout the study period. In terms of water quality, permeate TDS levels showed a significant reduction from a range of 28.6–22.7 ppm to 20.5–12.3 ppm. Correspondingly, average salt rejection improved from 97.5% to 98.4%, reflecting better separation efficiency and process control. These improvements collectively confirm that accurate online calibration and continuous real-time monitoring play a crucial role in mitigating membrane fouling, stabilizing system operation, and optimizing energy consumption. Overall, the findings highlight the importance of advanced monitoring and calibration strategies as effective operational tools for enhancing performance, ensuring consistent permeate quality, and improving the sustainability of industrial RO systems.
VL  - 14
IS  - 3
ER  -
Department of Chemical Engineering, COMSATS University Islamabad, Lahore, Pakistan
Department of Chemical Engineering, University of the Punjab, Lahore, Pakistan
Information