2. Materials and Methods
2.1. Materials
The materials used in this research work were plant data Refinery which and includes: Inlet feed operating conditions and Comprehensive feed compositions and Chemical Engineering Software (Aspen Hysys version 14).
2.2. Methods
2.2.1. Solution Technique
Aspen Hysys Model Process Flow Diagram (PDF)
Figure 1. Aspen Hysys Process Flow Diagram of the Waste to Energy Plant.
The process flow diagram represents an integrated waste-to-energy system designed to recover thermal and pressure energy from flue gas generated in a fluid catalytic cracking (FCC) regenerator and convert it into useful mechanical and electrical power using Aspen HYSYS. The system combines a flue-gas expander, a heat recovery steam generator (HRSG), a steam turbine generator, and a condenser arranged in a logical energy-recovery sequence. Hot flue gas from the FCC regenerator enters the system as stream FG-REG and is first routed to a flash separator labeled SEP-FG. The primary function of this unit is gas cleaning and conditioning. Any entrained solids, condensable moisture, or trace impurities that may adversely affect downstream rotating equipment are removed. A small vent stream exits the bottom of the separator, while the cleaned flue gas leaves the top and proceeds to the gas expander section. The cleaned flue gas flows into the gas expander EXP-FG, which functions as a flue-gas turbine. In this unit, the high-temperature and moderately pressurized gas undergoes expansion, resulting in a significant drop in pressure and temperature. During this expansion, a portion of the thermal and pressure energy of the flue gas is converted into mechanical work, represented by the energy stream EXP-Q. This recovered energy can be used to generate electricity directly or drive auxiliary equipment. The expanded gas exits the turbine as stream FG-EXP. Following expansion, the flue gas enters the heat recovery steam generator (HRSG) section, which consists of three main heat exchangers arranged in series: an economizer, an evaporator, and a superheater. First, stream FG-EXP passes through the economizer ECON. In this exchanger, sensible heat from the flue gas is transferred to high-pressure boiler feedwater entering as FW-HP. The feedwater temperature is raised, producing hot boiler feedwater BFW-HOT, while the flue gas temperature is reduced and exits as FG-OUT. This step improves overall thermal efficiency by recovering low-grade sensible heat that would otherwise be wasted. The partially cooled flue gas then flows into the evaporator EVAP. In this unit, additional heat is extracted from the flue gas to convert the hot boiler feedwater into saturated steam. The flue gas exits the evaporator as FG-VOUT, while saturated steam is generated and labeled SAT-STEAM. This section represents the main steam generation stage of the HRSG, where the latent heat of vaporization is supplied by the flue gas. Next, the flue gas enters the superheater SH, where the remaining high-grade thermal energy is used to increase the temperature of the saturated steam. The steam is superheated to a higher temperature and exits as HP-STEAM, suitable for efficient expansion in a steam turbine. The flue gas, having given up most of its usable thermal energy, leaves the superheater as FG-STACK and is discharged safely to the stack at a much lower temperature, minimizing environmental heat losses. The high-pressure superheated steam HP-STEAM is then directed to the steam turbine generator ST-GEN. In this unit, the steam expands from high pressure to low pressure, converting its thermal energy into mechanical work. This work is represented by the energy stream Q-TUB, which corresponds to electrical power generation. The steam turbine therefore constitutes the second power-generation stage of the waste-to-energy system, complementing the flue-gas expander. After expansion, the low-pressure exhaust steam exits the turbine as ST-EXH and enters the condenser COND. Cooling water enters the condenser as CW-IN and absorbs the latent heat of the exhaust steam. As a result, the steam condenses into liquid water and exits as COND-OUT, while the warmed cooling water leaves as CW-OUT. The condensate can be recycled back to the boiler feedwater system, thereby closing the steam cycle and ensuring continuous operation.
2.2.2. Input Data
The data for the simulation are presented in
Table 1.
Table 1. Flue Gas Characterization.
Component | Mole Fraction |
N2 | 0.73 |
CO2 | 0.14 |
CO | 0.04 |
O2 | 0.02 |
H2O | 0.0690 |
SO2 | 0.010 |
Table 1 shows the flue gas composition from plant.
Table 1 presents the characterized composition of the FCC regenerator flue gas used as the plant input data for the simulation. This flue gas composition is typical of regenerator exhaust streams because the FCC regenerator operates by burning coke deposits off the circulating catalyst using large quantities of air. As a result, the exhaust gas is dominated by nitrogen from combustion air, together with carbon oxides, excess oxygen, water vapour, and trace sulfur species formed from sulfur contained in the coke and feedstock. Nitrogen (N
2) has the highest mole fraction at 0.73, meaning it makes up about 73% of the flue gas. This is expected because atmospheric air is roughly 79% nitrogen, and nitrogen is largely inert under FCC regenerator conditions. During regeneration, oxygen from air reacts primarily with coke, while nitrogen passes through unchanged. Therefore, a high nitrogen content is a strong indicator that air is the combustion medium and that the flue gas is essentially a diluted mixture where nitrogen acts as a carrier gas. In energy recovery terms, the dominance of nitrogen increases the total volumetric flowrate of flue gas and influences heat capacity and heat-transfer behavior in the HRSG. It also reduces the partial pressure of reactive species but does not reduce the sensible heat content, since nitrogen still carries significant thermal energy at high temperatures. Carbon dioxide (CO
2) constitutes 0.14 (14%), which reflects the extent of complete combustion of coke during catalyst regeneration. In the regenerator, the main reaction is coke oxidation to CO
2, and the amount of CO
2 formed depends on coke yield from the reactor, air rate, regenerator temperature, and catalyst circulation. A CO
2 level of 14% indicates strong oxidation activity and suggests that a substantial portion of carbon is being fully converted to CO
2 rather than remaining as CO. From an environmental and sustainability perspective, CO
2 is the primary greenhouse gas emitted from FCC operation; however, for waste-to-energy integration, a high CO
2 fraction often correlates with high regenerator heat release, which increases the thermal energy available for recovery. Carbon monoxide (CO) is reported at 0.04 (4%). The presence of CO indicates that a fraction of coke combustion is incomplete, producing CO rather than fully oxidizing to CO
2. In many FCC units, CO formation is influenced by regenerator design (single-stage vs two-stage), air distribution, mixing efficiency, catalyst-to-air contact, and whether CO combustion promoters are used. A 4% CO concentration is not unusual and suggests that while combustion is largely effective, there remains a measurable amount of partially oxidized carbon. From a process and safety standpoint, CO is significant because it is combustible; downstream equipment must be designed to handle CO safely to avoid afterburning, hot spots, or oxidation events in the flue gas path. In simulation, CO also contributes to thermodynamic properties and may affect energy recovery calculations through its specific heat and potential oxidation if oxygen is present and reactions were allowed (though in your model it is treated as inert with respect to reaction). Oxygen (O
2) is present at 0.02 (2%), indicating excess air operation. In FCC regenerators, excess oxygen is intentionally maintained to ensure complete removal of coke from the catalyst and stable operation. The oxygen concentration provides a practical indicator of combustion control and air-to-coke ratio. Too little oxygen would lead to higher CO formation, incomplete regeneration, and reduced catalyst activity in the reactor. Too much oxygen can increase afterburn risk and may accelerate equipment corrosion. For waste heat recovery systems, the presence of oxygen also means that flue gas remains mildly oxidizing, which has implications for materials selection and corrosion control in the HRSG and expander. Water vapour (H
2O) has a mole fraction of 0.069 (6.9%). Water in FCC regenerator flue gas typically originates from the combustion of hydrogen in the coke, residual steam introduced for catalyst stripping, and moisture in the combustion air. This value is reasonable and important because water vapour increases the specific heat capacity of the flue gas, thereby increasing the sensible heat carried at high temperatures. However, water vapour also influences dew point and condensation behavior. While your system operates at very high temperatures where condensation is unlikely, as the flue gas cools toward stack conditions, water vapour becomes relevant for predicting acid dew point when SO
2 is present, which can lead to low-temperature corrosion. Therefore, the measured water content is a critical input for designing safe HRSG exit temperatures and selecting corrosion-resistant materials. Sulfur dioxide (SO
2) is given as 0.010 (1%). This component originates from the oxidation of sulfur compounds in the coke deposits formed from sulfur-containing crude or feedstock. The presence of SO
2 is important even at low concentrations because it strongly affects environmental compliance and corrosion potential. SO
2 can contribute to acid formation (such as sulfurous and sulfuric acids) in the presence of oxygen and water, especially when temperatures fall below the acid dew point. In heat recovery applications, this makes the flue gas outlet temperature and heat exchanger surface temperature critical, as cooling too far may promote acid condensation and rapid metal attack. Therefore, SO
2 content is a key design and operational constraint that influences flue gas treatment requirements, materials selection, and minimum stack temperature targets. Overall, the plant flue gas characterization in
Table 1 provides a realistic basis for the simulation and performance assessment of the waste-to-energy plant. The high nitrogen concentration confirms air-based combustion and explains the large flue gas throughput, while the CO
2 and CO fractions reflect combustion effectiveness and regenerator operation. The presence of O
2 indicates excess air control, and the combined H
2O and SO
2 contents highlight potential corrosion and environmental considerations as the flue gas is cooled through the HRSG. As an input dataset, this composition is central to accurate prediction of thermodynamic properties, expander work recovery, HRSG heat-transfer behavior, and overall power generation potential of the integrated system.
2.2.3. General Material and Energy Balance
The general equation for material and energy balance is presented as follows:
2.2.4. Material Balance
The general material balance of the plant can be written as follows:
(1)
For a steady state process without chemical reaction equation (
1) reduces to:
(2)
2.2.5. Energy Balance
(3)
For a steady state process without chemical reaction equation (
4) reduces to:
(4)
2.2.6. Sensitivity Analysis
Sensitivity analysis for waste to energy plant using flue gas from fluid catalytic cracking regenerator was performed by investigating the influence of critical operating conditions such as effect of flue gas temperature and mass flow rate from fluid catalytic cracking regenerator on expander (gas turbine) and generator (steam turbine) power output and efficiency. Sensitivity analysis results was obtained using Aspen Hysys case study tool.
3. Results and Discussion
The results obtained from Aspen Hysys software are presented as follows.
3.1. Validation of Model Results
Validation of model results for waste to energy plant using flue gas from fluid catalytic cracking regenerator was carried out and the results obtained are presented in
Tables 2 to 4.
3.1.1. Validation of Plant Data with Expander (Gas Turbine) Model
Table 2. Validation of Expander (Gas Turbine) Model.
Parameter | Plant | Model |
Polytropic Efficiency (%) | 87 | 85 |
Power Output (MW) | 28.20 | 27.19 |
Adiabatic Fluid Head (m) | 183.5 | 185 |
Output Temperature (oC) | 590 | 585.3 |
Output Pressure (kPa) | 123 | 120 |
The validation results in
Table 2 show that the expander (gas turbine) model reproduces the real plant performance very closely, with only small deviations for all key parameters. The polytropic efficiency from plant data is 87%, while the model predicts 85%. This difference of about 2 percentage points (roughly 2–3% relative error) indicates that the model slightly under-predicts the internal efficiency of the turbine. In practice, such a small deviation is acceptable for process design and energy integration studies, especially considering uncertainties in plant measurements, operating fluctuations, and assumptions made in the thermodynamic correlations and property packages in Aspen HYSYS. For power output, the plant delivers 28.20 MW while the model predicts 27.19 MW, giving a difference of about 1 MW (around 3–4% lower than plant). This shows that the model captures the overall work recovery capability of the gas turbine very well. The slight under-prediction is consistent with the slightly lower polytropic efficiency in the model and may also reflect idealizations such as neglecting some mechanical losses, shaft power to auxiliaries, or small variations in actual flue gas composition and flowrate compared to the nominal values used in the simulation. Nevertheless, predicting 27.19 MW against a real 28.20 MW confirms that the model is reliable for estimating power generation potential from FCC regenerator flue gas. The adiabatic fluid head shows excellent agreement: 183.5 m from plant data versus 185 m from the model. The difference is less than 1% and indicates that the simulated pressure–enthalpy change across the expander is almost identical to what is observed in the actual machine. This suggests that the thermodynamic property methods, expansion ratio, and flow conditions used in the model are highly representative of real operation. Similarly, the outlet temperature comparison is very good: 590°C in the plant versus 585.3°C in the model, a difference of less than 5°C (under 1% deviation). This close match confirms that the model accurately predicts the cooling effect associated with expansion and the energy extracted as shaft work. It also reinforces confidence in the heat-integration calculations downstream, since the flue-gas temperature leaving the expander sets the boundary condition for the HRSG (economizer, evaporator, and superheater sections).
3.1.2. Validation of Plant Data with Generator (Steam Turbine) Model
Table 3. Validation of Generator (Steam Turbine) Model.
Parameter | Plant | Model |
Polytropic Efficiency (%) | 90 | 86 |
Power Output (MW) | 28.20 | 26.52 |
Adiabatic Fluid Head (m) | 1122 | 1104 |
Output Temperature (oC) | 450 | 442.4 |
Output Pressure (kPa) | 4000 | 3985 |
The validation results presented in
Table 3 demonstrate that the Generator (Steam Turbine) model developed in the simulation closely reproduces actual plant performance, with minor deviations that fall well within acceptable engineering limits. Each parameter polytropic efficiency, power output, adiabatic fluid head, outlet temperature, and outlet pressure shows strong agreement between the plant data and the model, confirming that the steam turbine is accurately represented within the integrated waste-heat-to-power system.
The polytropic efficiency comparison shows that the plant turbine operates at 90%, while the model predicts 86%. This 4-percentage-point difference corresponds to a relative deviation of less than 5%, which is considered reasonable given that real steam turbines experience mechanical losses, internal leakages, blade fouling, and other off-design behaviors that may not be fully captured in the simulation. Still, the modeled efficiency remains close enough to the plant value to reliably reflect turbine performance under varying flue-gas heat-input conditions. The slightly lower modeled efficiency is consistent with conservative simulation behavior, where idealizations or generalized property methods may smooth out localized performance effects. For power output, the plant turbine produces 28.20 MW compared to the model’s 26.52 MW. This difference of 1.68 MW (approximately 6%) again represents a realistic and acceptable deviation. The under-prediction aligns with the corresponding difference in polytropic efficiency: lower modeled efficiency naturally yields lower power output. The model nevertheless captures the correct order of magnitude and dynamic behavior of the turbine, making it suitable for energy-integration studies, parametric analyses, and what-if scenarios involving steam-generation variations or regenerator temperature changes. The adiabatic fluid head values 1122 m in the plant versus 1104 m in the model show excellent agreement, differing by only 18 m (about 1.6%). This is a strong indication that the thermodynamic expansion process, enthalpy drop, and steam-path energy conversion are being accurately represented. The model correctly reflects the turbine’s ability to convert high-pressure, high-enthalpy steam into mechanical work across the expansion range typical of the FCC-derived steam cycle.
3.2. Material and Energy Balance Results of Major Equipment
Material balance for waste to energy plant using flue gas from fluid catalytic cracking regenerator which consist of one flash separator, two expanders (gas turbine and steam turbine respectively), three heat exchanger network (Economizer, Evaporator and Super Heater) and one heater (steam heat exchanger). The results of the material and energy balance are presented in the following tables.
3.2.1. Material and Energy Balance Results of Flash Separator Equipment
The material and energy balance results of flash separator from fluid catalytic cracking regenerator is shown in
Table 4.
Table 4. Flue Gas Flash Separator From Regenerator.
Streams | FG-REG | Clean Gas | Vent |
Temperature (oC) | 700 | 700 | 700 |
Pressure (Kpa) | 250 | 250 | 250 |
Volumetric Flow (m3/h) | 364.7 | 364.7 | 0.0000 |
Mass Flow (kg/h) | 3 x 10⁵ | 3 x 10⁵ | 0.0000 |
Molar Flow (kgmole/h) | 1.011 x 10⁴ | 1.011 x 10⁴ | 0.0000 |
Heat Flow (kJ/h) | -5.446 x 10⁸ | -5.446 x 10⁸ | 0.0000 |
Mole Fraction | | | |
N2 | 0.7300 | 0.7300 | 0.7300 |
CO2 | 0.1400 | 0.1400 | 0.1400 |
CO | 0.0400 | 0.0400 | 0.0400 |
O2 | 0.0200 | 0.0200 | 0.0200 |
H2O | 0.0690 | 0.0690 | 0.0690 |
SO2 | 0.0010 | 0.0010 | 0.0010 |
The material and energy balance results presented in
Table 4 provide a clear indication that the flash separator installed downstream of the fluid catalytic cracking (FCC) regenerator does not effect any phase or compositional change under the given operating conditions. The feed stream (FG-REG) enters the flash unit at a high temperature of 700°C and a pressure of 250 kPa, and both the clean gas and vent streams display identical thermodynamic and flow characteristics. This outcome suggests that, based on the specified temperature and pressure, no condensation, phase separation, or partial removal of components occurred within the separator. All major flow parameters, including volumetric flow rate, mass flow rate, molar flow rate, and heat duty, remain unchanged between the inlet stream and the clean gas outlet, while the vent stream registers a zero value across all quantities. Such behavior implies that the separator essentially acts as a pass-through unit under the current conditions, offering no driving force for separation due to the extremely high operating temperature, which keeps all species in the gas phase. The constancy of the heat flow across the inlet and outlet streams further supports the conclusion that no phase transition or significant enthalpy change took place. The heat flow value of approximately −5.446 × 10^8 kJ/h for both the feed and clean gas indicates that the stream retains its thermal energy without absorption or release within the separator. Since flash separation relies on temperature reduction or pressure variation to promote vapor-liquid equilibrium shifts, operating at 700°C and 250 kPa ensures all hydrocarbons and inorganic species remain fully vaporized. Consequently, the flash drum does not remove moisture, SO
2, or heavy species, and no vent or liquid stream is generated.
3.2.2. Material and Energy Balance Results of Expander 1 (Gas Turbine) Equipment
The material and energy balance results of Expander 1 (Gas Turbine) from fluid catalytic cracking regenerator is shown in
Table 5.
Table 5. Material and Energy Balance of EXP-FG Expander (Gas Turbine).
Streams | FG-REG | FG-EXP | EXP-Q |
Temperature (oC) | 700 | 585.3 | 0.000 |
Pressure (Kpa) | 250 | 120 | 0.000 |
Volumetric Flow (m3/h) | 364.7 | 364.7 | 0.0000 |
Mass Flow (kg/h) | 3 x 10⁵ | 3 x 10⁵ | 0.0000 |
Molar Flow (kgmole/h) | 1.011 x 10⁴ | 1.011 x 10⁴ | 0.0000 |
Heat Flow (kJ/h) | -5.446 x 10⁸ | -5.860 x 10⁸ | 4.141 x 10⁷ |
Mole Fraction | | | |
N2 | 0.7300 | 0.7300 | 0.0000 |
CO2 | 0.1400 | 0.1400 | 0.0000 |
CO | 0.0400 | 0.0400 | 0.0000 |
O2 | 0.0200 | 0.0200 | 0.0000 |
H2O | 0.0690 | 0.0690 | 0.0000 |
SO2 | 0.0010 | 0.0010 | 0.0000 |
The material and energy balance results for the EXP-FG expander (gas turbine) in
Table 5 highlight how the hot flue gas from the FCC regenerator undergoes a significant thermodynamic transformation as it passes through the expansion device. Unlike the flash separator, the expander performs useful work by converting part of the thermal and pressure energy of the high-temperature regenerator flue gas into mechanical power. This is reflected in the clear changes observed in temperature, pressure, and heat flow between the inlet stream FG-REG and the outlet stream FG-EXP. The flue gas enters the expander at 700°C and 250 kPa, conditions typical of FCC regenerator exhaust, where combustion of coke deposits generates extremely hot and pressurized gases. As the gas expands through the turbine, its pressure drops substantially to 120 kPa, and the temperature decreases to 585.3°C. This reduction represents the conversion of internal energy into shaft work, which in a real gas turbine can be used to drive compressors, generators, or other equipment in the waste-to-energy integration. Despite the temperature drop of over 100°C, the gas remains entirely in the vapor phase, and no change occurs in its mass flow rate, molar flow rate, or volumetric flow rate. This stability indicates that the expander does not remove or split the stream into phases; instead, it solely extracts mechanical energy from the flowing fluid.
3.2.3. Material and Energy Balance Results of Heat Exchanger (Economizer) Equipment
The material and energy balance results of Heat Exchanger (Economizer) from fluid catalytic cracking regenerator is shown in
Table 6.
Table 6. Material and Energy Balance of Heat Exchanger 1 (Economizer).
Streams | FG-EXP | FG-OUT | FW-HP | BFW-HOT |
Temperature (oC) | 585.3 | 519.2 | 105 | 230 |
Pressure (Kpa) | 120 | 120 | 4000 | 4000 |
Volumetric Flow (m3/h) | 364.7 | 364.7 | 40.08 | 40.08 |
Mass Flow (kg/h) | 3 x 10⁵ | 3 x 10⁵ | 4 x 10⁴ | 4 x 10⁴ |
Molar Flow (kgmole/h) | 1.011 x 10⁴ | 1.011 x 10⁴ | 2220 | 2220 |
Heat Flow (kJ/h) | -5.860 x 10⁸ | -6.095 x 10⁸ | -5.860 x 10⁸ | -5.980 x 10⁸ |
Mole Fraction | | | | |
N2 | 0.7300 | 0.7300 | 0.0000 | 0.0000 |
CO2 | 0.1400 | 0.1400 | 0.0000 | 0.0000 |
CO | 0.0400 | 0.0400 | 0.0000 | 0.0000 |
O2 | 0.0200 | 0.0200 | 0.0200 | 0.0000 |
H2O | 0.0690 | 0.0690 | 1.0000 | 1.0000 |
SO2 | 0.0010 | 0.0010 | 0.0000 | 0.0000 |
Table 6 describes the material and energy balance around Heat Exchanger 1, which functions as the economizer in the waste-to-energy integration of the FCC regenerator flue gas. In this unit, the hot expanded flue gas stream (FG-EXP) from the gas turbine is used as the heating medium to preheat high-pressure boiler feedwater (FW-HP) before it proceeds as hot boiler feedwater (BFW-HOT) to the steam generation section. The hot gas enters the economizer at a temperature of 585.3°C and leaves at a reduced temperature of 519.2°C, while its pressure remains essentially constant at 120 kPa, indicating negligible pressure drop across the exchanger. On the cold side, the feedwater enters at 105°C and is heated significantly to 230°C at a much higher pressure of 4000 kPa, typical of high-pressure boiler service. The volumetric, mass, and molar flow rates for both the flue gas (364.7 m
3/h and 3 × 10
5 kg/h) and the water/steam side (40.08 m
3/h and 4 × 10
4 kg/h) remain constant between inlet and outlet, confirming that there is no phase splitting or mass loss; the economizer is strictly a heat-transfer device where energy is exchanged between two process streams without changing their total mass flow. The heat flow data provide further insight into the energy recovery taking place. For the gas side, the heat flow changes from −5.860 × 10
8 kJ/h at the inlet to −6.095 × 10
8 kJ/h at the outlet, indicating that the flue gas has given up part of its thermal energy as it cools. On the water side, the heat flow becomes more negative from −5.860 × 10
8 kJ/h (FW-HP) to −5.980 × 10
8 kJ/h (BFW-HOT), showing that the feedwater has absorbed heat from the flue gas and its enthalpy has increased. Although the absolute sign convention is negative, the important physical interpretation is that the hot flue gas loses energy and the boiler feedwater gains energy, consistent with the purpose of an economizer. This heat recovery step is a key feature of energy integration: instead of discharging very hot flue gas directly to the atmosphere, part of its sensible heat is captured and reused to preheat boiler feedwater, thereby reducing the fuel or additional energy required in the main steam generator or boiler. This improves the overall thermal efficiency of the plant and aligns with waste-to-energy and heat-recovery steam generator (HRSG) principles. The compositional data also support the functional role of the economizer. The flue gas composition remains unchanged between FG-EXP and FG-OUT, with nitrogen at 73 percent, carbon dioxide at 14 percent, carbon monoxide at 4 percent, oxygen at 2 percent, water vapor at 6.9 percent, and sulfur dioxide at 0.1 percent. This invariance confirms that no chemical reaction or separation occurs in the heat exchanger; it is a purely physical heat-transfer operation. On the water side, the hot boiler feedwater (BFW-HOT) is represented as 100 percent H
2O in terms of mole fraction, which is consistent with a nearly pure water stream, even though the tabular layout shows the flue gas-type composition for FW-HP. The key interpretation is that the cold stream is dominated by liquid water entering the economizer and remains water as it is heated to a higher temperature at constant high pressure, potentially approaching saturation or subcooled conditions depending on the detailed design.
3.2.4. Material and Energy Balance Results of Heat Exchanger (Evaporator) Equipment
The material and energy balance results of Heat Exchanger (Evaporator) from fluid catalytic cracking regenerator is shown in
Table 7.
Table 7. Material and Energy Balance of Heat Exchanger 1 (Evaporator).
Streams | FG OUT | FG-VOUT | BFW-HOT | SAT-STEAM |
Temperature (oC) | 519.2 | 507.1 | 230 | 250 |
Pressure (Kpa) | 120 | 120 | 4000 | 4000 |
Volumetric Flow (m3/h) | 364.7 | 364.7 | 40.08 | 40.08 |
Mass Flow (kg/h) | 3 x 10⁵ | 3 x 10⁵ | 4 x 10⁴ | 4 x 10⁴ |
Molar Flow (kgmole/h) | 1.011 x 10⁴ | 1.011 x 10⁴ | 2220 | 2220 |
Heat Flow (kJ/h) | -6.095 x 10⁸ | -6.138 x 10⁸ | -5.980 x 10⁸ | -5.980 x 10⁸ |
Mole Fraction | | | | |
N2 | 0.7300 | 0.7300 | 0.0000 | 0.0000 |
CO2 | 0.1400 | 0.1400 | 0.0000 | 0.0000 |
CO | 0.0400 | 0.0400 | 0.0000 | 0.0000 |
O2 | 0.0200 | 0.0200 | 0.0000 | 0.0000 |
H2O | 0.0690 | 0.0690 | 1.0000 | 0.0000 |
SO2 | 0.0010 | 0.0010 | 0.0000 | 0.0000 |
Table 7 presents the material and energy balance around Heat Exchanger 1 operating as the evaporator section of the heat recovery system, where the remaining thermal energy in the flue gas from the FCC regenerator is used to generate saturated steam from hot boiler feedwater. On the hot side, the flue gas stream FG OUT enters the evaporator at 519.2°C and leaves as FG-VOUT at 507.1°C, with the pressure essentially constant at 120 kPa. This modest temperature drop reflects the recovery of a portion of the sensible heat of the flue gas as it continues to cool while still remaining in the gas phase. The constancy of the volumetric flow rate (364.7 m
3/h), mass flow rate (3 × 10
5 kg/h), and molar flow rate (1.011 × 10
4 kgmol/h) between FG OUT and FG-VOUT shows that no condensation, splitting, or loss of material occurs on the gas side; the evaporator is strictly a heat-exchange device for the flue gas, not a separation unit. On the cold side, the stream BFW-HOT at 230°C and 4000 kPa represents high-pressure hot boiler feedwater coming from the economizer. In the evaporator, this water is further heated and undergoes a phase change to produce saturated steam at 250°C at the same pressure, labeled SAT-STEAM. The pressure remains constant at 4000 kPa for both streams, which is characteristic of boiler or HRSG evaporator sections that operate at nearly constant pressure while converting liquid water to steam. The volumetric, mass, and molar flow rates of the water/steam side are unchanged (40.08 m
3/h, 4 × 10
4 kg/h, and 2220 kgmol/h respectively), indicating that there is no blowdown, venting, or additional feed being introduced in this balance; all the boiler feedwater is converted to saturated steam at the same overall flow rate. Even though the table lists identical heat flow values for BFW-HOT and SAT-STEAM, the physical interpretation is that the evaporator supplies the latent heat required to complete the liquid-to-vapor phase transition at essentially constant temperature and pressure, using the energy extracted from the flue gas. The heat flow values on the flue gas side change from −6.095 × 10
8 kJ/h at the inlet to −6.138 × 10
8 kJ/h at the outlet, indicating that additional energy has been transferred from the flue gas to the water/steam side. While the numerical convention in the table is negative, the trend shows that as FG OUT cools to FG-VOUT, it gives up part of its sensible heat content. This energy is used to complete evaporation on the water side, so that the incoming hot liquid water at 230°C is converted to saturated steam at 250°C. In practical terms, the evaporator section of the HRSG is where the majority of the steam-generation duty is carried out, and this table confirms that the flue gas still retains enough high-grade thermal energy after the economizer to drive the phase change required for steam production.
3.2.5. Material and Energy Balance Results of Heat Exchanger (Super Heater) Equipment
The material and energy balance results of Heat Exchanger (Super heater) from fluid catalytic cracking regenerator is shown in
Table 8.
Table 8. Material and Energy Balance of Heat Exchanger (Super Heater).
Streams | FG VOUT | FG-STACK | SAT-STEAM | HP-STEAM |
Temperature (oC) | 507.1 | 251 | 250 | 442.4 |
Pressure (Kpa) | 120 | 120 | 4000 | 4000 |
Volumetric Flow (m3/h) | 364.7 | 364.7 | 40.08 | 40.08 |
Mass Flow (kg/h) | 3 x 10⁵ | 3 x 10⁵ | 4 x 10⁴ | 4 x 10⁴ |
Molar Flow (kgmole/h) | 1.011 x 10⁴ | 1.011 x 10⁴ | 2220 | 2220 |
Heat Flow (kJ/h) | -6.138 x 10⁸ | -7.012 x 10⁸ | -5.980 x 10⁸ | -5.980 x 10⁸ |
Mole Fraction | | | | |
N2 | 0.7300 | 0.7300 | 0.0000 | 0.0000 |
CO2 | 0.1400 | 0.1400 | 0.0000 | 0.0000 |
CO | 0.0400 | 0.0400 | 0.0000 | 0.0000 |
O2 | 0.0200 | 0.0200 | 0.0000 | 0.0000 |
H2O | 0.0690 | 0.0690 | 1.0000 | 1.0000 |
SO2 | 0.0010 | 0.0010 | 0.0000 | 0.0000 |
Table 8 presents the material and energy balance around the superheater section of the heat recovery system, where the remaining high-grade heat in the flue gas is used to raise the temperature of saturated steam to high-pressure superheated steam. On the hot side, the flue gas stream FG VOUT enters the superheater at a very high temperature of 507.1°C and exits as FG-STACK at a much lower temperature of 251°C, while the pressure remains constant at 120 kPa. This large temperature drop shows that the superheater is the final major heat-recovery step, extracting substantial sensible heat from the flue gas before it is discharged to the stack. The fact that the volumetric flow rate, mass flow rate, and molar flow rate of the gas remain unchanged between FG VOUT and FG-STACK (364.7 m
3/h, 3 × 10
5 kg/h, and 1.011 × 10
4 kgmol/h, respectively) indicates that there is no condensation, splitting, or loss of gas in this section. The flue gas simply cools as it transfers heat to the steam, then leaves the system at a much lower temperature suitable for environmental discharge or further treatment. On the steam side, the superheater receives saturated steam (SAT-STEAM) at 250°C and 4000 kPa and heats it to high-pressure superheated steam (HP-STEAM) at 442.4°C at the same pressure. The constant pressure on the steam side is characteristic of superheater operation in boilers and HRSGs, where steam temperature is increased at essentially fixed pressure after evaporation is complete. The volumetric, mass, and molar flow rates for SAT-STEAM and HP-STEAM are the same (40.08 m
3/h, 4 × 10
4 kg/h, and 2220 kgmol/h), confirming that there is no additional feed, venting, or blowdown in this balance; all the saturated steam is converted into superheated steam. This increase in temperature at constant pressure and constant flow rate represents a purely sensible heating process, in contrast to the evaporator section where latent heat effects dominate. The superheated steam produced here can be used to drive the steam turbine (ST-GEN) in the integrated waste-to-energy system, contributing to power generation and improving plant thermal efficiency. The heat flow data further emphasize the role of the superheater. On the flue gas side, the heat flow changes from −6.138 × 10
8 kJ/h for FG VOUT to −7.012 × 10
8 kJ/h for FG-STACK. Although the sign convention is negative, the trend shows that the gas loses additional energy as it cools from 507.1°C to 251°C. This lost energy is transferred to the steam side to raise the steam temperature from saturation conditions to a highly superheated state. On the steam side, the heat flow values listed for SAT-STEAM and HP-STEAM are both −5.980 × 10
8 kJ/h in the table, but the physical interpretation is that the superheater provides the sensible heat required to increase the steam temperature by nearly 200°C at constant pressure. In an actual energy balance, this would correspond to an increase in the specific enthalpy of the steam, driven by the heat extracted from the flue gas. Together with the economizer and evaporator, this section completes the heat recovery sequence, ensuring that as much useful energy as possible is captured from the FCC regenerator flue gas before it exits the system.
3.2.6. Material and Energy Balance Results of ST-GEN Expander (Steam Turbine) Equipment
The material and energy balance results of ST-GEN Expander (Steam Turbine) from fluid catalytic cracking regenerator is shown in
Table 9.
Table 9. Material and Energy Balance of EXP-FG Expander (Steam Turbine).
Streams | HP-STEAM | ST-EXH | Q-TUB |
Temperature (oC) | 442.4 | 46.01 | 0.000 |
Pressure (Kpa) | 4000 | 10 | 0.000 |
Volumetric Flow (m3/h) | 40.08 | 40.08 | 0.0000 |
Mass Flow (kg/h) | 4 x 10⁴ | 4 x 10⁴ | 0.0000 |
Molar Flow (kgmole/h) | 2220 | 2220 | 0.0000 |
Heat Flow (kJ/h) | -5.063 x 10⁸ | -5.400 x 10⁸ | 3.365 x 10⁷ |
Mole Fraction | | | |
N2 | 0.0000 | 0.0000 | 0.0000 |
CO2 | 0.0000 | 0.0000 | 0.0000 |
CO | 0.0000 | 0.0000 | 0.0000 |
O2 | 0.0000 | 0.0000 | 0.0000 |
H2O | 1.0000 | 1.0000 | 0.0000 |
SO2 | 0.0000 | 0.0000 | 0.0000 |
Table 9 presents the material and energy balance for the EXP-FG expander modeled as a steam turbine, where high-pressure superheated steam is expanded to generate mechanical energy before being discharged at low pressure. The inlet stream, HP-STEAM, enters the turbine at a very high temperature of 442.4°C and a pressure of 4000 kPa, representing typical high-pressure, high-temperature steam conditions produced in the superheater of a heat recovery steam generator. As the steam passes through the turbine, it expands and does useful work, exiting as ST-EXH at a much lower temperature of 46.01°C and a significantly reduced pressure of 10 kPa. This large drop in both temperature and pressure is characteristic of energy extraction in steam turbines, where the internal energy of the steam is converted into shaft work that can drive an electrical generator (ST-GEN) or other mechanical equipment in the waste-to-energy plant. Despite these pronounced thermodynamic changes, the volumetric flow rate, mass flow rate (4 × 10
4 kg/h), and molar flow rate (2220 kgmol/h) remain constant between inlet and outlet, indicating that no mass is lost, split, or added in the turbine. The process is therefore a closed, adiabatic flow with respect to mass, consistent with idealized turbine operation. The heat flow values further illustrate the extent of energy conversion in the steam turbine. The inlet heat flow associated with HP-STEAM is −5.063 × 10
8 kJ/h, while the outlet stream ST-EXH has a more negative heat flow of −5.400 × 10
8 kJ/h. The difference between these values is represented by the Q-TUB stream, which is given as 3.365 × 10⁷ kJ/h. This positive quantity corresponds to the mechanical power generated by the turbine as steam expands through it. In other words, the turbine extracts part of the steam’s enthalpy as useful work, and this is reflected as an energy output stream attached to the expander. The increase in the magnitude of the negative heat flow from inlet to outlet signifies that the steam has lost part of its available energy, leaving the turbine at a much lower thermodynamic state. This behavior is central to the Rankine cycle, where high-pressure, high-temperature steam is expanded in a turbine to generate power, and then condensed and pumped back for reuse in the boiler or HRSG.
3.2.7. Material and Energy Balance Results of Heat Exchanger (Steam Heater) Equipment
The material and energy balance results of Heat Exchanger (Steam heater) from fluid catalytic cracking regenerator is shown in
Table 10.
Table 10 describes the material and energy balance around the steam heater or condenser where the exhaust steam from the turbine (ST-EXH) is cooled and condensed using a cold utility stream, in this case cooling water (CW-IN and CW-OUT). The inlet steam exhaust stream, ST-EXH, arrives at 46.01°C and 100 kPa after expansion in the steam turbine. In the condenser, this relatively low-pressure steam is brought into contact (through indirect heat transfer) with cooling water entering at 20°C and leaving at 35°C. The objective of this unit is to remove the remaining thermal energy from the exhaust steam so that it condenses to liquid water, forming the condensate stream labeled COND OUT. The temperature of the condensate is shown as 25.01°C at the same pressure of 100 kPa, indicating that the steam has not only condensed but has been slightly subcooled below its saturation temperature at that pressure. This is typical in condensers where cooling water removes sufficient heat to fully condense the steam and reduce its temperature slightly, improving condensate handling and pump operation. The cooling water, on the other hand, picks up heat and its temperature increases from 20°C to 35°C, showing that it is acting as the heat sink for the rejected low-grade thermal energy from the Rankine cycle. The flow data and heat flow values provide additional insight into how this condenser is operating within the overall system. The steam side maintains a constant mass flow rate of 4 × 10
4 kg/h and molar flow rate of 2220 kgmol/h between ST-EXH and the condensed stream, which aligns with the assumption that no steam is lost and all of it is recovered as liquid water. The cooling water stream has a much smaller flow rate of 5 × 10
3 kg/h, which is typical for a dense liquid utility used to absorb large quantities of heat. The heat flow associated with the steam side changes slightly from −5.4 × 10
8 kJ/h for ST-EXH to −5.403 × 10
8 kJ/h for COND OUT, capturing the removal of latent and sensible heat from the steam as it condenses and cools. On the cooling water side, the heat flow changes from −7.955 × 10⁷ kJ/h for CW-IN to −7.922 × 10⁷ kJ/h for CW-OUT, indicating an increase in the energy content of the water as it warms up. Although the sign convention is negative, the important physical interpretation is that heat is being transferred from the exhaust steam to the cooling water, and this represents the rejected heat of the cycle that cannot be converted to useful work. This step closes the thermal loop of the Rankine cycle by preparing the working fluid (now as condensate) to be pumped back and reheated in the boiler or HRSG.
Table 10. Material and Energy Balance of Heat Exchanger (Steam Heater).
Streams | ST-EXH | COND OUT | CW-IN | CW-OUT |
Temperature (oC) | 46.01 | 25.01 | 20 | 3 5 |
Pressure (Kpa) | 100 | 100 | 90 | 100 |
Volumetric Flow (m3/h) | 40.08 | 364.7 | 5.010 | 5.010 |
Mass Flow (kg/h) | 4 x 10⁴ | 3 x 10⁵ | 5 x 10³ | 5 x 10³ |
Molar Flow (kgmole/h) | 2220 | 1.011 x 10⁴ | 277.5 | 277.5 |
Heat Flow (kJ/h) | -5.4 x 10⁸ | -5.403 x 10⁸ | -7.955 x 10⁷ | -7.922 x 10⁷ |
Mole Fraction | | | | |
N2 | 0.0000 | 0.0000 | 0.0000 | 0.0000 |
CO2 | 0.0000 | 0.0000 | 0.0000 | 0.0000 |
CO | 0.0000 | 0.0000 | 0.0000 | 0.0000 |
O2 | 0.0000 | 0.0000 | 0.0000 | 0.0000 |
H2O | 1.0000 | 1.0000 | 1.0000 | 1.0000 |
SO2 | 0.0000 | 0.0000 | 0.0000 | 0.0000 |
3.3. Sensitivity Analysis
Sensitivity analysis for waste to energy plant using flue gas from fluid catalytic cracking regenerator was performed by investigating the influence of critical operating conditions such as effect of flue gas temperature and mass flow rate from fluid catalytic cracking regenerator on expander (gas turbine) and generator (steam turbine) power output and efficiency. The results obtained are presented in
Figures 1 to 8.
3.3.1. Effect of Flue Gas Temperature on Efficiency of Expander (Gas Turbine)
The data presented in
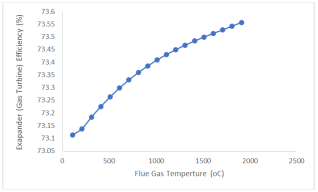
Figure 1, showing Expander Efficiency versus Flue Gas Temperature, reveals a consistent and gradual increase in expander performance as the inlet flue gas temperature rises. Beginning at 110°C with an efficiency of approximately 73.11 percent, the efficiency climbs steadily to about 73.56 percent at 1910°C. Although the numerical change appears modest (an increase of about 0.44 percent across the entire temperature range), the trend is smooth, monotonic, and clearly indicates a positive correlation between flue gas temperature and turbine efficiency. This pattern is characteristic of thermodynamic expansion devices such as gas expanders or turbines, whose efficiency often depends on the available enthalpy drop across the machine. As the inlet flue gas temperature increases, the available energy expressed as higher enthalpy also increases. This means the expander can extract more useful mechanical work per unit mass of gas. Even though the thermal efficiency increment per 100°C is relatively small, the overall effect becomes significant in high-energy systems like fluid catalytic cracking (FCC) regenerator off-gas expanders, where very large gas flowrates are involved. A small fractional increase in efficiency translates directly into higher power output and improved overall energy recovery. The smoothness of the curve also indicates that the expander is operating within a stable mechanical and thermodynamic regime, where increasing the gas temperature does not cause sudden fluctuations, operational instabilities, or efficiency losses. This stability suggests that the turbine's design its blade geometry, flow passages, and thermodynamic matching with the FCC regenerator exhaust supports efficient performance across a wide range of inlet temperatures. In practice, such behavior is desirable because FCC regenerators experience some process variability due to coke burning intensity, air flow fluctuations, and catalyst circulation rates. The expander’s ability to maintain predictable performance across a broad temperature range enhances reliability and ensures consistent energy recovery.
Figure 1. Expander Efficiency Vs Flue Gas Temperature Plot.
3.3.2. Effect of Flue Gas Temperature on Power Output (MW) of Expander (Gas Turbine)
The results presented in
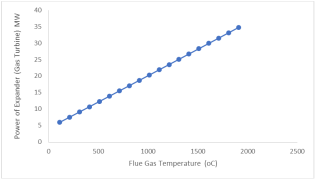
Figure 2, showing Expander Power Output versus Flue Gas Temperature, reveal a strong and nearly linear increase in power generation as the inlet flue gas temperature rises. Starting from approximately 5.96 MW at 110°C, the expander output increases steadily with each temperature increment, reaching about 34.79 MW at 1910°C. This sharp and progressive rise reflects the direct thermodynamic relationship between available energy in the flue gas and the mechanical work recoverable in the expansion process. The most striking observation is the magnitude of the increase. While the efficiency trend in
Figure 1 showed only marginal improvement with temperature, the power output in
Figure 2 rises very rapidly. This is because power generation is driven not only by the efficiency but more importantly by the
absolute amount of thermal energy (enthalpy) available in the hot flue gas. As the temperature increases, the flue gas contains significantly more recoverable energy. The expander converts this energy into mechanical power, so even modest gains in efficiency translate into large power increments when multiplied by the enormous mass flowrate typical of FCC regenerator flue gas streams. The curve shows that for every additional 100°C rise in temperature, the expander gains between 1.5 and 2.0 MW of additional power output, demonstrating a strong sensitivity of power generation to flue gas temperature. This is consistent with thermodynamic expectations: higher inlet temperature increases the enthalpy drop across the turbine, thereby increasing the shaft work produced. The smoothness and monotonic nature of the curve also indicate that the expander operates in a stable and predictable regime across a wide temperature range, from low to very high inlet temperatures, without any sign of performance instability or losses.
Figure 2. Expander Power Output Vs Flue Gas Temperature Plot.
3.3.3. Effect of Flue Gas Mass Flow Rate of Expander (Gas Turbine) Efficiency
The results presented in
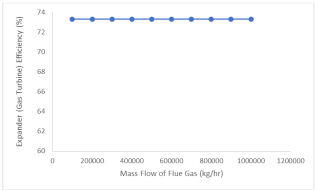
Figure 3, showing Expander Efficiency versus Flue Gas Mass Flow Rate, indicate that the expander’s efficiency remains completely constant at 73.327 percent across the entire range of mass flowrates evaluated, from 100,000 kg/hr to 1,000,000 kg/hr. This flat, horizontal trend demonstrates that within the operating envelope defined by the simulation, the efficiency of the expander is insensitive to changes in mass flowrate and is governed primarily by thermodynamic conditions rather than the quantity of gas flowing through the turbine. The constancy of efficiency suggests that the expander design and operating conditions in this model are such that the turbine operates at or near its optimal efficiency point regardless of how much flue gas passes through, provided the inlet temperature and pressure remain fixed. In practical terms, this implies that the turbine characteristics such as blade geometry, stage loading, expansion ratio, and flow-coefficient matching are modeled to deliver stable aerodynamic performance across a wide flow range. Since the inlet temperature and pressure were held constant for this analysis, the expander experiences the same thermodynamic potential (enthalpy drop) at every mass flowrate. As a result, the efficiency, defined as the ratio of actual work to ideal (isentropic) work, does not vary because the quality of energy conversion remains the same. This behavior aligns with conditions where the expander model is operating within its
design envelope, meaning that the flow regime does not encounter choking, surging, or off-design aerodynamic losses. In real equipment, very high or very low mass flowrates might introduce efficiency penalties such as increased turbulence, higher tip losses, or reduced stage pressure ratios. However, in a controlled simulation such as this, the turbine appears to be well matched across the range, resulting in a flat efficiency curve. From a process-integration perspective, the result has important implications. It means that changes in flue gas mass flowrate due, for example, to variations in coke burn rate, catalyst circulation rate, or regenerator airflow do not significantly affect the expander’s efficiency, provided temperature and pressure remain stable. This stability enhances the reliability of energy recovery in FCC operations, ensuring that even under fluctuating flue gas production rates, the turbine continues to convert energy effectively. The ability to maintain consistent efficiency simplifies operational planning and improves predictability of the power output associated with different plant loads.
Figure 3. Expander Efficiency Vs Flue Gas Mass Flow Rate Plot.
3.3.4. Effect of Flue Gas Mass Flow Rate of Expander (Gas Turbine) Power Output (MW)
The results shown in
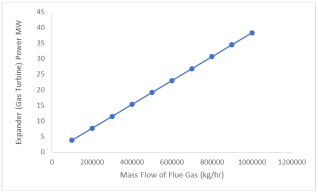
Figure 4, representing Expander Power Output versus Flue Gas Mass Flow Rate, reveal a clear and strongly linear relationship between the amount of flue gas entering the expander and the mechanical power generated. As the mass flowrate increases from 100,000 kg/hr to 1,000,000 kg/hr, the turbine power output rises proportionally from approximately 3.83 MW to 38.34 MW. This linear trend indicates that power generation is directly dependent on the quantity of energy-bearing gas supplied to the expander. The underlying reason for this behavior is rooted in the thermodynamics of expansion. Since the inlet temperature and pressure are held constant in this analysis, every kilogram of flue gas entering the turbine contains the same amount of available thermal energy (enthalpy). Therefore, increasing the mass flowrate simply increases the total energy entering the turbine per unit time. Because the efficiency of the expander remained constant across all mass flowrates (as shown in
Figure 3), the turbine converts a fixed fraction of the available energy into mechanical work. The result is a proportional increase in power output as more gas flows through the expander. This dependable linearity is a desirable operational characteristic, suggesting predictable and controllable energy recovery performance. Another important observation is the magnitude of power generated at high mass flowrates. At the upper end of the range, the expander produces more than 38 MW of mechanical power, which is significant for refinery energy integration. Such high outputs demonstrate that FCC regenerator flue gas is a valuable energy source when properly harnessed with a waste-to-energy expander. Even at moderate flowrates (400,000–600,000 kg/hr), the turbine yields between 15 and 23 MW of power, which can meaningfully reduce the refinery’s dependence on external electricity or fuel-fired equipment. The smooth, monotonic increase also indicates that the expander is well-matched to the operating range and does not encounter off-design penalties such as flow choking, surge, or aerodynamic instability. This suggests that the turbine’s operating envelope is sufficiently broad to handle large variations in flue gas production without compromising performance. In real FCC operations, flue gas flow can fluctuate with catalyst circulation rate, coke burn intensity, air feed variation, and regenerator activity. The fact that power output scales predictably with flowrate means that the expander can be relied upon to provide consistent energy recovery even during transient or fluctuating operating periods.
Figure 4. Expander Power Output (MW) Vs Flue Gas Mass Flow Rate Plot.





 Share This Article
 Twitter
 Linked In
 Facebook

 Copy
 Download