Research Article | | Peer-Reviewed

Flood Vulnerability Assessment Using Geoinformation Data and Multicriteria Evolution Approach in Dakar Urban Environment, Senegal

Received: 14 June 2026     Accepted: 24 June 2026     Published: 6 August 2026
Views:       Downloads:
Abstract

During this last decade, urban flooding has become recurrent in Senegal, particularly in the city of Dakar. The causes are multiple and varied, with devastating impacts on population well-being and the urban environment. For sustainable and harmonious urban development, flood risk mapping should be integrated into urban planning policies. This study aims to map areas vulnerable to flooding at regional, departmental and communal scale, using Remote Sensing, Geography Information System (GIS) and Multicriteria Evolution Approach (MCEA). Twelve criteria layers were defined to identify flood-prone areas, including Rainfall, Elevation, Slope, Groundwater level, Soil type, Impervious surfaces, Land use/cover, Population density, Housing type and structure, Humid zones, Drainage density and Standard of living. A Weighted Linear Combination (WLC) technique was applied and adapted in this study to map flood vulnerability. The criteria were scored and weighted according to their relative importance, as defined by local experts. ArcGIS 10.1 software through its extension Weighted sum overlay tool, was used to aggregate criteria layers into three main indicators: “Socio-economic”, “Physical environment” and “Land use/cover”. The results indicate that approximately 60% of the Dakar urban area is highly vulnerable to flooding according to the "Physical environment" indicator, compared to 12% and 10% for the "Socioeconomic" and "Land use/cover indicators, respectively. Overall, the combination all indicators shows that about 50% of Dakar urban environment is vulnerable to flooding. This vulnerability mainly concerns the departments of Pikine, Guediawaye and Keur Massar, where more than 80% of areas are classified as highly vulnerable. At the municipal and departmental scales, vulnerability indices are higher (greater than 0.7) in these areas compared to the department of Dakar (0.37) and Rufisque (0.14). Validation of final flood vulnerability map was conducted by comparing the most vulnerable areas identified in this study with those severely affected by floods observed using Earth Observation Satellite (SPOT) imagery in September 2005 and 2009. The validation results show an overall accuracy approximately 0.95 and 0.90 for the two respective dates. Understanding the level of vulnerability of the Dakar urban environment, as well as the contribution of each factor, can serve as a decision-support tool for rational and localized management of flood-prone areas in the context of climate change.

Published in American Journal of Environmental Protection (Volume 15, Issue 4)
DOI 10.11648/j.ajep.20261504.12
Page(s) 98-123
Creative Commons

This is an Open Access article, distributed under the terms of the Creative Commons Attribution 4.0 International License (http://creativecommons.org/licenses/by/4.0/), which permits unrestricted use, distribution and reproduction in any medium or format, provided the original work is properly cited.

Copyright

Copyright © The Author(s), 2026. Published by Science Publishing Group

Keywords

Geography Information System (GIS), Remote Sensing, Multicriteria Evolution Approach (MCEA), Weighted Linear Combination (WLC), Flood Vulnerability, Dakar Urban Environment

1. Introduction
Floods are one of the major environmental crises that humanity faces these last decades . They are among the most devastating natural disasters that produce the most damage . Flooding in urban areas become nowadays, a serious problem for populations in African countries, particularly in West part, where entire neighborhoods on the outskirts of cities are almost annually paralyzed by massive flooding, due to uncontrolled urban growth, poor urban planning and inadequate storm water drainage systems, and which is expected to be exacerbated by climate change . This problem of urban flooding, whose Dakar region is subject, pushes the scientific curiosity to think about the possibilities of locating the most vulnerable areas, given the significant heterogeneity of factors which should be highlighted . Indeed, floods have been observed in Dakar since the early 1990s, but their magnitude and intensity are noted from the 2000s. Between 2000 and 2012, significant amounts of rainfall are recorded in Dakar. Thus, flood events with significant impacts are recorded in August 2005, 2009 and 2012. In August and September 2005, nearly 6,500 houses were affected by floods and 200,000 people in the poor and overcrowded suburbs of Dakar had their feet in water . During 2009 floods, 30,000 houses were affected, covering a total area of 11.64 km2, including 10.78 km2 in Pikine and 0.86 km2 in Guédiawaye department . In Pikine, 371 neighborhoods were counted for 28,053 flooded houses and at Guédiawaye 27 neighborhoods for 1,587 houses are flooded. Nearly 360,000 people, or 44% of Pikine population, are affected, against 22,000 people in Guédiawaye, i.e. 7.2% of its population . And 2012 floods caused more damage . According to in 2012, the Action Plan report for flood control (ORSEC), reported 26 flood-related deaths, 264,000 disaster victims and 7737 affected houses. The damage caused by floods in recent decades, in Dakar, has made populations, researchers and public authorities aware of the region's vulnerability to flooding. This vulnerability is jointly manifested by the rapid and unplanned urbanization around spaces declared non aedificandi (Unsuitable for habitation) by all urban planning documents. Determining areas vulnerable to flooding as one element of flood hazard maps related to disaster management for urban development is necessary . Therefore, with increasing effects of floods, spatial knowledge of risk has become a necessity for researchers . This will require identifying, combining and analyzing all the elements to characterize such areas. Remote Sensing, Geographic Information Systems (GIS) and Multicriteria Evolution Approach (MCEA) will serve as global approaches to spatial modeling. This latter allows viewing, analyzing and understanding the spatial device of Dakar region, for the establishment of flood vulnerability map. This helps to identify priority intervention areas. According to vulnerability can be defined as the propensity to damage or dysfunction of different exposed elements constituting a territory and a given society. Vulnerability to flooding is linked to several factors of natural and anthropic orders . The second is accentuated by urban society reflecting the underdevelopment and socio-economic conflicts in a limited space and coveted . The vulnerability of Dakar city to flooding is mainly due to the physical, economic and environmental constraints which reduce the power of adaptation of populations increasingly exposed to flooding . The regions and societies most vulnerable to floods, climate change and their damage, are those whose economic situation is unfavorable and localized in areas at risk. It is the peculiarity of the Niayes area where the groundwater is flush. These areas are practically very vulnerable to flooding . For the spatiotemporal modeling and decision support tools, Geographic Information Systems and Remote Sensing tools offer a potential for characterization and elaboration of indicators helping to improve territorial management policies. Several works devoted to the evaluation of vulnerability to flooding in Dakar urban environment, are based on a qualitative method involving to areas described as specific. This approach is based on the cost evaluation of damages suffered by the affected populations. Given the mass of heterogeneous information to take into consideration , study on spatial multicriteria analysis becomes a necessity. It is through these techniques, to characterize the vulnerability of urban areas and development projects at risk due to the Land use mode . The vulnerability is treated encrypted from various qualitative data. Each vulnerability criterion is standardized and then weighted according to its importance. According to , an evaluation index defines the value of land use in terms of economic and human issues. Several multicriteria analysis methods have been developed throughout these years to identify areas vulnerable to flooding, among others, Analytical Hierarchical Process AHP , Weighted Linear Combination (WLC) or Ordered Weighted Average (OWA) has developed over the past decades. These approaches also apply to the study of the vulnerability of land facing a natural phenomenon . Weighted linear combination is a multi-criteria decision analysis technique that can be used by decision-makers to select an optimal location from a collection of alternative locations . WLC is commonly used for generating suitability maps . In this study we used this approach for selecting areas vulnerable to flooding in Dakar urban environment. Our motivations through this study, may be grouped at three category: i) The most studies on flood vulnerability are not in fact based on the geoinformation data and spatial multi-criteria analysis in order to identified the most vulnerable areas to flooding; ii) There is a little research and no concerned efforts have been made at Dakar region scale in order to provide a consistent and equitable flood vulnerability management framework for all departments, communes, population groups and economic sectors; iii) Flood risk mapping is absent in most urban planning documents and this situation constrains any harmonious and sustainable development process in the region. The awareness of this situation by researchers, which is increasingly translated into the production of decision-making documents on several scales. Thus, this study aims to implement a relevant indicator, an alert system to help policy makers and public opinion in the management step and flood prevention in general and urban flooding in particular.
2. Materials and Methods
2.1. Study Area and Data
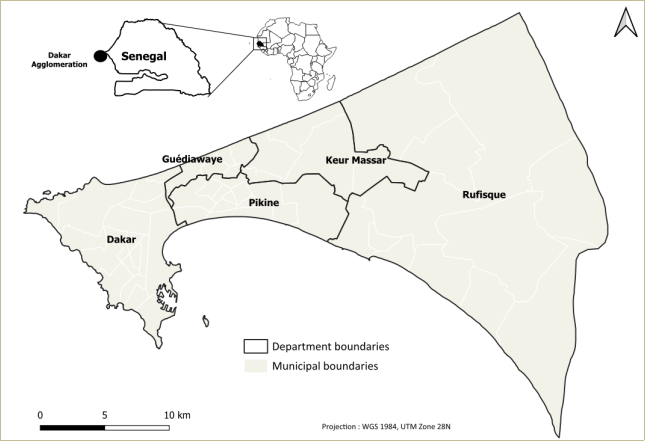
This study was conducted in Dakar region, which is located in the extreme west of Senegal and African continent (Figure 1). It covers an area of 550 km2 representing 0.28% of national territory. Dakar population is estimated at about 4 million inhabitants . Administratively, the region is divided into five departments (Dakar, Guédiawaye, Pikine, Keur Massar and Rufisque) and 54 Communes. Its geomorphology is characterized by a dune relief. Between these dunes, extend the Niayes which are closed depressions with flush water level . The topography is low in Pikine, Guédiawaye and Keur Massar departments. The climate is Sahelian coastal-type with a rainy season from 3 to 4 months and a dry season from 8 to 9 months. Its average annual rainfall is estimated at 400mm. The minimum temperatures are between 12°C and 20°C and maximum between 28°C and 36°C . Geology is consisted of dune sand, clay and organic sandy clays. In this study we used several types of data. Most of them come from previous work. Among these data we have, soil map , groundwater level and standard of living . Others data include population counts by commune , administrative division of Dakar region, Digital Elevation Model (DEM) of Shuttle Radar Topography Mission (SRTM), Tropical Rainfall Measuring Mission (TRMM) with a monthly time step and Landsat Satellite Image (OLI_TIRS 2024).
Figure 1. Location and extent of Dakar region, Senegal, Africa. On this map are also represented the limits of the departments and communes.
2.2. Criteria Identification, Description and Processing Types
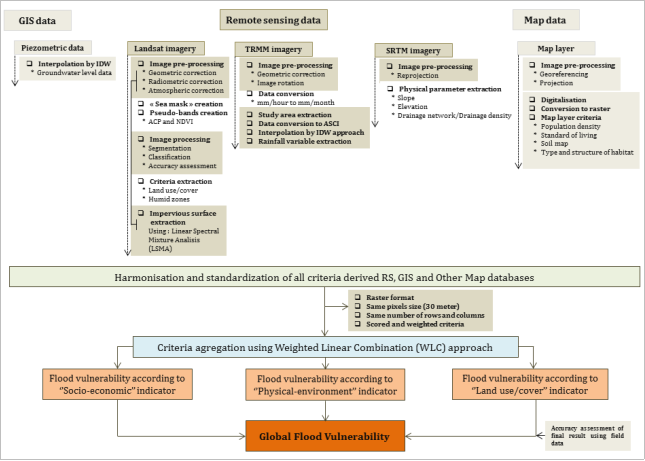
Twelve criteria of vulnerability derived from Remotely Sensed, GIS and others thematic maps data were integrated in this study, namely, Rainfall, Elevation, Slope, Groundwater level, Soil types, Impervious surface, Land use/cover, Population density, Type and structure of habitat, Humid zones, Drainage density and Standard of living. Their characteristics are summarized in Table 1. A flow chart showing the integration of Remote Sensing, GIS and map data represented by raster or layer corresponding to a given theme or class adopted in this study is shown in Figure 2.
Table 1. Characteristics of relevant criteria selected in this study.

Data

Types

Resolution

Format

Sources

1

Rainfall

RS

5km

Raster

2

Elevation

RS

30m

Raster

3

Slope

RS

30m

Raster

4

Groundwater level

GIS

--

Vector

5

Soil types

GIS

--

Vector

6

Impervious surface

RS

30m

Raster

7

Population density

Mapping

--

Raster

8

Land use/cover

RS

30

Raster

9

Type and structure of habitat

Mapping

--

Raster

10

Humid zones

RS

30m

Raster

11

Drainage density

RS

30m

Raster

12

Standard of living

Mapping

--

Raster

Figure 2. Flow chart showing the integration of Remotely-Sensed, GIS, Mapping data, and spatial multi-criteria analysis for mapping areas vulnerable to flooding in Dakar urban environment.
Rainfall
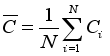
Flooding is indirectly related to the rainfall variability. But its spatial variation, intensity, frequency and duration may be, among other factors, the source of severe floods in Dakar, during the recent years, causing loss of life and damage to the health and property of the population. Rainfall in Dakar not last for more than 4 months, and monthly intakes vary considerably during rainy season. August is the wettest month and consequently floods are mostly recorded during this month (August 2005, 2009 and 2012). The integration of this key factor is therefore makes sense to carry out this study. However, given that the only functional rainfall station in Dakar doesn’t allow a spatialization of rainfall over the whole territory, we used remote sensing data TRMM-3b43 in the monthly time step. In total, 180 images are downloaded, among 2000 and 2024 from the National Aeronautics and Space Administration (NASA) website. These data are initially georeferenced, in addition rainfall in mm/hour are converted to mm/month. This result was used to extract the rainfall from the study area. Then, we calculated the interannual cumulations average using equation (1).
(1)
Where is the average of interannual cumulations; i is the cumulation in a given year and N is the series length.
Elevation
Elevation is derived from DEM which is an ordered array of numbers that represents the spatial distribution of elevations above some arbitrary datums in the landscape . It portrays accurate representation of land surface which was suitable for medium scale mapping . Elevation is an important criterion, given that floods are a water-related problem, mainly rainwater in this context. In principle, water flows from the highest peaks to the lowlands. In Dakar, peri-urban area corresponds to an outlet for run-off and rainfall. The minimum altitude of the area ranges from 2 m to 7 m above sea level. The vulnerability of this space is due to their high density of habitat and population (irregular for most), and its special geographical location. The Shuttle Radar Topography Mission (SRTM) is used to generate the Triangulated Irregular Network (TIN). It is a network of interconnected triangles with irregularly spaced nodes or observation points with x, y coordinates and z values. His advantage is its ability to generate more information in areas of complex relief, and avoiding the problem of gathering a lot of redundant data from areas of simple relief .
Slope
The slope is the ratio of steepness or the degree of inclination of a feature relative to the horizontal plane . It is an important parameter to be taken into account in order to understand the vulnerability of a given areas. Low slopes favor the accumulation of rainwater, and conversely for steep slopes. It is an important parameter to be taken into account in order to understand the vulnerability of a given areas. Low slopes promote the accumulation of rainwater, and conversely for steep slopes. The low slopes are located mainly in the peri-urban zone and a little towards the extreme east of Dakar region. This environment contains many natural or temporal wetlands. Elevation layer was used for generate the slope. More than 25% of low slopes (<5%) are located in the peri-urban area of Dakar, which explains its high vulnerability compared to the rest of Dakar region.
Groundwater level
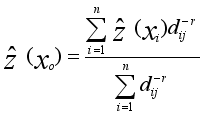
The depth of the groundwater level is also a determining factor in the study of the vulnerability of a given region. According to , it varies between 1.12 and 25.67 m, in Dakar. This variation depends both by the season and the duration of the rain. Low depths are recorded in the east of the region, in the peri-urban area (Thiaroye-Pikine) where the groundwater level is at a nearly level sometime. Accordingly, the number of water subscribers has substantially increased in the peri-urban area from 254 000 to 536 000 between 1997 and 2011 . Combined with the cessation of groundwater pumping and the increase in the discharge of water after use increases the risk of flood . The groundwater level data of are vectorized and interpolated by the Inverse Distance Weighted (IDW) method. This tool uses an interpolation method that evaluates cell values by calculating the average of the sampling point values in the near vicinity of each processing cell. The closer a point is to the center of the cell being under analysis proceeds, more it exercises significant influence on the averaging process. According to , it is weighted moving average.
(2)
Where x0 is the estimation point and xi are the data points within a chosen neighborhood. The weights (r) are related to distance by dij .
Elevation
Knowledge of soil type is essential to carry out the vulnerability studies related to flooding. Indeed, the formation type is indirectly linked to the risks of flooding. Hydromorphic soils have positive effects on flooding . They represent around 50% of the peri-urban area of Dakar. There are moist depressions at the bottom of which ponds and lakes are generally associated with groundwater fluctuations, what makes the originality of this area. The soil layer used in this study resulted from the works of . The layer is vectorised and then converted to raster with an output resolution set at 30m.
Population density
With a considerable demographic weight estimated at about 3 million inhabitants, Dakar is characterized by an unequal distribution of its population over its territory. The most important densities are located in the heart of the periphery of Dakar agglomeration, precisely in the departments of Guédiawaye, Keur Massar and Pikine. This high density, in a small space, increases the vulnerability of these populations to floods. A population density map was used for this study. It will be georeferenced, digitized and rasterized with a resolution of 30m.
Land use / cover
Land use / cover can reveal the vulnerability degree from one class to another. In principle, densely populated areas (houses, roads, infrastructure and equipment, etc.) are considered as the most vulnerable to flooding . In the other hand, the vegetation cover seems the least vulnerable because of its root system which promotes infiltration. To extract Land use / cover criterion, we used a Landsat image of Operational Land Imager (OLI) sensor acquired on December 2024. The OLI image was geometrically registered into a Universal Transverse Mercator (UTM) projection, WGS 1984 and Zone 28 N, with geometric error of less than 0.5 pixels. The nearest neighbor resampling method was used to resample the Landsat image into a pixel size of 30 x 30m during image-to-image registration. After the registration, Operational Land Imager (OLI) image was atmospherically and radiometric ally corrected, using the Dark Object Subtraction (DOS) method, in order to standardizes imagery for the effects caused by solar zenith angle, solar radiance, and atmospheric scattering . Here are the equations used for Landsat image calibration (3 and 4):
(3)
(4)
Where, Lλ is the apparent at-satellite radiance for spectral band λ, DNλ is the digital number of spectral band λ, Rλ is the calibrated reflectance, Lλ.haze is path radiance, Esunλ is exoatmospheric solar irradiance, D is the distance between the Earth and Sun, and θ is the Sun zenith angle. The path radiance for each band is identified based on the analysis of water bodies and shades in the images. The gainλ and biasλ are radiometric gain and bias corresponding to spectral band λ, respectively, and they are often provided in an image head file or metadata file. An enhancement of the histogram of the image was performed to lengthen the intensity levels from 0 to 255 values . A "Mask Sea" has been realized to eliminate the pixels corresponding to the sea in order to facilitate the operation of classification. Neo-channels (Principal Component Analysis (PCA) and Normalized Difference Vegetation Index (NDVI)) were created to limit redundancy in spectral bands and to increase soil-vegetation contrast. Finally, on the first 03 main components, associated with the NDVI image, segmentation, classification and validation were performed. Image classification has allowed identifying five land use/cover classes: build vegetation, crop land, water and bare soil. Classification results were validated by the ground truth data taken from the field campaigns and other map database existing in the study area.
Impervious surface
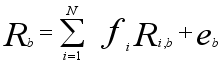
Impervious cover is a material on the land surface through which water cannot infiltrate . Buildings and paved surfaces (e.g., asphalt, concrete) are considered impervious covers . Impervious surfaces are also considered as a determining factor in flood vulnerability study, mainly in urban environment. In Dakar, impervious surfaces due to the densification of the building, the development of the road network and the anarchic backfill are among other factors the sources of Dakar vulnerability to flooding. The impervious surface was generated by remote sensing using Linear Spectral Mixture Analysis (LSMA) model. The linear spectral mixture analysis approach is based on the assumption that the spectrum was a linear combination of the spectral of all components in a pixel; the spectral proportions of the components represented the percentage of the surface features . It was also assumed that there was no interaction between the photons reflected by each component. The linear spectral mixture analysis (LSMA) was adopted in this study for un-mixing pixels. The mathematical model of LSMA could be expressed as:
(5)
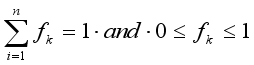
Where Rb is the apparent surface reflectance for each band b in the in the Landsat 8 OLI; Fi is the fraction of endmember i; Ri,b is the reflectance of endmember i in the Landsat 8 OLI band b. N is the number of spectral endmembers and eb is the error in the Landsat 8 OLI band b to fit N endmembers. For a constrained least squares solution, fk is subject to the following restrictions:
(6)
End member selection was a key step in the LSMA approach. Many approaches have been developed for selecting end members such as the measurement spectrum based image based method. In this study, image endmembers were chosen and derived from the OLI image. One approach for choosing image endmembers is selecting representative homogeneous pixels from satellite images through visualizing spectral scatter plots of image band combinations . Maximum Noise Fraction (MNF) was a helpful tool to guide image end member selection by putting almost 90% of the information on the first two or three components and thus minimizes the influence of band-to-band correlation , besides it could reduce the noise of the images. MNF transformation has two steps, firstly, it and reassigned the noise in signals; secondly it executed a principal component transition on white-noise data . The clear delineation of feature spaces corresponding to the first three MNF components suggests that the reflectance spectra of the OLI image might best be represented by a four-endmember linear mixing model. Four endmembers were identified: These end-members are (1) high albedo (e.g. sand), (2) low albedo (e.g. water), (3) vegetation (e.g. grass and trees), and (4) soil. The last step is to extract impermeable surfaces. The high albedo and low albedo endmembers cannot be directly interpreted as impervious surfaces. Moreover, impervious surfaces cannot be an endmember due to their spectral variability. Thus, building a relationship between high and low albedo and impervious surfaces is essential in this study . Most impervious surfaces might be represented by low and high albedo endmembers as follows (7).
(7)
Where Rimp,b was the reflectance spectra of impervious surface of band b, low f and high f were the fraction of low albedo and high albedo, Rlow,b and Rhigh,b were reflectance spectra of low and high albedo for band b. Equation (7) must meet the needs of the follow equation (8):
(8)
Type and structure of habitat
The habitat typology, based on the variables of the last census of the Senegalese population, relate to the characteristics of the housing stock in Dakar region Communes. Data on households and housings in general provide information on the situation of housing in Dakar. The main variables used to characterize the residential areas of the Dakar agglomeration are as follows: (a) the size of the household, (b) the type of housing, (c) the number of persons per room, Habitation - and occupancy status, geographical location . To this first series of variables, added two fairly discriminating variables: the connection of housings to the sewer (serviced neighborhoods) and the nature of the floor of the dwelling (tiled floor). The combination of these elements is relatively important information for targeting Communes vulnerable to flooding. As a criterion, we used the map developed by , describing habitat typology and structure at the commune level. This map is georeferenced, digitized and converted into a raster with a resolution fixed at 30m.
Humid zones
They include water bodies and floodplain areas. These humid zones constitute the areas likely to be flooded under conditions of excessive excess rainfall, causing saturation and overflow of groundwater level. Most of them are located at the periphery Dakar region, mainly in the departments of Pikine and Guédiawaye. Declared by Urban Master Plans (PDUs) as non aedificandi areas, humid zones are irregularly occupied. Indeed, their occupation has a negative impact on the environment, ecosystems and the local economy and puts the populations at risk. Consequently, these are important factors to be taken into account during a phase of locating areas vulnerable to flooding. This factor is extracted in land use/cover map. Indeed, the vulnerability level of humid zones depends on the distances separating them from the builds. In this work, Euclidean distance was calculated on all humid zones in order to clearly delineate the vulnerability level according to the factor of humid zones.
Drainage density
Network drainage density is a measure of the degree of river dissection. It depends on the geology (structure and lithology) of the topographic characteristics of the watershed and, to some extent, on climatic, anthropogenic and vegetation conditions . Drainage density is also considered as a good indicator to characterize vulnerability for a given environment to the phenomenon of flooding. In general, a low drainage density which represents a poor permeable soil, low vegetation and low slope, thus promoting infiltration, in contrast to a high drainage . And hence in Dakar the drainage network is very dense at the east and west ends and less from the region and less in the center. To spatialize the drainage density, we opted for the grid technique, defining 200×200m vector grids. Then we calculated the drainage density, using the equation (9). The result is converted to raster with a resolution of 30m.
(9)
Where ∑Li (meter) is the total length of streams and A is the area (square meter or m2).
Standard of living
This factor allows integration of socio-spatial heterogeneity in Dakar region. Unfortunately, it is reduced to the agglomeration of Dakar. Vulnerability to flooding is also closely linked to the socio-economic attributes of the populations. It results in a lack of financial and material resources of the households in Dakar, which places them in a precarious and unstable situation when they are subject to external threats. As a criterion, we used the map produced by on the standard of living of the population in the Dakar agglomeration. The map is georeferenced, digitized and converted into a raster with a resolution of 30m.
2.3. Assessment of Vulnerability to Floods
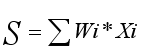
In this study we used WLC technique for identifying areas vulnerable to flooding. This approach can allow decision makers to locate the most areas vulnerable to flooding. In addition, with use of this method, the final output map will range between “very lowly vulnerable” to “very highly vulnerable”. To assess flood vulnerability of Dakar region, all criteria was harmonized into raster data sets with resolution of 30m. This assessment is based on the judgment of eight experts. They were chosen from among the actors of local authorities, researchers in geography, land-use planning and urban planning. Each criterion was reclassified and each class was assigned a score on a scale of 1 to 5 indicating the level of vulnerability according to the experts opinion consulted for this purpose (1 = very lowly vulnerable, 2 = Lowly vulnerable, 3 = moderately vulnerable, 4 = Highly vulnerable and 5 = Very highly vulnerable). Consequently, there are criteria with different numbers of classes. Weights were generally assigned to these maps to express their relative importance. For this, we used the method given by . It consists for each evaluator to assign a weight to the different criteria on a scale of 0 to 1 or 0 to 100. The scores can be an integer or in decimal, according to the score scale used. And the sum of the scores of each evaluator must be equal to 1 or 100. Therefore, to obtain the final weight for each criterion, which will be used in the aggregation step, we have been proceeding in the following manner: the experts' score for each criterion was standardized by comparing the sum of scores attributed to a criterion to the total sum of all criteria. Table 2 shows the method of obtaining the final weights. And weights are calculated, in first, for each indicator in order to determine the importance order of criteria. And secondly, the indicators are weighted in turn before proceeding with the final aggregation. After assigning factor scores and weights, vulnerability assessment was calculated by using the following formula (10). In Figure 3, we describe the hierarchical analysis process of flood vulnerability of the region, as well as the indicators of belonging of each criterion.
(10)
Where, S, is the sum of the product of the individual weight, Wi, and the score, Xi for each factor, i.
Figure 3. Flood vulnerability analysis hierarchy. This figure show that vulnerability is evaluated in a first time according to the three vulnerability indicators (Physical environment, Socioeconomic and Land use/cover) relating to environment urban of Dakar region. And the aggregation of indicator attributes gives global vulnerability at Dakar scale.
Table 2. The method for obtaining the weights, affiliated to each criterion according to the experts judgment . A1,. N represents an expert taken individually on a number n. Then, Δ1,. n is the judgment of the expert on each criterion selected in this study. W1,. n (Δ1,. n: A1,. n) is the score assigned to a criterion by a given expert. Finally, Wi is the relative weight of each criterion resulting from the standardization of the judgment of all experts.

A1

A2

A3

An

Wi

∆1

W1(∆1: A1)

W1(∆1: A2)

W1(∆1: A3)

W1(∆1: An)

∑W1((∆1(A1,…An)))/N

∆2

W2(∆2: A1)

W2(∆2: A2)

W2(∆2: A3)

W2(∆2: An)

∑W2((∆2(A1,…An)))/N

∆3

W1(∆3: A1)

W3(∆3: A2)

W3(∆3: A3)

W3(∆3: An)

∑W3((∆3(A1,…An)))/N

∆n

Wn(∆n: A1)

Wn(∆n: A2)

Wn(∆n: A3)

Wn(∆n: An)

∑Wn((∆n(A1,…An)))/N

N

∑W1,…n(A1)

∑W1,…n(A2)

∑W1,…n(A3)

∑W1,…n(An)

∑Wi=1

3. Results
3.1. Results Related to “Socioeconomic” Indicator
In this study, socioeconomic indicator of vulnerability refers to the population density, structure and type of habitat and standard of living factors that affect the resilience of communities. Table 3 shows the characteristics of each criterion and the scores and weights assigned to them.
Table 3. Characteristics of the criteria related to the "Socioeconomic" indicator, as do their respective scores.

Factors or Criteria

Subclasses

Scores

Weight

Population density

200 - 5000 ht./km2

1

0.35

5000 - 15000 ht./km2

2

15000 - 30000 ht./km2

3

30000 - 50000 ht./km2

4

Above 50000 ht./km2

5

Structure and type of Habitat

Pericentre center and very well equipped

1

0.41

Pericentre well equipped

2

Suburbs near and far well-equipped means

3

outer suburbs poorly equipped

4

Suburban underequipped

5

Standard of living

Easy category

1

0.24

Middle class category

2

Middle category

3

Poor category

4

Very poor category

5

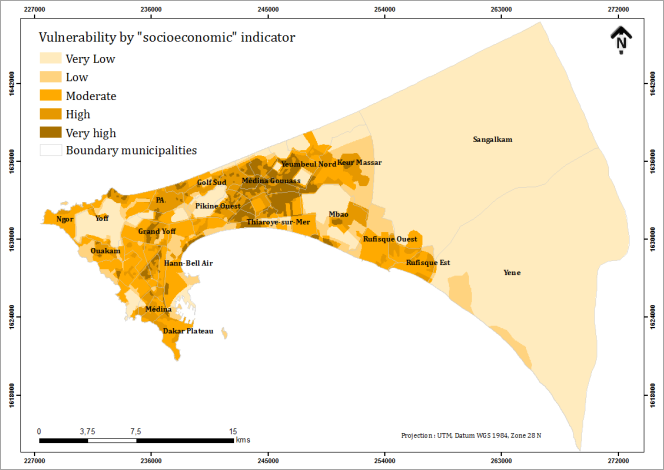
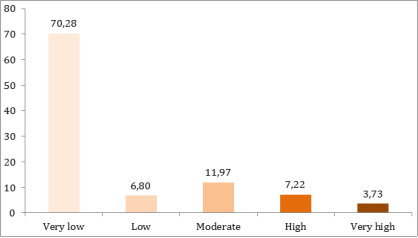
Figures 4 and 5 show the results of the aggregation for all vulnerability criteria of socioeconomic indicator. The analysis of these figures mainly shows a low vulnerability of Dakar urban environment, estimated at 70.28% (154058.76 Ha). This is followed by areas of moderate vulnerability covering approximately 11.97% (26248.77 Ha). In addition, areas with highly and very highly vulnerable represent respectively 7.22% (15816.78 Ha) and 3.73% (8185.59 Ha). The latter are located in the peripheries of Dakar region, corresponding to the tree departments, Pikine, Guédiawaye and Keur Massar and to a lesser extent in the department of Dakar. The high vulnerability of Dakar periphery may be linked to their low socio-economic situation and their high density of population and housing. The department of Dakar is the most populated department of the region, with 1,278,469 inhabitants, representing approximately 31.9% of the regional population. It is followed by the departments of Rufisque, with 818,337 inhabitants (20.4%), Keur Massar, with 770,314 inhabitants (19.2%), and Pikine, with 764,597 inhabitants (19.1%). The department of Guédiawaye remains the least populated department of the region, with 372,708 inhabitants, representing about 9.3% of the regional population . These areas are also characterized by a very low socio-economic indicator. And resident populations adapt poorly to repetitive floods and generally to climate change.
Figure 4. Vulnerability map according to the "Socioeconomic" indicator.
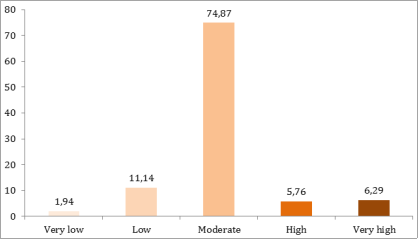
Figure 5. Proportion of vulnerability level according to the socioeconomic indicator.
3.2. Physical Environment Indicator
The attributes of “Physical environment” indicator used for flood vulnerability analysis include rainfall, groundwater level, elevation, slope, soil type, imperious surface and drainage density. Their characteristics are summarizing in Table 4.
Table 4. Characteristics of the criteria related to the "Physical environment" indicator, as do their respective scores and weights.

Factors or Criteria

Sub classes

Scores

Weight

Rainfall

Below 350 mm/an

2

0.11

400 - 350 mm/an

3

Above 400 mm/an

4

Elevation

Above 40%

1

0.18

30 - 40%

2

20 - 30%

3

10 - 20%

4

0 - 10%

5

Ground Water level

Above 20 m

1

0.14

15 - 20 m

2

10 - 15 m

3

5 - 10 m

4

Below 5

5

Soil type

Tropical ferruginous soils

1

0.12

Halomorphic soils

3

Hydromorphic soils

5

Slope

Above 30

2

0.17

20 - 30

3

10 - 20

4

0 - 10

5

Impervious surface

Below 40%

3

0.15

40 - 70%

4

Above 70%

5

Drainage density

Above 0.0321 m/m2

2

0.13

0.0363 - 0.0321 m/m2

3

0.0425 - 0.0363 m/m2

4

Above 0.0425 m/m2

5

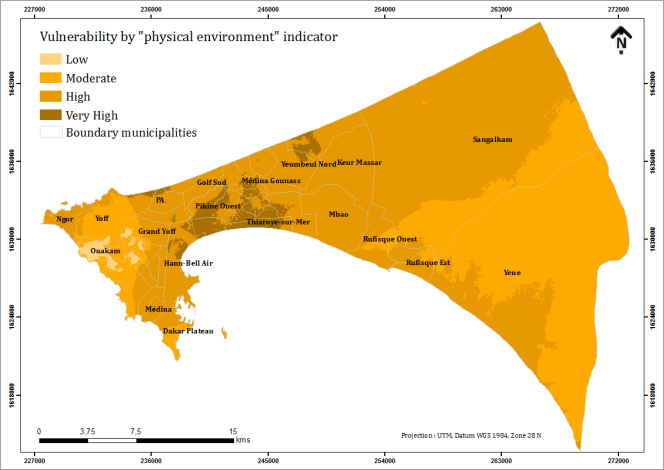
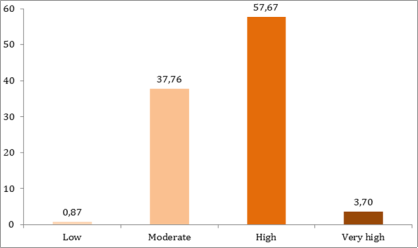
Figures 6 and 7 show the role of physical factors in determining, characterizing and locating areas vulnerable to flooding. This result is the combination of all criteria relating to "physical environment" indicator. The analysis reveals that low-vulnerability areas are smaller with only 0.87% (1896.75 Ha). These areas concern the communes of Ouakam and Mermoz-Sacré-Cœur. The areas moderately vulnerable to flooding are estimated at about 37.76% (82,622.07 Ha). And areas highly and very highly vulnerable to flooding cover respectively 57.67% (12,6202.86 Ha) and 3.70% (8106.3 Ha). The areas vulnerable to flooding are located in the department of Pikine and to a lesser extent, in the department of Dakar. It should be noted that the Dakar region contains many low-land, occupied in a rapid and unplanned way. From the topographical point of view, the altitude varies from 0 to 7 m in the periphery and more than 100 m in the volcanic mountains of Ouakam and the plateaus of Thiés. It should also be underlined that the pedological context of the area reveals very adequate formations for the supply of groundwater, especially in the area of the Niayes with the presence of the dune formations. In low-lands, the vulnerability is very important, as it constitutes, in addition to the topographic, geological and hydrogeological context, the point of convergence or the outlet for rainwater.
Figure 6. Vulnerability map according to the "Physical environment.
Figure 7. Proportion of vulnerability level according to the "Physical environment".
3.3. Land Use/Cover Indicator
Two criteria have been chosen for this indicator, namely humid zones and land use/cover. Table 5 shows the characteristics of these criteria. According to the experts' judgment, the criterion "Humid zones" is more important, with a weight of 0.63 on 1, against 0.37 for land use/cover, to explain the vulnerability linked to the "Land use/cover" indicator.
Table 5. Characteristics of the criteria related to the "Land use/cover" indicator, as do their respective scores and weights.

Factors

Subclasses

Scores

Weight

Humid zones

Below 400 m

1

0.63

300 - 400 m

2

200 - 300 m

3

100 - 200 m

4

0 - 100 m

5

Land use/cover

Water bodies

1

0.37

Vegetation urban

2

Crop land

3

Bare soil

4

Build areas

5

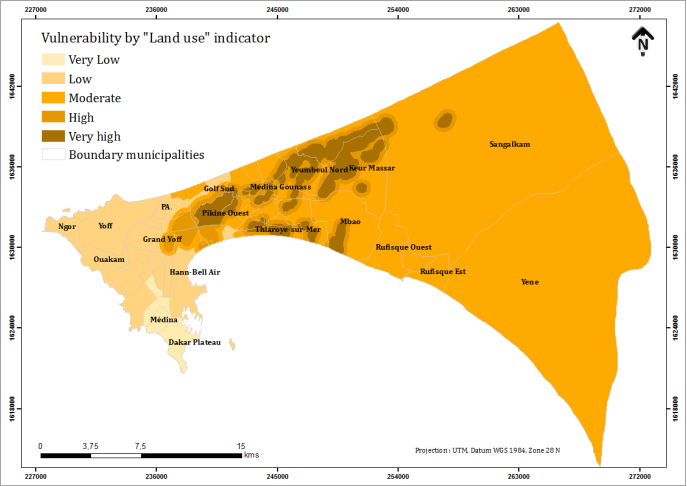
Figure 8. Vulnerability map according to the indicator "Land use/cover”.
Figure 9. Vulnerability level according to the indicator "Land use/cover".
Figures 8 and 9 show the results from the combination of humid zones and land use/cover. Analysis of these figures shows that 74.87% (164,085.3 Ha) of the Dakar region are moderately vulnerable, 11.14% (24,417.09 Ha) are lowly vulnerable and only 1.94% (4254.03 Ha) are very lowly vulnerable. These areas correspond to the communes of Dakar Plateau, Medina and Gueule Tapée-Fass-Colobane. Moreover 5.76% (12,632.4 Ha) of Dakar urban environment region are highly vulnerable and only 6.29% (13,785.39 Ha) are very highly vulnerable. It should be noted that these areas of heightened vulnerability, are always located in the departments of Pikine, Guédiawaye and Keur Massar. The vulnerability of this area is linked to the presence of water bodies and flood areas, but also to a strong presence of irregular occupations of urban space. According to , the rate of irregularity of the housing in the department of Pikine is estimated at 40%.
3.4. Global Vulnerability of Dakar Region
In order to produce the final flood vulnerability map, experts have also weighted the indicators in turn, in order to classify them according to their relative importance. The judgments provided by the experts were standardized on a scale of 0 to 1, which enabled their relative weight to be obtained, presented in Table 6. These weights will be multiplied to their respective attribute before being added together, using the weighted sum overlay tool.
Table 6. Weights assigned to indicators of flood vulnerability.

Indicators

Weight

Socioeconomic

0,34

Physical environment

0,41

Land use/cover

0,25

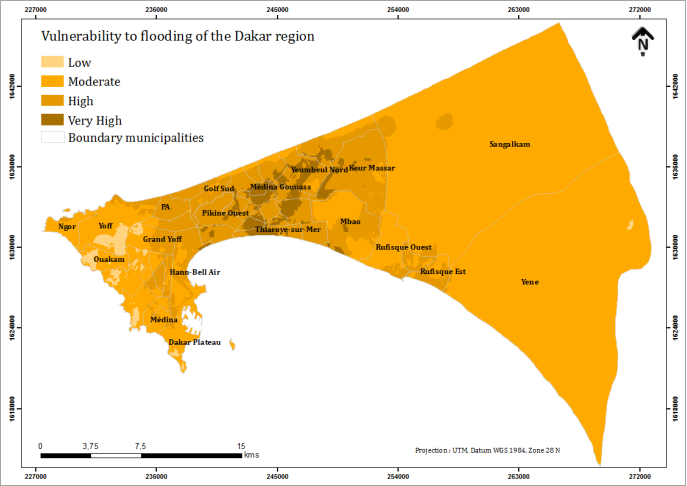
Figures 10 and 11 show the final results of areas vulnerable to flooding in Dakar urban environment. Their analysis shows that 77.47% (169,496.37 Ha) of Dakar are moderately vulnerable and are mainly located in the departments of Dakar and Rufisque. On the other hand, the areas which are highly and very highly vulnerable cover respectively 18.18% (39,776.58 Ha) and 3.03% (6628.86 Ha). They correspond to the departments of Pikine, Guédiawaye and Keur Massar. Overall, all indicators of vulnerability, have shown the potential flood risk of these departments. At the same time, we also calculated the vulnerability index. Reading the results of this index points out that the physical environment indicator explains mostly the vulnerability of Dakar region with an index value of 0.61. In other words, factors related to physical parameters (topography, hydrogeology, drainage density, impervious surface, etc.) play an essential role in the delimitation of areas vulnerable to flooding. On the other hand, the socioeconomic index and the land use/cover are relatively low, with respectively 0.12 and 0.11. Figure 13 assesses the proportion of vulnerability at the departmental scale. The analysis of the figure also shows that Pikine and Guédiawaye are the most vulnerable. The vulnerability index at the departmental scale confirms this observation, with vulnerability index higher than 0.70 in the departments of Pikine, Guédiawaye and Keur Massar, against 0.37 for Dakar and 0.14 for Rufisque (Figure 14). We present in Table 7 the results of vulnerability at the communal scale. It shows that the communes located in the departments of Pikine, Guédiawaye and Keur Massar are the most vulnerable. The most vulnerable communes are Medina Gounasse (Guédiawaye) with 95.08%, Guinaw Rail Sud (Pikine) with 82.97%, Djidah-Thiaroye Kaw (Guédiawaye) with 70.44%, Guinaw Rail Nord with 61.32% (Pikine), Tivaouane Diack Sao (Pikine) with 46.90% and Yeumbeul Sud (Keur Massar) with 44.66%. The Communes with high vulnerability concern Parcelles Assainies, Pikine Ouest, Tharoye Gare, Biscuiterie, Dalifort Forail, Pikine Est, Cambérène, Golf Sud and Sam Notaire. Each of these localities has a vulnerability rate of about 80%. The results for the vulnerability index at the communal scale confirm the vulnerability of these municipalities with an index value between 0.90 and 1. In definitive, the results linked to indicators and indexs (regional, departmental as communal scale), corroborate and place the departments of Pikine, Guédiawaye and Keur Massar as the most vulnerable in Dakar urban environment.
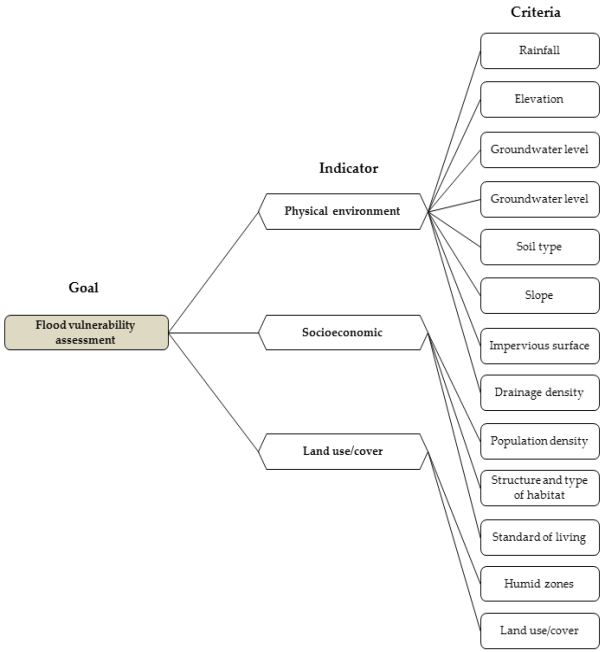
Figure 10. Final map of flood vulnerability.
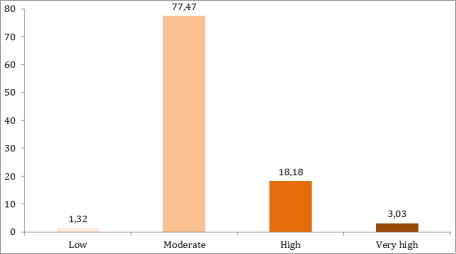
Figure 11. Global vulnerability at regional scale.
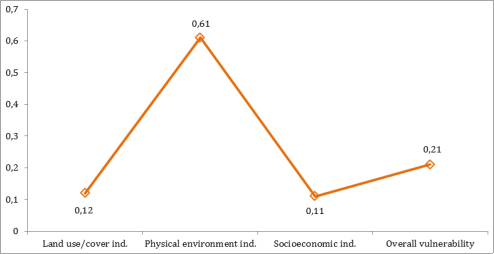
Figure 12. VUlnerability Index at regional scale.
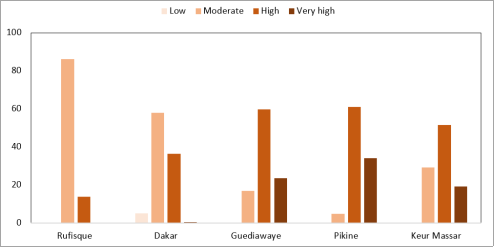
Figure 13. Vulnerability at departmental scale.
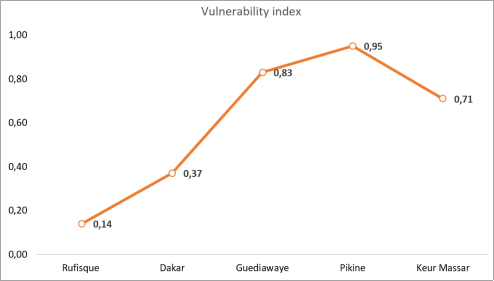
Figure 14. Vulnerability index at departmental scale.
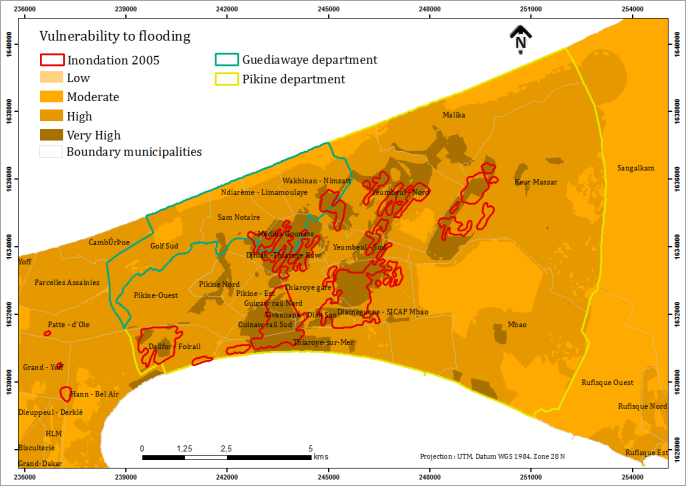
Table 7. Vulnerability level at municipalities scale.

Name of departments

Name of communes

Low

Moderate

High

Very high

Total

Vul. index

Rufisque

Yene

0,13

99,76

0,11

0

100

0,00

Sangalkam

0

97,82

2,18

0

100

0,02

Rufisque Nord

0

33,93

66,07

0

100

0,66

Rufisque Est

0

42,56

57,44

0

100

0,57

Rufisque Ouest

0

85,58

14,42

0

100

0,14

Tivaouane-Peulh/Niaga

0

90,25

9,75

0

100

0,10

Bambilor

0

100

0

0

100

0,00

Sebikhotane

0

100

0

0

100

0,00

Diamniadio

0

100

0

0

100

0,00

Bargny

0

98,22

1,78

0

100

0,02

Sendou

0

100

0

0

100

0,00

Dakar

Camberène

0

0

100

0

100

1,00

Parcelles Assainies

0

0,17

99,83

0

100

1,00

Yoff

19,73

66,41

13,86

0

100

0,14

Ngor Ile

0

100

0

0

100

0,00

Ngor

0

92,68

7,32

0

100

0,07

Patte - d'Oie

0

21,78

78,22

0

100

0,78

Grand - Yoff

9,37

45,55

45,09

0

100

0,45

Dalifor - Foirail

0

1,25

86,96

11,79

100

0,99

Hann - Bel Air

0

46,92

51,56

1,52

100

0,53

Ouakam

24,64

75,36

0

0

100

0,00

Mermoz - Sacré -Coeur

20,41

79,59

0

0

100

0,00

HLM

0

34,36

65,64

0

100

0,66

Biscuiterie

0

5,9

94,1

0

100

0,94

Grand-Dakar

0

44,5

55,5

0

100

0,56

Fann - Point E - Amitié

13,81

81,53

4,66

0

100

0,05

Gueule tapée - Fass - Colobane

0

84,16

15,84

0

100

0,16

Médina

0

85,21

14,79

0

100

0,15

Dakar - Plateau

6,94

88,59

4,47

0

100

0,04

Gorée

3,77

96,23

0

0

100

0,00

SICAP - Liberté

7,98

90,96

1,06

0

100

0,01

Dieuppeul - Derklé

0

76,5

23,5

0

100

0,24

Guediawaye

Wakhinan - Nimzatt

0

21,62

64,15

14,23

100

0,78

Ndiaréme - Limamoulaye

0

28,74

71,21

0,05

100

0,71

Sam Notaire

0

13,38

78,18

8,44

100

0,87

Golf Sud

0

20,32

79,68

0

100

0,80

Médina Gounass

0

0

4,92

95,08

100

1,00

Pikine

Djidah -Thiaroye Kaw

0

0

29,56

70,44

100

1,00

Mbao

0

51,62

45,41

2,97

100

0,48

Pikine-Ouest

0

0,03

95,09

4,88

100

1,00

Pikine Nord

0

0

76,21

23,79

100

1,00

Diameguene - SICAP Mbao

0

0,22

74,48

25,3

100

1,00

Thiaroye gare

0

0

93,61

6,39

100

1,00

Pikine - Est

0

0

83,98

16,02

100

1,00

Guinaw rail Nord

0

0

38,68

61,32

100

1,00

Tivaouane - Diak Sao

0

0

53,1

46,9

100

1,00

Guinaw rail Sud

0

0

17,03

82,97

100

1,00

Thiaroye-sur-Mer

0

1,52

63,12

35,36

100

0,98

Keur Massar

Malika

0

25,31

63,94

10,76

100

0,75

Keur Massar

0

6,24

84,48

9,28

100

0,94

Yeumbeul - Nord

0

14,28

53,82

31,89

100

0,86

Yeumbeul - Sud

0

0

55,34

44,66

100

1,00

Jaxaay-P. A-Niacoul RAB

0

100

0

0

100

0,00

3.5. Accuracy Assessment of Global Flood Vulnerability Map
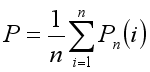
In order assess global precision of the final map of areas vulnerable to flooding we used two Earth Observation Satellite (SPOT) sensor images acquired both in September 2005 and 2009. These images were taken during the flood periods and allow to see some areas under waters. Based on a visual interpretation, these flooded areas were extracted and integrated into a geographic information systems (GIS). They are assimilated as areas highly vulnerable to floods (Figures 15 and 16). The impacts of flooding in these areas are manifold, including the destruction and conversion of some houses by rainwater (Figures 17 and 18). Indeed, this data is used to validate the final map. The principle of validation is to compare areas vulnerable to flooding identified on the Earth Observation Satellite (SPOT) images with those identified in this study. The principle of validation is to compare this information and thus verify the geographical concordance. To facilitate this analysis, information was binarized, 0 designating others forms of vulnerability (Very low, Low and Moderate) and 1 vulnerable (High, Very high). Using the Create Random Points data management tool we randomly generated 100 points on the reference data which are the vulnerable areas in 2005 and 2009, thus coded 1 and 50 points on the areas considered here as other forms of vulnerability, coded 0. The Extract Values to Points spatial analysis tool is used to extract the values on the binary data for each year. We used the SPSS statistical processing software to process the extracted information on the images in order to produce a performance matrix and to calculate the global precision of the spatial vulnerability correspondences in 2005 and 2009. The overall precision is calculated based on equation (11). The results presented in Tables 8 and 9 show an excellent accuracy between the results produced in this study and the reference data, i.e. 0.95 in 2005 and 0.90 in 2009.
(11)
P = Average pixels correctly classified; Pn(i) = the number of pixels of class i effectively assigned to it after comparison.
Table 8. Performance matrix for vulnerability to flooding in Dakar region. The reference data for 2005 are used to validate the result of the vulnerability map obtained in this study.

Reference data in 2005

Vulnerable

No vulnerable

Total Row

Ind. Accuracy

Global accuracy

Model

Vulnerable

92

3

95

0,97

0,95

No vulnerable

8

97

105

0,92

Total Col.

100

100

200

Table 9. Performance matrix for vulnerability to flooding in Dakar region. The reference data for 2009 are used to validate the result of the vulnerability map obtained in this study.

Reference data in 2009

Vulnerable

No vulnerable

Total Row

Ind. accuracy

Global accuracy

Model

Vulnerable

89

9

98

0,91

0,90

No vulnerable

11

91

102

0,89

Total Col.

100

100

200

It emerges from this study that the departments of Pikine, Guédiawaye and Keur Massar are indeed the most vulnerable areas of Dakar. A challenge has therefore been launched to the authorities for the fight against the floods in these priority areas.
Figure 15. Correspondence map between vulnerable areas and flooded areas in 2005.
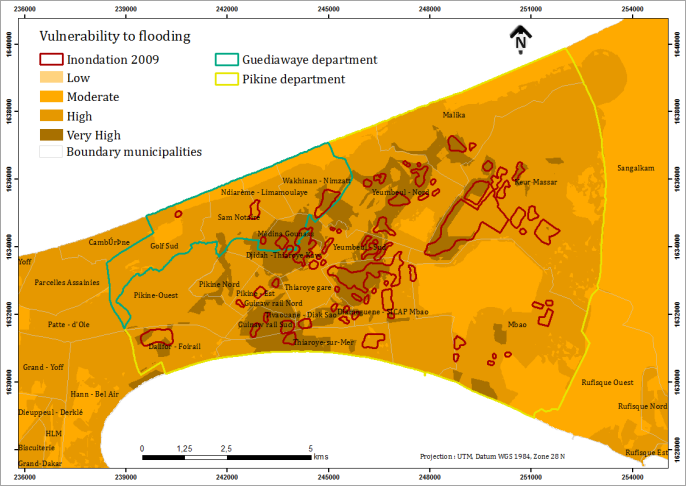
Figure 16. Correspondence map between vulnerable areas and flooded areas in 2009.
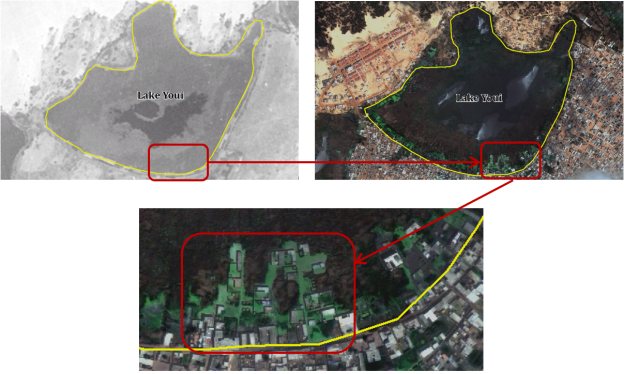
Figure 17. Overview of buildings erected within the limits of Lake Youi, today under the waters. The image on the left is taken from an aerial photo taken on April 4, 1942 by USGS and the one on the right is from a Pleiades source acquired in 2014.
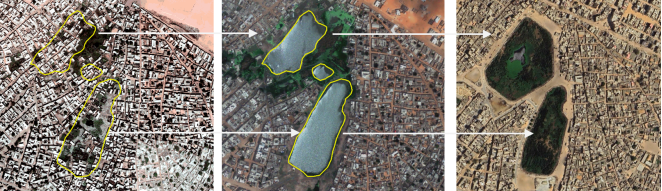
Figure 18. Overview of buildings in 2003 (left image), converted to water bodies in 2014 (middle image) and converted into stormwater retention basins actually in 2026 (right image). The source of these images is QuickBird 2003, Pleiades 2014 and Airbus 2026.

4. Discussion
In Senegal, Dakar is one of the most region or city who is particularly vulnerable to flood, due to, its physical environment complexity and the heterogeneity of its socio-economic component. Several studies have been devoted to the study of vulnerability at local scales. And most of them rely on field surveys, to give an idea of the most vulnerable areas or to measure the impact of flood damage. However, a sectorial management of the latter cannot lead to a rational and sustainable solution. According to , the best way to achieve this, would be to consider a process of vulnerability assessment on a large scale and not on a sectorial basis. This assessing of areas vulnerable to flooding disasters is one of the parameters in creating a flood-risk map for disaster mitigation and urban planning. Flood risk is the combination of the probability of a flood event and of the potential adverse consequences for human health, the environment, cultural heritage and economic activity associated with a flood event . Key component of flood risk assessments is commonly divided into flood-risk assessment, flood-risk mitigation and the accurate estimation of the potential impact on human activities . Indeed, according to , risk assessments involve by definition to consider their vulnerability. Nevertheless, vulnerability is related to the capacity to reduce the impact of disaster and mitigation plan. It describes the potential area to be damaged by natural disasters . In the region of Dakar, the solutions proposed by authorities haven’t produced the expected results, whereas billions are invested each year in this sector. In this study, areas vulnerable to flooding in Dakar urban environment is address according approaches integrated Remote Sensing, geographic information systems (GIS), maps data and spatial multi-criteria analysis through the Weighted Linear Combination (WLC) approach. The environmental attributes used for assessment areas vulnerable to flooding include Rainfall, Elevation, Slope, Groundwater level, Soil types, Impervious surfaces, Population density, Land use/cover Type and structure of habitat, Humid zones, Drainage density and Standard of living. The criteria were grouped into three indicators of vulnerability, "socioeconomic", "physical environment" and "land use / cover", to determine the influence of each indicator on areas vulnerable to flooding. These indicators will be aggregated at the end to know the overall vulnerability. The quantitative relationship between flood vulnerability and factors affecting flood are established by the data driven WLC approach. Criteria was scored and weighted by experts. Each criterion is scored according a scale of five classes (1 represents the least important factor and 5 is the most important). The weights assigned to the criteria come from the opinion of local experts. For "Socioeconomic" indicator, structure and type of habitat is the parameter that has the highest weight (0.41), followed by population density (0.35) and Standard of living (0.24). Afterwards, concerning "physical environment", Elevation have the highest weight (0.18), followed by slope (0.17), impervious surface (0.15), groundwater level (0.14), drainage density (0.13), soils map (0.12) and rainfall (0.11). According "land use/cover" indicator, humid zones factor is the parameter that has the highest weight (0.63), followed by build density (0.37). Finally, in order to assess global vulnerability, weights are assigned to different indicators to determine their relative importance before the final aggregation. "Physical environment" indicator has the highest weight (0.41), followed by "Socioeconomic" indicator (0.34) and "Land use" indicator (0.25). The weights were multiplied by 100 to make an integer. Indeed, by applying and integrating the criteria weights using ArcGIS software, a continuous scale of numerical indices (vulnerability index) is obtained with which the study area is divided into four or five classes of flood vulnerability. The assessment results indicate that about 60% of Dakar region is vulnerable to floods according "Physical environment" indicator, against, 12% and 10% respectively for "Socioeconomic" and "Land use/cover indicators. Indeed, the relation between all indicators shows that about 50% of region is vulnerable. This mainly concerns Pikine, Guédiawaye and Keur Massar departments with more than 70% of vulnerable areas. Also, vulnerability index at municipal and departmental scale, are higher (greater than 0.8) than those calculated in Dakar (0.37) and Rufisque (0.14) departments. The validation results for final flood vulnerability map, based on 2005 and 2009 flooding geographic information systems (GIS) data, show an overall accuracy of 0.95 and 0.90 respectively between these dates. However, the realization of this study is not without difficulties. Overall, as in any multicriteria modeling study, it remains mainly faced with problems related to the availability, quality and updating of data. This work could have been compared with other research carried out on a regional scale. Indeed, on the basis of this scale of study, the chosen problem, the approach used, and the validation protocol implemented, it can be said that such a study, of this scale is a first in Senegal, Dakar in particular. The choice of spatial multicriteria analysis is explained by the fact that it is best suited to respond to a multicriteria problem. According to , 80% of the decision-making problems facing us face a spatial connotation. Therefore, environmental management is a promising sector for multicriteria methods. For future studies, it is recommended to integrate more vulnerability criteria and consider vulnerability scenarios over the next 50 years.
5. Conclusions
This study aims to assess areas vulnerable to flooding in Dakar region using remote sensing, geographic information systems (GIS) and map data and multi-criteria analysis technics through the Weighted Linear Combination (WLC). In this study twelve criteria of vulnerability, namely rainfall, elevation, elope, groundwater level, soil types, impervious surfaces, population density, land use/cover type and structure of habitat, humid zones, drainage density and standard of living, were considered. These parameters were grouped into three indicators of vulnerability: “socioeconomic”, “physical environment” and “land use”. For each vulnerability indicators groups, the criteria are scored and weighted, as well as the indicators among themselves. These information values obtained will be combined together to produce the output map representing the spatial distribution of the areas vulnerable to flood. Further, the map was reclassified based on the vulnerability index values into 4 or 5 categories showing different flood vulnerability classes. The results obtained allowed to do a hierarchy of vulnerability across the region. The departments of Pikine, Guédiawaye and Keur Massar stand out as the most vulnerable areas according the three indicators. The final map resulting from the aggregation of the three indicators, confirms these results. The vulnerability index calculated at the departmental scale show that the department of Pikine is most vulnerable with a vulnerability index of 0.95. It is followed by the department of Guédiawaye with 0.83 and Keur Massar with 0.71. On the other hand, departments of Dakar and Rufisque have a low index respectively 0.37 and 0.14. At the communal scale, the departments of Pikine, Guédiawaye, and Keur Massar contain the most vulnerable communes, with vulnerability indices ranging from 0.90 to 1. These include the communes of Djidah Thiaroye Kao and Pikine-Est in the department of Pikine; Médina Gounass, Cambérène, and Sam Notaire in the department of Guédiawaye; and Yeumbeul Sud in the department of Keur Massar. The lowest indexes concern the communes of Dakar and Rufisque departments with indices below 0.4. In order to verify the relevance of the final decision map obtained, its validation is made by comparing a database on floods of 2005 and 2009 and areas with high and very high vulnerability. The global accuracy is 0.95 in 2005 and 0.90 in 2009. This shows a perfect concordance between our results and the reality of the terrain. The results obtained in this study show that determining areas vulnerable to flooding as one element of flood hazard maps related to disaster management for urban development is necessary and relevant. They will serve as decision-making tools to strengthen the capacity of policy makers in the good governance of the territory by anticipating the priority areas targeted by the map.
Abbreviations

AHP

Analytic Hierarchy Process

ACP

Principal Component Analysis

ArcGIS

Geographic Information System Software

CSE

Centre De Suivi Ecologique

DEM

Digital Elevation Model

DN

Digital Number

DOS

Dark Object Subtraction

GIS

Geographic Information System

IDW

Inverse Distance Weighted

ISE

Institute of Environmental Sciences

LSMA

Linear Spectral Mixture Analysis

MCEA

Multicriteria Evaluation Approach

MNF

Maximum Noise Fraction

NASA

National Aeronautics and Space Administration

NDVI

Normalized Difference Vegetation Index

WLC

Weighted Linear Combination

OLI

Operational Land Imager

ORSEC

Civil Security Response Organization

OWA

Ordered Weighted Average

PCA

Principal Component Analysis

PDU

Urban Planning Master Plan

SMA

Spatial Multi Criteria Analysis

SPOT

Earth Observation Satellite

SPSS

Statistical Package for the Social Sciences

SRTM

Shuttle Radar Topography Mission

TIN

Triangulated Irregular Network

TIRS

Thermal Infrared Sensor

TRMM

Tropical Rainfall Measuring Mission

USGS

United States Geological Survey

UTM

Universal Transverse Mercator

WGS84

World Geodetic System 1984

Acknowledgments
We would like to express our sincere gratitude to the Department of Geography of Cheikh Anta Diop University of Dakar and to the Centre Régional Africain des Sciences et Technologies Spatiales en Langue Française (CRASTE-LF) of Mohammed V University of Rabat for their support in the development of this research. We also extend our appreciation to the Centre de Suivi Ecologique (CSE) for providing a significant part of its geographic database, which greatly contributed to the successful completion of this study.
Author Contributions
Mamadou Lamine Ndiaye: Conceptualization, Data curation, Formal Analysis, Investigation, Methodology, Software, Writing – original draft, Writing – review & editing
Vieux Boukhaly Traore: Formal Analysis, Investigation, Methodology, Project administration, Writing – original draft, Writing – review & editing
Hyacinthe Sambou: Project administration, Resources, Software, Writing – review & editing
Amadou Tahirou Diaw: Supervision, Validation, Visualization
Conflicts of Interest
The authors declare no conflicts of interest.
References
[1] Ologunorisa, E. T. An Assessment of Flood Vulnerability Zones in the Niger Delta, Nigeria. International Journal of Environmental Studies 2004. 61, 31-38.
[2] Provitolo, D. Vulnerability to Mediterranean floods in urban areas: a new geographical approach. Anale de Géographie. 2007, 1, 23-40.
[3] Clement, A. R. An Application of Geographic Information System in Mapping Flood Risk Zones in a North Central City in Nigeria. African Journal of Environmental Science and Technology, 2013, 7, 365-371.
[4] Pelling, M. The Vulnerability of Cities: Natural Disasters and Social Resilience, Earthscan Publications, London, England, 2003.
[5] Ouma, Y. O.; Tateishi, R. Urban Flood Vulnerability and Risk Mapping Using Integrated Multi-Parametric AHP and GIS: Methodological Overview and Case Study Assessment. Water 2014, 6, 1515-1545.
[6] Thouret J. C., D'ercole R. Vulnerability to natural hazards in urban environments: effects, factors and social responses, Cah. Sci. Hum. 1996, 32, 407-422.
[7] Leome F., Vinet F., Dir. The vulnerability of societies and territories to natural threats: Geographical analyses, Collection “Géorisques” n° 1; Publication of the Paul Valery University, Montpellier 3, 2006; pp. 1-71.
[8] Jonkman, S. N. Global Perspectives on Loss of Human Life Caused by Floods. Natural Hazards, 2005, 34(2), 151-175.
[9] Ezemonye, M. N. Flooding and Household Preparedness in Benin City, Nigeria. Mediterranean Journal of Social Sciences. 2014. 5, 547-553.
[10] Kane, N. K. Flood management in Dakar region" Master's Thesis in Economics, Faculty of Economic Sciences and Management, Cheikh Anta Diop University, Dakar, Senegal, 2007.
[11] ADEPT. Floods in Dakar and suburbs: A better understanding of the causes for durable solutions. P. 67 2010.
[12] World Bank, and Global Facility for Disaster Reduction and Recovery (GFDRR). Vulnerability, risk reduction, and adaptation to climate change - Senegal. Washington, DC, USA. 2011.
[13] Sané, O. D.; Gaye, A. T.; Diakhaté, M.; Aziadekey, M. Critical Factors of Vulnerability That Enable Medina Gounass (Dakar/Senegal) to Adapt against Seasonal Flood Events. Journal of Geographic Information System, 2016, 8, 457-469.
[14] Ndiaye M. L. Detection of land cover changes and geomatic modeling using a multi-criteria assessment approach for mapping flood-vulnerable areas in the Dakar region. Master's thesis, Specialization: Remote Sensing and GIS, African Regional Centre for Space Science and Technology in French (CRASTE_LF) and Mouhamed 5 University, Rabat, Morocco. P. 139, 2015.
[15] Global Facility for Disaster Reduction and Recovery (GFDRR). Senegal: Urban Floods, Recovery and Reconstruction from 2009 Onwards, Case Study for the Post-Disaster Recovery Framework. Final Report, Senegal. p. 27, 2014. (In French).
[16] Stormwater Management Project (PROGEP). Study of the stormwater drainage master plan for the peri-urban region of Dakar, Municipal Development Agency, p. 72. 2011.
[17] National Agency for Statistics and Demography (ANSD). Economic and social situation in Senegal in 2009. Final report, p. 19, 2010.
[18] Diongue M. Urban periphery and flood risks in Dakar, Senegal: the case of Yeumbeul Nord, ESO, Works and documents, no. 37, June 2014.
[19] Sané, O. D.; Gaye, A. T.; Diakhaté, M.; Aziadekey, M. Social Vulnerability Assessment to Flood in Medina Gounass Dakar. Journal of Geographic Information System, 2015. 7, 415-429.
[20] Rimba, A. B.; Setiawati M. D.; Sambah, A. B.; Miura, F. Physical Flood Vulnerability Mapping Applying Geospatial Techniques in Okazaki City, Aichi Prefecture, Japan. Urban Sci. 2017, 1(7), 1-22.
[21] Mbow, C.; Diop, A.; Diaw, A. T.; Niang, C. I. Urban Sprawl Development and Flooding at Yeumbeul Suburb (Dakar, Senegal)”, African Journal of Environmental Science and Technology. 2008, 2(4), 75-88.
[22] Wade, S.; Faye, S.; Dieng, M., Kaba, M.; Kane, N-R. Remote sensing of urban flood disasters: the case of Dakar region (Senegal), AUF Scientific Animation Days, Alger, Algeria, November 2009.
[23] Diop, A.; Niang, C. I.; Mbow, C.; Diallo, A. D. Study of the vulnerability of Thiaroye-sur-Mer to flooding: Factors and consequences, New Series Links, n° 18 December 2014.
[24] Viviana, P. ; Daniele ,R. Spatial Analysis of Flood Exposure and Vulnerability for Planning More Equal Mitigation Actions, Sustainability. 2023. 15(10), 57-79
[25] Ollierou, R.; Quantinet, B. Vulnerability a notion of the future, Ecole Nationale Supérieure des Mines, Saint-Etienne, p. 55. 2004.
[26] PDU, Urban Planning Master Plan "horizon 2015" p. 243. 2003.
[27] Aguiar, L. A. Impact of recent climate variability on the ecosystems of the Niayes region of Senegal between 1950 and 2004, Ph.D. Thesis in Environmental Sciences, University of Quebec at Montreal, 2009.
[28] Graillot, D.; Londiche, H.; Dechomets, R.; Batton-Hubert, M. Multi-criteria spatial analysis for identification of vulnerability to flooding. Ecole Normale Supérieure des Mines de Saint Etienne, France, 2001; p. 17.
[29] Barroca, B.; Pottier, N.; Lefort, E. Analysis and assessment of flood vulnerability in the downstream barley basin. Seventh Workshop of Théo As of January. 2005.
[30] Saaty, T. L. Decision making with the Analytic Hierarchy Process, Int. J. Services Sciences. 2008. 1(1). 83-98.
[31] Malczewski, J. Weighted Linear Combination Method in GIS: Common and Best Practice Approaches. Transactions in GIS. 2000. 4(1), 5-22.
[32] Jiang, H.; Esatman J. R. Applications of fuzzy measures in multi-criteria evaluation in GIS. Int. J. of Geographical Information Science, 2000. 14(2), 173-184.
[33] Ishaya, S. Mapping flood vulnerable areas in a developing urban center of Nigeria. Journal of Sustainable Development in Africa, 2009, 11(4).180-194.
[34] Carlin, N. Geospatial Mapping Analysis of Flood Hazard Levels in Ajeokuta, Nigeria. Journal of Environmental Sciences. 2011. 4, 28-39.
[35] Taubenbook H.; Wurm, M.; Netzband, M.; Zwenzner, H.; Roth, A.; Rahman A.; Dech, S. Flood Areas-Multi-Sensoral Approaches Using Remotely Sensed Data for Risk Assessment. Natural Hazards and Earth System Sciences, 2011. 11(2), 431-444.
[36] Olajuyigbe E. A. Mapping and Analysis of 2012 Flood Disaster in Edo State Using Geospatial Technic. Journal of Environmental sciences, 2012. 6(2), 32-44.
[37] Nkeki, F-N.; Henje, P-J.; Ojeh, V. N. Geospatial Techniques for the Assessment and Analysis of Flood Risk along the Niger-Benue Basin in Nigeria, Journal of Geographic Information System, 2013, 5(2), 123-135.
[38] Malczewski, J. GIS-Based Land-Use Suitability Analysis: A Critical Overview on Research Gate, The professional network for scientists, 2004, 62(1), 3-65.
[39] Carter, B.; Rinner, C. Locally weighted linear combination in a vector geographic information system. J. Geogr Syst, 2014, 16(3). 343-361.
[40] Diouf, R.; Ndiaye, M. L.; Traore, V. B.; Sambou, H.; Giovani, M.; Lo, Y.; Sambou, B.; Diaw, A. T. Beye, A. C. Multi Criteria Evaluation Approach Based on Remote Sensing and GIS for Identification of Suitable Areas to the Implantation of Retention Basins and Artificial Lakes in Senegal. American Journal of Geographic Information System, 2017, 6, 1-13.
[41] Al-Hanbali, A.; Alsaaideh, B.; Kondoh, A. Using GIS-Based Weighted Linear Combination Analysis and Remote Sensing Techniques to Select Optimum Solid Waste Disposal Sites within Mafraq City, Jordan. Journal of Geographic Information System, 2011. 3(4), 267-278.
[42] Pereira, J. M. C.; Duckstein, L. A. Multiple Criteria Decision Making Approach to GIS-Based Land Suitability Evaluation, International Journal of Geographical Information Systems, 1993, 7(5), 407-424.
[43] National Agency for Statistics and Demography (ANSD). (2025). Situation Économique et Sociale de la région de Dakar 2022-2023. Dakar, Sénégal.
[44] Dasylva, S.; Cosandey, C. Exploitation of the Quaternary sands water table for the supply of drinking water in Dakar: an offer compromised by the inadequate rainfall recharge. Géocarrefour. 2006. 80(4), 349-358.
[45] Diop, C.; Sagna, P. Climate Vulnerability of Neighborhoods in Dakar, Senegal: Examples of Nord-FoireAzur and Hann-Maristes. Strengthening Urban Resilience to Climate Change: From Spatial Diagnosis to Adaptation Measures, Paul Sabatier University Verlaine, Metz. Metz, France, 2011. (In French).
[46] Michel P.; Sall, M. M. Atlas of Senegal, J. A. Edition, Paris, p. 74. 1984.
[47] UNEP / UNESCO / UN-HABITAT / ECA. Surface aquifer and urban pollution in West Africa, Progress report of Senegal, p. 39. 2003.
[48] Borderon M.; Oliveau, S.; Machault, V.; Vignolles, C.; Lacaux, J. P.; Ndonky, A. Qualifying urban spaces in Dakar, Senegal: Preliminary results of the cross-approach between remote sensing and spatialized census data, Cybergeo: European Journal of Geography, 2014, 1-16.
[49] Lombard J. Private stakes in public transport in Abidjan and Dakar. Géocarrefour, 2006, 81(2), 167-174.
[50] ACS. Urban Development Strategy for Grand-Dakar (2025)”, Cities Alliances, UN-HABITAT, Republic of Senegal, p. 74. 2010.
[51] The Tropical Rainfall Measuring Mission (TRMM). NASA Homepage. Available online:
[52] USGS. USGS Home page. Available online:
[53] Charreau, C. I.; Fauck, R. The soils of Senegal. Part Two. ORSTOM Documentary Collection. No. 29248. Reference: B. p. 45.
[54] ANSD. General Population and Housing Census, Housing and Agriculture - (2013), Final National Report. p. 19. 2006.
[55] Lessault D.; Imbert, C. Residential mobility and recent dynamics of urban settlement in Dakar (Senegal), European Journal of Geography. 2013.
[56] Meijerink, A. M. J.; Lieshout, A. M. Comparison of approaches for erosion modeling using flow accumulation with GIS. Hydro GIS 96: Application of Geographic Information Systems in Hydrology and Water Resources Management. Proceedings of the Vienna Conference, IAH S Publ. no. 235, April 1996.
[57] Tachikawa, T.; Kaku, M.; Iwasaki, A.; Gesch, D.; Oimoen, M.; Zhang, Z.; Danielson, J.; Krieger, T.; Curtis, B.; Haase, J.; Abrams, M.; Crippen, R.; Carabajal, C. ASTER Global Digital Elevation Model Version 2 summary of Validation Results, The NASA Land Processes Distributed Active Archive Center and the Joint Japan-US ASTER Science Team, 2011.
[58] Nagarajan, R.; Mukherjee, A.; Roy, A.; Khire, M. V. Temporal remote sensing data and GIS application in landslide hazard zonation of part of Western Ghat, India. International Journal of Remote Sensing, 1998, 19, 573-585.
[59] Vijith, H.; Rejith, P. G.; Madhu, G. Using InfoVal Method and GIS Techniques for the Spatial Modelling of Landslide Susceptibility in the Upper Catchment of River Meenachil in Kerala. J. Indian Soc. Remote Sens. 2009, 37(2), 241-250.
[60] Dakar Regional Council (CRD). What synergies can be achieved in the face of flooding in the Dakar Region?, Research-Action Seminar Report, Dakar, Senegal, 2011; p. 56.
[61] Diop, A.; Ndiaye, M. L.; Sambou, H.; Dacosta, H.; Sambou, B. Integrated a GIS and Multicriteria Evaluation approach for Mapping Flood Vulnerability of Buildings in the Grande Niaye Watershed of Dakar, Senegal. American Journal of Geographic Information System, 2017, 6(2), 41-53.
[62] Burrough, P. A.; McDonnell, R. A. Principles of Geographical Information Systems. OXFORD University Press. 1998.
[63] Mokarram, M.; Hojati, M. Using Ordered Weight Averaging (OWA) for multicriteria soil fertility evaluation by GIS (Case study: Southeast Iran). Solid Earth Discuss. 2016, 17, 1-26.
[64] Anctionaide International. Climate change, urban flooding and the rights of the urban poor in Africa. Key findings from six African cities. p. 8. 2006.
[65] Chander G.; Markham B. L.; Helder D. L. Summary of current radiometric calibration coefficients for Landsat MSS, TM, ETM+, and EO-1 ALI sensors”, Remote Sensing of Environment. 2009, 113(5), 893-903.
[66] Paolini, L.; Grings, F.; Sobrino, J. A.; Jiménez Muñoz, J. C.; Karszenbaum, H. Radiometric correction effects in Landsat multi-date/multi-sensor change detection studies. Int. J. Remote Sens. 2006, 27(4), 685-704.
[67] Caloz R.; Collet, C. Digital Image Processing of Remote Sensing, A Concise Guide to Remote Sensing - Volume 3, Presses de l’Université du Québec, 398 pages. 2001. D1145, ISBN 978-2-7605-1145-3.
[68] Phinn, S.; Stanford, M.; Scarth, P., Murray, A. T.; Shyy, P. T. Monitoring the composition of urban environment based on the vegetation-impervious surface-soil (VIS) model by subpixel analysis techniques. International Journal of Remote Sensing, 2002, 23(20), 4131-4153.
[69] Chester, L.; Arnold, Jr.; James Gibbons C. Impervious Surface Coverage: The Emergence of a Key Environmental Indicator, Journal of the American Planning Association, 1996, 62, 243-258.
[70] Deng, Y.; Fan, F.; Chen, R. Extraction and Analysis of Impervious Surfaces Based on a Spectral Un-Mixing Method Using Pearl River Delta of China Landsat TM/ETM+ Imagery from 1998 to 2008. Sensors, 2012, 12(2), 1846-1862.
[71] Rashed, T., Weeks, J. R., & Gadalla, M. S. Revealing the anatomy of cities through spectral mixture analysis of multispectral satellite imagery: a case study of the greater Cairo region, Egypt. Geocarto International, 2001, 16(4), 5-15.
[72] Green, A. A.; Berman, M.; Switzer, P.; Craig, M. D. A transformation for ordering multispectral data in terms of image quality with implications for noise removal. IEEE Transactions on Geoscience and Remote Sensing, 1988, 26, 65-74.
[73] Wu, C.; Murray, A. T. Estimating impervious surface distribution by spectral mixture analysis. Remote Sensing of Environment, 2003, 84(4), 493-505.
[74] ANSD. Results of the third general census of population and housing 2002, National presentation report, Republic of Senegal, 123 p. 2006.
[75] Kelson, K. I.; Wells, S. G. Geologic influence on fluvial hydrology and bedload transport in small mountainous watershed, northern New Mexico, USA. Earth Surface Processes Landforms, 1989, 14, 671-690.
[76] Reddy, G. P. O.; Maji, A. K.; Gajbhiye, K. S. Drainage morphometry and its influence on landform characteristics in a basaltic terrain, Central India - A Remote Sensing and GIS approach”. Applied Earth Observation and Geoinformation, 2004, 6, 1-16.
[77] European Commission. Directive 2007/60/EC of the European Parliament and of the Council of 23 October 2007 on the assessment and management of flood risks. 2007.
[78] Schanze, J.; Zeman, E.; Marsalek, J. Flood Risk Management: Hazards, Vulnerability and Mitigation Measures; Springer: Berlin, Germany, 2006.
[79] Alfieri, L.; Feyen, L.; Dottori, F.; Bianchi, A. Ensemble flood risk assessment in Europe under high end climate scenarios. Global Environmental Change, 2015, 35, 199-212.
[80] Sambah, A. B.; Miura, F.; Integration of Spatial Analysis for Tsunami Inundation and Impact Assessment. Journal of Geographic Information System, 2014, 6(1), 11-22.
[81] Malczcewski, J. GIS and multicriteria decision analysis. Department of geography, University of Western Ontario. John Wiley & Sons, New York, 363 p. 1999.
Cite This Article
  • APA Style

    Ndiaye, M. L., Traore, V. B., Sambou, H., Diaw, A. T. (2026). Flood Vulnerability Assessment Using Geoinformation Data and Multicriteria Evolution Approach in Dakar Urban Environment, Senegal. American Journal of Environmental Protection, 15(4), 98-123. https://doi.org/10.11648/j.ajep.20261504.12

    Copy | Download

    ACS Style

    Ndiaye, M. L.; Traore, V. B.; Sambou, H.; Diaw, A. T. Flood Vulnerability Assessment Using Geoinformation Data and Multicriteria Evolution Approach in Dakar Urban Environment, Senegal. Am. J. Environ. Prot. 2026, 15(4), 98-123. doi: 10.11648/j.ajep.20261504.12

    Copy | Download

    AMA Style

    Ndiaye ML, Traore VB, Sambou H, Diaw AT. Flood Vulnerability Assessment Using Geoinformation Data and Multicriteria Evolution Approach in Dakar Urban Environment, Senegal. Am J Environ Prot. 2026;15(4):98-123. doi: 10.11648/j.ajep.20261504.12

    Copy | Download

  • @article{10.11648/j.ajep.20261504.12,
      author = {Mamadou Lamine Ndiaye and Vieux Boukhaly Traore and Hyacinthe Sambou and Amadou Tahirou Diaw},
      title = {Flood Vulnerability Assessment Using Geoinformation Data and Multicriteria Evolution Approach in Dakar Urban Environment, Senegal},
      journal = {American Journal of Environmental Protection},
      volume = {15},
      number = {4},
      pages = {98-123},
      doi = {10.11648/j.ajep.20261504.12},
      url = {https://doi.org/10.11648/j.ajep.20261504.12},
      eprint = {https://article.sciencepublishinggroup.com/pdf/10.11648.j.ajep.20261504.12},
      abstract = {During this last decade, urban flooding has become recurrent in Senegal, particularly in the city of Dakar. The causes are multiple and varied, with devastating impacts on population well-being and the urban environment. For sustainable and harmonious urban development, flood risk mapping should be integrated into urban planning policies. This study aims to map areas vulnerable to flooding at regional, departmental and communal scale, using Remote Sensing, Geography Information System (GIS) and Multicriteria Evolution Approach (MCEA). Twelve criteria layers were defined to identify flood-prone areas, including Rainfall, Elevation, Slope, Groundwater level, Soil type, Impervious surfaces, Land use/cover, Population density, Housing type and structure, Humid zones, Drainage density and Standard of living. A Weighted Linear Combination (WLC) technique was applied and adapted in this study to map flood vulnerability. The criteria were scored and weighted according to their relative importance, as defined by local experts. ArcGIS 10.1 software through its extension Weighted sum overlay tool, was used to aggregate criteria layers into three main indicators: “Socio-economic”, “Physical environment” and “Land use/cover”. The results indicate that approximately 60% of the Dakar urban area is highly vulnerable to flooding according to the "Physical environment" indicator, compared to 12% and 10% for the "Socioeconomic" and "Land use/cover indicators, respectively. Overall, the combination all indicators shows that about 50% of Dakar urban environment is vulnerable to flooding. This vulnerability mainly concerns the departments of Pikine, Guediawaye and Keur Massar, where more than 80% of areas are classified as highly vulnerable. At the municipal and departmental scales, vulnerability indices are higher (greater than 0.7) in these areas compared to the department of Dakar (0.37) and Rufisque (0.14). Validation of final flood vulnerability map was conducted by comparing the most vulnerable areas identified in this study with those severely affected by floods observed using Earth Observation Satellite (SPOT) imagery in September 2005 and 2009. The validation results show an overall accuracy approximately 0.95 and 0.90 for the two respective dates. Understanding the level of vulnerability of the Dakar urban environment, as well as the contribution of each factor, can serve as a decision-support tool for rational and localized management of flood-prone areas in the context of climate change.},
     year = {2026}
    }
    

    Copy | Download

  • TY  - JOUR
    T1  - Flood Vulnerability Assessment Using Geoinformation Data and Multicriteria Evolution Approach in Dakar Urban Environment, Senegal
    AU  - Mamadou Lamine Ndiaye
    AU  - Vieux Boukhaly Traore
    AU  - Hyacinthe Sambou
    AU  - Amadou Tahirou Diaw
    Y1  - 2026/08/06
    PY  - 2026
    N1  - https://doi.org/10.11648/j.ajep.20261504.12
    DO  - 10.11648/j.ajep.20261504.12
    T2  - American Journal of Environmental Protection
    JF  - American Journal of Environmental Protection
    JO  - American Journal of Environmental Protection
    SP  - 98
    EP  - 123
    PB  - Science Publishing Group
    SN  - 2328-5699
    UR  - https://doi.org/10.11648/j.ajep.20261504.12
    AB  - During this last decade, urban flooding has become recurrent in Senegal, particularly in the city of Dakar. The causes are multiple and varied, with devastating impacts on population well-being and the urban environment. For sustainable and harmonious urban development, flood risk mapping should be integrated into urban planning policies. This study aims to map areas vulnerable to flooding at regional, departmental and communal scale, using Remote Sensing, Geography Information System (GIS) and Multicriteria Evolution Approach (MCEA). Twelve criteria layers were defined to identify flood-prone areas, including Rainfall, Elevation, Slope, Groundwater level, Soil type, Impervious surfaces, Land use/cover, Population density, Housing type and structure, Humid zones, Drainage density and Standard of living. A Weighted Linear Combination (WLC) technique was applied and adapted in this study to map flood vulnerability. The criteria were scored and weighted according to their relative importance, as defined by local experts. ArcGIS 10.1 software through its extension Weighted sum overlay tool, was used to aggregate criteria layers into three main indicators: “Socio-economic”, “Physical environment” and “Land use/cover”. The results indicate that approximately 60% of the Dakar urban area is highly vulnerable to flooding according to the "Physical environment" indicator, compared to 12% and 10% for the "Socioeconomic" and "Land use/cover indicators, respectively. Overall, the combination all indicators shows that about 50% of Dakar urban environment is vulnerable to flooding. This vulnerability mainly concerns the departments of Pikine, Guediawaye and Keur Massar, where more than 80% of areas are classified as highly vulnerable. At the municipal and departmental scales, vulnerability indices are higher (greater than 0.7) in these areas compared to the department of Dakar (0.37) and Rufisque (0.14). Validation of final flood vulnerability map was conducted by comparing the most vulnerable areas identified in this study with those severely affected by floods observed using Earth Observation Satellite (SPOT) imagery in September 2005 and 2009. The validation results show an overall accuracy approximately 0.95 and 0.90 for the two respective dates. Understanding the level of vulnerability of the Dakar urban environment, as well as the contribution of each factor, can serve as a decision-support tool for rational and localized management of flood-prone areas in the context of climate change.
    VL  - 15
    IS  - 4
    ER  - 

    Copy | Download

Author Information
  • Abstract
  • Keywords
  • Document Sections

    1. 1. Introduction
    2. 2. Materials and Methods
    3. 3. Results
    4. 4. Discussion
    5. 5. Conclusions
    Show Full Outline
  • Abbreviations
  • Acknowledgments
  • Author Contributions
  • Conflicts of Interest
  • References
  • Cite This Article
  • Author Information