Research Article | | Peer-Reviewed

Impact of Airport Elevation on the Operational Performance and Fuel Consumption of Wide – Body Aircraft within a Sustainable Development Framework

Received: 12 June 2026     Accepted: 25 July 2026     Published: 2 September 2026
Views:       Downloads:
Abstract

This paper evaluates the impact of airport elevation on the operational performance of wide – body aircraft within a sustainable aviation framework. A comparative analysis was conducted across three distinct elevations: Singapore Changi Airport, Hartsfield – Jackson Atlanta International Airport, and Denver International Airport. Empirical results indicate that elevated airport altitudes induce reductions in ambient air density, atmospheric pressure, and oxygen molecules in cubic meter of air. Consequently, the diminished air mass flow rate entering the propulsion system attenuates both net engine thrust and instantaneous fuel consumption rate. Conversely, this degradation in in aerodynamic and propulsive efficiency exacts a significant penalty by extending the required takeoff distance. Balancing these high – elevations performance trade – offs is essential for optimizing eco – efficiency. since aircraft operations at high elevation airports lead to land - use expansion for airport infrastructure and concentrate engine emissions in low - lying areas, managing operations in high elevation airports faces significant challenges. therefore, through the results of the comparative study among the three airports, and in order to achieve environmental and economic sustainable development in the aviation sector, this research has assisted decision makers in trade- offs and in evaluating the implications of managing flight operations at high elevation airports.

Published in American Journal of Environmental Science and Engineering (Volume 10, Issue 3)
DOI 10.11648/j.ajese.20261003.14
Page(s) 100-111
Creative Commons

This is an Open Access article, distributed under the terms of the Creative Commons Attribution 4.0 International License (http://creativecommons.org/licenses/by/4.0/), which permits unrestricted use, distribution and reproduction in any medium or format, provided the original work is properly cited.

Copyright

Copyright © The Author(s), 2026. Published by Science Publishing Group

Keywords

Aircraft Performance, Takeoff Distance, Airport Elevation, Oxygen Molecules, Fuel Consumption, True Airspeed

1. Introduction
In the contemporary era of global transport, the aviation sector stands at a critical crossroad, balancing the surging demand for international connectivity with the stringent mandates of environmental sustainability. Wide – body aircraft serve as the backbone of long- haul logistics and passenger transport; however, their operational efficiency is heavily dictated by localized geographic and atmospheric conditions. Among these variables, airport elevation above Mean Sea Level (MSL) represents a permanent geophysical constraint that fundamentally alerts aircraft aerodynamic and propulsion system thermodynamics. As airports globally strive to align with the United Nations Sustainable Development Goals (SDGS), particularly regarding eco – efficiency and carbon mitigation, understanding the exact operational penalties and trade-offs imposed by elevated operating environments has become an imperative area of research.
The physical of high – elevation aviation operations are governed by the International Standard Atmosphere (ISA) profiles. As elevation increases, ambient atmospheric pressure and volumetric air density decline characteristically. This reduction in air density directly implies a lower molecular concentration of oxygen per unit volume, which impairs the thermochemical processes within turbofan combustion chambers. Mechanically, a diminished ambient density reduces the air mass flow rate (mf) entering the engine's core. Because net thrust is directly proportional to mass flow, high – elevation operations induce a severe attenuation in propulsive output. While this phenomenon concurrently lowers the instantaneous fuel consumption rate during the ground run due to reduced aerodynamic drag and adjusted fuel air ratios, it exacts a severe operational penalty: a significant increase in the required Take-Off Distance (TOD). Despite the well-known theoretical principals of these atmospheric effects, comparative empirical data evaluating modern ultra – large wide – body aircraft across geographically diverse hubs remains sparse within the context of holistic sustainable frameworks.
To address this knowledge gap, this paper presents a comprehensive comparative study evaluating the operational performance profiles of wide – body aircraft across three strategic international hubs with distinct elevations: Singapore Changi Airport (near MSL), Hartsfield – Jackson Atlanta International Airport (moderate elevation), and Denver International Airport (high elevation). Utilizing empirical performance data and aerodynamic modelling, this research quantifies the cascade effect of elevation – from density degradation to thrust loss and instantaneous fuel dynamic – and evaluates how these fluctuations influence the required TOD. By integrating these engineering metrics with sustainable development parameters, this study provides critical insights for airline fleet planning, airport infrastructure optimization, and environmental impact assessment, ultimately establishing a predictive baseline for eco – efficient high – elevation operations.
2. Research Problem
Operating wide- body at elevated airports creates a critical operational and environmental paradox. High – elevation environments suffer from diminished air density and volumetric oxygen levels, which severely reduce the engines air mass flow rate and net thrust. While this atmospheric thinning marginally lowers instantaneous fuel consumption rates, it severely extends the required TOD due to the degraded aerodynamic lift. Currently, global aviation lacks an integrated framework to quantify these engineering penalties, leaving airport authorities unable to balance global fuel reductions against localized spatial and ecological sustainability challenges.
3. Methodology
To systematically evaluate the impact of airport elevation on the operational and environmental performance of wide – body aircraft, this study employs a qualitative – deterministic research framework as follows. This methodology integrates principles of atmospheric physics, propulsion thermodynamics, and aircraft flight mechanics into a cohesive comparative structure. The research logic flows from establishing localized geographic baselines to evaluating internal engine physics, and finally analyzing the macro – level trade – offs between aircraft performance and environmental sustainability.
3.1. Site Selection and Boundary Normalization
The empirical foundation of this comparative analysis rests on three strategically selected international hubs that represent a wide spectrum of operational elevations above MSL: Singapore Changi Airport (near MSL), Hartsfield – Jackson Atlanta International Airport (moderate elevation), and Denver International Airport (high elevation). To eliminate external meteorological noise and isolated elevation as the primary independent variable. All atmospheric data were normalized according to ISA framework. The aircraft Model designated for this operational simulation is Airbus A380- 800, equipped with four Rolls -Royce Trent 970 high bypass turbofan engines, evaluated under Maximum TOW constraints to simulate peak stress on aircraft performance.
3.2. Atmospheric and Aerodynamic Characterization
The methodology evaluates the continuous degradation of the fluid medium as altitude increases. Based on hydrostatic and ideal gas behaviors, the ambient air pressure and volumetric air density are treated as decreasing function of height. This reduction in atmospheric density inherently limits the number of oxygen molecules available per unit volume. The study qualitatively tracks how this thinned air disrupts the aerodynamic generation of lift over the wing surfaces and reduces parasitic drag during the initial stages of aircraft ground run.
3.3. Propulsion and Thermodynamic Assessment
The core thermodynamic analysis focuses on how di-minished air density alerts the inlet boundary conditions of the aircraft's propulsion systems. As the aircraft operates at high elevations, the total air mass flow rate captured by engine nacelles decreases. Because net thrust is a direct function of the mass of air accelerated through the engine core and bypass ducts, this fluid scarcity induces a severe reduction in available thrust. Concurrently, the engine control units adjust the fuel injection parameters to maintain optimal stoichiometric air fuel ratios within the combustor. This adjustment, combined with lower aero-dynamic resistance, result in a declining instantaneous fuel consumption rate at higher elevations, creating a unique thermographic paradox that is analyzed in detail.
3.4. Takeoff Performance Integration
Since high – elevation operations suffer from simultaneous loss of engine thrust and wing lift efficiency, the aircraft requires a significant higher ground speed to achieve the necessary lift – off threshold. The methodology tracks how this delayed lift – off velocity translates into an extended required TOD, transforming a thermodynamic deficiency into physical infrastructure challenge.
Furthermore, the research examines the relationship between aircraft performance at high- elevation airports during the takeoff roll and its implications for sustainability, drawing insights from results and study conclusion.
4. Aircraft t Performance and Airport Elevation
4.1. Aircraft Performance
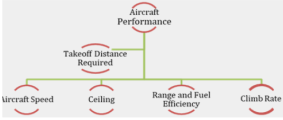
Figure 1. Elements of aircraft performance.
Aircraft Performance (AP) is the ability of aircrafts to accomplish certain useful things, to ensure that the aircrafts can be operated in an efficient and economic manner . Aircraft performance includes: Aircraft speed; Ceiling; Range and fuel efficiency; Takeoff distance required (TOD); and Climb rate, see Figure 1.
4.2. Factors that Affect Aircraft Performance
AP is flounced by a range of factors that impact how an aircraft can takeoff, climb, cruise, descend, and land with safely and efficiently. These factors can be classified into three categories as follow :
4.2.1. Environmental Factors
It includes (Air density; Temperature; Pressure altitude; Wind; and Runway conditions).
4.2.2. Environmental Factors
It included (Takeoff weight; Thrust (power available); Configuration; and Aerodynamic design).
4.2.3. Operational and Flight Conditions
It includes (Center of gravity; Aircraft configuration; Altitude; Fuel load and Payload).
4.3. Aircraft Performance Classes
The following Table 1, summarizing the AP classes as defined by International Civil Aviation Organization (ICAO).
Table 1. Aircraft performance classes

Class A

Class B

Class C

Large, commercial aircraft, and multi engine (turbine or piston).

Small or light aircraft, single engine or small multi- engine, and no guaranteed engine-out performance

Older category, now rarely used, multi engine piston (non- turbine), and limited engine- out performance not required to continue.

Can continue fight or land safely after an engine failure during Take-off.

General aviation, and light aircraft ops.

Some older twin piston aircraft.

For example; Airbus A-380, Boeing 777, and ATR72.

For example; Cessna 172, and Piper PA-34.

Legacy category (seldom used today).

4.4. Elements of Aircraft Performance
4.4.1. Ground Speed (GS)
Is the actual horizontal speed of an aircraft relative to the surface of the earth . GS = True Airspeed (TAS) ± Wind Component, GS = TAS + Tailwind, and GS = TAS – Headwind.
4.4.2. Climb Rate
Is known as rate of climb, refers to the vertical speed at which an aircraft ascends during flight. It’s typically measured in feet per minute (ft/m) or meters per second (m/s) and represents the change in altitude per unit of time .
4.4.3. Service Ceiling
Is the maximum altitude at which an aircraft can maintain a specific rate of climb, typically 100 feet / minute. This is the highest altitude at which the aircraft can operate efficiency and safely .
4.4.4. Takeoff Distance (TOD)
Refers to the total distance an aircraft needs to travel along runway to become airborne, including the ground run and the distance needed to reach a height of 50 feet .
4.4.5. Range and Fuel Efficiency
Refers to the maximum distance an aircraft can travel without refueling. It’s typically measured in nautical mile or kilometers and depends on factors like: (fuel capacity; Fuel efficiency; Aircraft weight; Aerodynamics; and Engine performance).
5. What Is Airport Altitude (elevation)
Airport Elevation (AE) is the elevation of the highest point on the runways of the airport measured in feet from Mean Sea Level (MSL).
5.1. Types of Altitude
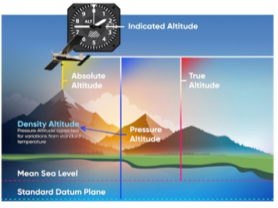
Figure 2. Types of altitude.
5.1.1. True Altitude
It is the height above mean sea level (MSL).
5.1.2. Absolute Altitude
It is the height above the ground level (AGL).
5.1.3. Pressure Altitude
It is the indicated altitude when the altimeter is set to 29.92 in Hg (1013 hPa).
5.1.4. Density Altitude
It is the pressure altitude corrected from standard temperature.
5.2. Altitude Operation
In aviation and aeronautical engineering, altitude operation refers to how an aircraft's performance, engine efficiency, and systems behave as air density changes with height.
6. Airport Elevation and Factors That Affect Aircraft Performance
6.1. Relationship between AE and Air Density
Airports can be classified into three categories according to their elevations as follows:
6.1.1. Low Elevation Airports
Which range in elevation from 0 to 200 m. For example, Singapore Changi Airport.
6.1.2. Medium Elevation Airports
Which range in elevation from 200 to 1000 m. For example, Hartsfield – Jackson Atlanta International Airport.
6.1.3. High Elevation Airports
Which range in elevation more than 1000 m. For example, Denver International Airport.
Using the standard air density at MSL (1.225 Kg/m3) and the Simplified Barometric Formula :
Ƥ(h) = Ƥ (0) * ℮-kh(1)
where Ƥ(h) is the air density at elevation h, Ƥ (0) is the air density at MSL, h is the elevation in meter, and k is a constant = 1.225 * 10 -4. Air densities were obtained for various airports at different elevations (temperature is the same at all airports) and listed in Table 2.
Table 2. Air densities for various airports at different elevations

Example Airport

Airport Elevation (m)

Air Density (Kg/m3)

Percentage Reduction

Singapore Changi Airport

7

1.224

0.082%

Hartsfield – Jackson Atlanta International Airport.

313

1.179

3.755%

Denver International Airport

1655

0.99997

18.37%

6.2. Relationship between AE and Atmospheric Pressure
The relationship between AE and atmospheric pressure is defined by the weight of the air above that location , it is an inverse relationship: as an airport's elevation increases, the atmospheric pressure decreases.
6.2.1. The Air Column Principal
Think of the atmosphere as a tall column of air extending from the ground to the edge of space. At sea level airports: the column of air above the airport is very tall and heavy, generating high pressure. At high elevation airports: the airport is already positioned high up within this column. Therefore, there is less air remaining above it, resulting lower pressure.
6.2.2. The Compressibility and Gravity
Air is compressible fluid, and gravity pulls most air molecules downward toward the Earth's surface. At low elevation airports, molecules are pressed together by the weight of air above them, becoming denser and more pressurized. As you remove higher (at high elevation airport), the gravitational pull on the remaining air is weaker and there is less accumulation, making the air thinner and less pressurized.
6.2.3. General Rule of Thumb
In aviation and meteorology, there is a standard approximation used within the lower atmosphere (the troposphere): Atmosphere pressure drops by 0.1 inHg for every 100 m of elevation gain .
Using the standard approximation, the atmosphere pressure of Singapore Changi Airport, Hartsfield – Jackson Atlanta International Airport, and Denver International airport were calculated and listed in Table 3 below.
Table 3. Atmospheric pressure for various airports at different elevations

Example Airport

Airport Elevation (m)

Atmosphere Pressure (inHg)

Percentage Reduction

Singapore Changi Airport

7

29.896

0.08 %

Hartsfield – Jackson Atlanta International Airport.

313

28.83

3.64 %

Denver International Airport

1655

24.5

18.12.%

6.3. Relationship between AE and Oxygen Molecules per Unit Volume of Air
The percentage of oxygen in the atmosphere remains constant at approximately 21% regardless of altitude. However, because the air is less compressed at lower densities: The gas molecules spread further apart; A liter of air contains fewer total molecules; The same liter contains fewer actual Oxygen Molecules (OM). When air density decreases, the most direct physical consequences is that the number of OM in any given volume of air also decreases . This has profound effects on machine efficiency. At high elevation airports, the weight of the air column above as decreases, leading to a drop in atmospheric pressure. This decrease allows gas molecules to spread further apart (expand). In a unit volume: If we take one liter of air at MSL and one liter at a high elevation airport, the liter at a high elevation airport will contain fewer total air molecules, and consequently fewer OM. From ideal Gas Law:
n = Ρ / K * T(2)
where P = Pressure in Pascale, K = Boltzmann Constant, T = Temperature in Kelvin, n = Total Air Molecules. By applying Ideal Gas Law on Denver International Airport to calculate the number of OM in cubic meter of air its location.
n = Ρ / K * T where P = 24.49 inHg = 82.93 Pascale, K = 1.38 * 10 -23, and T = 15 + 273.15=288.15 K.
n = 82.93/1.38 * 10 -23 *288.15 = 20.84 * 1024 molecules/ m3.
The percentage of oxygen = 21% from the total air molecules.
Therefore, n(oxygen) = .21 * 2.08 * 1025 = 4.37 * 1024 molecules of O2/m3.
By using the Ideal Gas Law, the number of OM in cubic meter of air at Singapore Changi Airport, Hartsfield – Jackson Atlanta International Airport, and Denver International airport, the results were obtained and listed in Table 4 below
Table 4. The number of OM in cubic meter of air at different elevations

Example Airport

Air Density (kg/m3)

Atmosphere Pressure (Pascals)

Number of Oxygen Molecules in m3

Singapore Changi Airport

1.224

101.247

5.33 * 1024

Hartsfield – Jackson Atlanta International Airport.

1.179

97.84

5.15 * 1024

Denver International Airport

0.99997

82.93

4.37 * 1024

6.4. Effect of AE on Engine Thrust
For example, regarding the aircraft Airbus A380 -800, the engine rotational speed N1and N2 varies depending on the engine type. There are two types of engines, Rolls Royce Trent 900 and Engine Alliance GP7200. N1 is the front van speed while N2 is the core engine speed . When an Airbus A380 -800 takeoff from a high elevation airport under Standard Atmospheric Conditions, the N1 speed typically ranges from 2500: 3000 rpm/mi. Aircraft engine thrust is the forward force produced by the engine to propel the aircraft through the air.
F =m * (Ve – Vi),(3)
where F = Engine Thrust, m = Air Mass Flow Rate, Vi = Air Intake Velocity, and Ve = Exhaust Gas Exit Velocity, this equation is called Thrust Equation for Jet Engines.
Air Mass Flow Rate (m)
m = Ƥ *Afan* Vfan(4)
Where Ƥ = Air Density, Afan = Intake Fan Area, Vfan = Air Velocity at Fan.
At MSL under International Standard Atmosphere (ISA) Conditions: Temperature = 15°C, Pressure = 1013.25 hPa, for Engine Rolls – Royce Trent 970. Assume m = 1255 kg/sec, Ƥ = 1.225 kg/m3, Afan = 6.83 m2, so Vfan (during takeoff roll) 1255/1.225*6.83 = 150 m/sec, i.e., assume during takeoff roll, the ambient air with a relative intake velocity of 45 m/sec is accelerated through the inlet to a velocity of approximately 150m/sec at fan face).
To calculate the Air Mass Flow Rate (m) at different elevations , apply the equation m = Ƥ *Afan * Vfan (at Singapore Changi Airport, Hartsfield – Jackson Atlanta International Airport, and Denver International Airport).
m (Singapore Changi Airport) = 1.224 kg/m3* 6.83 m2* 150 m/sec, m = 1253.9 kg/sec.
m (Hartsfield – Jackson Atlanta International Airport) = 1.179 t/m3* 6.83 m2* 150 m/sec. m = 1208 kg/sec.
m (Denver International Airport) =. 99997 kg/m3* 6.83m2* 150 m/sec, m =1024 kg/sec.
The results were obtained and listed in Table 5 below.
Table 5. Percentage reduction in air mass flow rate at different elevations.

Example Airport

Air Mass Flow Rate (kg/sec)

Air Mass Flow Rate Reduction Compared to MSL)

Percentage Reduction

Singapore Changi Airport

1253.9

1.1

0.088%

Hartsfield – Jackson Atlanta International Airport.

1208

47

3.75%

Denver International Airport

1024

82.93

18.41%

Also, to calculate the Thrust (F) for one engine of Airbus 380A -800 there are two types of thrusts : Gross Thrust (Fg) and Net Thrust (Fn). Fg of an aircraft engine represents the total force generated by the acceleration of the working fluid (air and combustion gases) as it exits the exhaust nozzle, before accounting for the momentum drag of the incoming air while Fn refers to the actual, usable forward aerodynamic force transmitted to the aircraft structure to overcome aerodynamic drag and accelerate the air frame. Fg= Fn – Fd, where Fg is the Gross Thrust, Fn is the Net Thrust, and Fd is Ram Drag. While the aircraft is stationary Fd = zero and Fg = Fn, while it begins to increase as takeoff roll increases, causing the engine to expend additional energy to draw in more air and accelerate it into the engine. This force is called Ram Drag Fd = min * Vto. this force deducted from Fg. Fg = Fn at MSL where the aircraft is stopping, Fg -Fn = 311.4 KN. During takeoff roll, at MSL, Airbus A380 – 800, Rolls – Royce Trent 970, and take roll speed = 45 m/sec, calculate Fn as follows:
mi at MSL for Trent 970 = 1255 m/sec.
Vto = 45 m/sec.
Ve = 295 m/sec.
Fd= (mi = Ƥ) * Vto = 1.255 * 45 = 55.125 N /4.44822= 12.39 ibf.
Fg= me * Ve = 1255 *295 = 370225 N / 4.44822= 83.23 ibf ibf.
Fn (at MSL during takeoff roll) = Fg – Fd = 83.23– 12.39= 70.85 ibf
During takeoff roll, at Singapore Changi Airport, Airbus A380 – 800, Rolls – Royce Trent 970, and take roll speed = 45 m/sec, and assume the temperature is constant, calculate Fn as follows:
Air density (Ƥ) = 1.224 kg/m3.
Fd= (mi = Ƥ) * Vto = 1.224 * 45 = 55.08 N /4.44822=12.38 ibf
Fg = me * Ve = 1255 *295 = 370225 N/4.44822 = 83.23 ibf
Fn = 83.23 – 12.38 = 70.85 ibf
During takeoff roll, at Hartsfield – Jackson Atlanta International Airport, Airbus A380 – 800, Rolls – Royce Trent 970, and take roll speed = 45 m/sec, and assume the temperature is constant, calculate Fn as follows:
Air density (Ƥ) = 1.179 kg/m3.
Air Mass Flow Rate (mi) = 1208 kg/sec.
Fd= (Ƥ = mi) * Vto = 1.179 * 45 = 53055 N /4.44822= 11.93 ibf.
Fg= (Ƥ = mi) * Ve = 1.179 *295 = 347805 N/4.44822= 78.19 ibf
Fn= 78.19 – 11.93 = 66.26 ibf
During takeoff roll, at Denver International Airport, Airbus A380 – 800, Rolls – Royce Trent 970, and take roll speed = 45 m/sec, and assume the temperature is constant, calculate Fn as follows:
Air density (Ƥ) = 0.99997 kg/m3.
Air Mass Flow Rate (mi) = 1208 kg/sec.
Fd= (Ƥ = mi) * Vto = 0.99997 * 45 = 45 N /4.44822= 10.12 ibf.
Fg= (Ƥ = mi) * Ve = 0.99997 *295 = 294.94 N/4.44822= 66.13 ibf.
Fn= 66.13 – 10.12 = 56.01 ibf.
The results were obtained and listed in Table 6 below.
Table 6. Percentage reduction in net thrust at different elevations.

Example Airport

Gross Thrust (Fg)

Net Thrust (Fn)

Net Thrust Reduction compared to MSL

Percentage Reduction

Singapore Changi Airport

83.23 Ibf

70.85 Ibf

zero

0.0%

Hartsfield – Jackson Atlanta International Airport.

78.19 Ibf

66.26 Ibf

4.59 Ibf

6.48%

Denver International Airport

66.13 Ibf

56.0 Ibf

14.84 Ibf

20.95%

6.5. Effect of AE on Fuel Consumption and Fuel Efficiency
The direct impact of airport elevation above MSL is highly dependent on the flight phase under consideration, namely takeoff, landing, or cruise. This study specifically focuses on the takeoff phase, or precisely, the takeoff ground roll dynamic. The Fuel Consumption (FC) during takeoff phase is a raw volumetric or mass rate (i.e., the absolute quantity of fuel burned over time, kg/min). the fuel efficiency is a relative metric of transport (i.e., the distance achieved per unit of fuel burned), or fuel burn per seat – mile. At high – elevation airports (such as Denver International Airport), the ambient air pressure is lower, resulting in lower air density. This creates a chain reaction that heavily fuel efficiency during takeoff .
6.5.1. General Rule of Thumb
This has been previously clarified in Section 6.4.
6.5.2. Reduced Aerodynamic Lift (Increased True Airspeed)
Because lift is directly proportional to air density, thinner air generates less lift at given true airspeed (TAS). The fundamental lift equation is expressed as:
L= 0.5 * Ƥ * V2 * S * CL(5)
Where L = lift force in Newton, Ƥ = air density in Kg/m3, V = TAS in m/sec, S = wing surface area in m2, and CL = lift coefficient (dimensionless, depending on angle of attack and flap configuration). To apply the fundamental lift equation to the three airports with different elevations above MSL, namely (Singapore Changi Airport, Hartsfield – Jackson Atlanta International Airport, and Denver International Airport), and given that the required lift force must equal the aircrafts weight, the following assumptions were made:
W = 560000 kg = 5493600 N
S (A380-800) = 845 m2
CL = 1.8
Ƥ (Changi) = 1.224 kg/m3
Calculate TAS, V (Changi) = 76.8 m/sec. 149.3 Knots
Ƥ (Atlanta) = 1.179 kg/m3
Calculate TAS, V (Atlanta) = 77.9 m/sec.
Ƥ (Denver) = 0.99997 kg/m3
Calculate TAS, V (Denver) = 83.1 m/sec.
To determine the instantaneous FC rate for the Airbus A380- 800 at the calculated lift TAS across the three airports, we must bridge the aerodynamics with the engine's thermodynamics. For Airbus A380 – 800, it has four Rolls – Royce Trent 970 engines. At takeoff, these engines operate at maximum thrust, and the fuel mass flow rate (mf) is regulated by the fuel Authority Digital Engine Control (ADEC) based on the equation of Thrust Specific Fuel Consumption (TSFC),
mf= TSFC * F(6)
where mf = Total fuel consumption mass flow rate (kg/sec)
TSFC = Thrust Specific Fuel Consumption (kg/N. sec)
F = Net available thrust at the give elevation (Newton)
Determining available thrust per airport (F)
Jet engine thrust degrades almost linearly with the reduction of ambient air density (Ƥ). Assuming the maximum combined takeoff thrust of the four Trent 970 engines at MSL under Standard Conditions (ISA) is F0 = 1240000 N = 310 KN per engine, the available thrust at takeoff can be calculated using the density ratio:
F = F0* (Ƥ / Ƥ0)(7)
F (Changi) = 1240000 * 1.224/1.225 = 1238987.76 N
F (Atlanta) = 1240000 * 1.179 / 1.225 = 1190521.17 N
F (Denver) = 1240000* 0.99997 /1.225 = 1012214.53 N
Identifying takeoff (TSFC)
Table 7. Reduction in Instantaneous- Fuel Flow Rate.

Example Airport

Airport Elevation (m)

Liftoff Speed (VTAS)

Combined Net Thrust (F) Newton

Instantaneous- Fuel Flow Rate (mf)

Singapore Changi Airport

7

149.3 Knots

1240000

237.6 kg/min

Hartsfield – Jackson Atlanta International Airport.

313

151.4 Knots

1204570

230.8 kg/min

Denver International Airport

1655

161.5 Knots

1059820

203.1 kg/min

During the takeoff roll, at speed between 149 to 162 Knots, a typical maximum takeoff thrust TSFC for Trent 970 engines is approximately:
TSFC = 0.0115 Kg/(N.hr) = 3.194 * 10-6kg/ (N.S)
Calculating instantaneous fuel consumption rate (mf)
mf(Changi) = TSFC * F (Changi) = 237.6 kg/ min
mf(Atlanta) = TSFC * F (Atlanta) = 230.8 kg/min
mf(Denver) = TSFC * F (Denver) = 203.1 kg/min
The results were obtained and listed in Table 7 above.
6.5.3. Longer Takeoff Roll
Under the assumptions of a constant aircraft takeoff weight (W), aerodynamic configuration (CL), and zero runway slope, we can formulate a ratio to compare the takeoff distance at a high elevation airport (Shigh) against a baseline sea level airport (SSL).
(Shigh) /(SSL) =(ƤSLhigh)2
(Shigh) = (SSL) * (ƤSLhigh)2
By applying this analytical relationship to an Airbus A380 – 800 at a constant weight comparing to sea level. Let us assume a nominal value of 2300 m based on specific payload parameters.
Shigh(Changi)= (2300m) * (1.225 / 1.224)2= 2303.76 m
Shigh(Atlanta) = (2300m) * (1.225 / 1.179)2= 2482.97 m
Shigh(Denver) = (2300m) * (1.225 / 0.99997)2= 3451.64 m
Table 8. Percentage increase in takeoff distance at different elevations.

Example Airport

Airport Elevation (m)

Takeoff Distance -Shigh (m)

Percentage Increase

Singapore Changi Airport

7

2303.76

0.16%

Hartsfield – Jackson Atlanta International Airport.

313

2482.97

7.96%

Denver International Airport

1655

3541.64

50%

7. Results and Discussion
The comparative analysis among the three airports: Singapore Changi Airport, Hartsfield – Jackson Atlanta International Airport, and Denver International Airport,
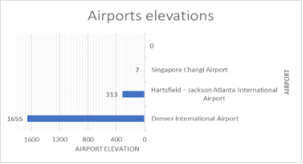
Figure 3. Airport elevations.
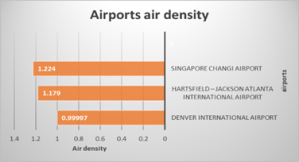
Figure 4. Air density at different elevations.
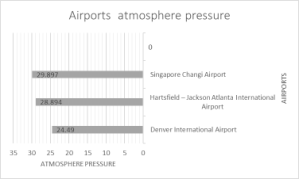
Figure 5. Air pressure at different elevations.
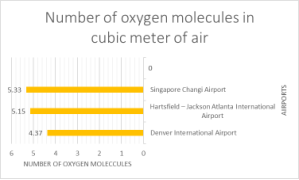
Which feature distinct elevations above MSL as illustrated in Figure 3, demonstrates a concomitant decline in both air density and atmospheric pressure (Figures 4 and 5). Additionally, Figure 6 reveals a clear inverse relationship between altitude and concentration of oxygen molecules per cubic meter of air. Also, the comparative analysis of the three airports at varying elevations indicates that for a four – engine Airbus a380 – 800 powered by Rolls – Royce Trent 970 engines, the air mass flow rate decreases progressively with the higher airport elevations (Table 5). Concurrently, the net engine thrust exhibits a downward trend as altitude (elevation) increases, as documented in (Table 6). Furthermore, during the takeoff roll, the fuel consumption rate decreases with elevated airports altitudes above MSL (Table 7), whereas the required takeoff distance increases significantly (Table 8).
Figure 6. Number of oxygen molecules in m3.
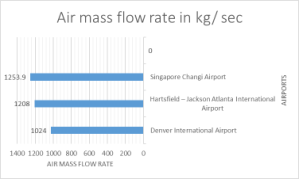
Figure 7. Air mass flow rate.
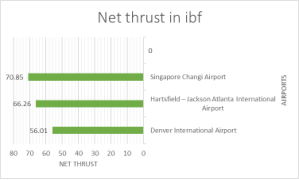
Figure 8. Net engine thrust.
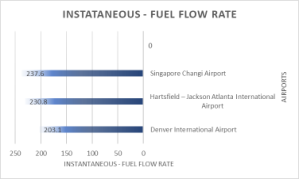
Figure 9. Instantaneous – fuel flow rate.
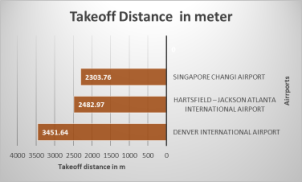
Figure 10. Required takeoff distance.

8. Conclusion
Both air density and atmospheric pressure are inversely proportional to the airport's elevation.
The reduction in air density at high elevations is almost negligible.
The air mass flow rate (mf) is directly proportional to the air density.
As the operating altitude increases from 313m to 1655 m, the aircraft's core exhaust velocity experiences an 8% to 10% reduction, attributed to the higher air mass flow rate processed by the engines.
A given percentage reduction in air density at high altitude results in approximately identical percentage decrease in force lift, assuming all other factors remain constant.
Engine thrust (Fn) is directly proportional to the air mass flow rate (mf).
As the operating altitude increases from 313m to 1655m, the instantaneous fuel consumption rate decreases by 12%.
As the operating altitude increases from 313m to 1655m, the required TOD increases by 28% and about 50% from MSL.
Results reveal a critical high – elevation trade- off: while Denver Airport achieves a 12% reduction in instantaneous fuel consumption, it suffers an extended TOD due to the thrust degradation. Within a sustainable development framework, the operational penalty increases local land- use for infrastructure and concentrates low – elevation emissions. Therefore, achieving true aviation eco – efficiency requires balancing global carbon reductions against localized environmental impacts.
Abbreviations

MSL

Mean Sea Level

SDGS

United Nations Sustainable Development Goals

ISA

International Standard Atmosphere

TOD

Take- Off Distance

TOW

Take – Off Weight

AP

Airport Performance

ICAO

International Civil Aviation Organization

TAS

True Airspeed

AE

Airport Elevation

AGL

Above Ground Level

OM

Oxygen Molecules

FC

Fuel Consumptions

TSFC

Thrust Specific Fuel Consumption

AGL

Above Ground Level

OM

Oxygen Molecules

FC

Fuel Consumptions

TSFC

Thrust Specific Fuel Consumption

Author Contributions
Abdel Latif Younes: Conceptualization, Methodology, Data curation, Formal analysis, Writing – original draft, Writing – review & editing.
Conflicts of Interest
The authors declare no conflicts of interest.
References
[1] J. D. Anderson Jr., Aircraft Performance and Design, 1 st ed. New York, NY, USA: McGraw – Hill Education, 1999.
[2] S. K. Chen and A. R. Jones, Analysis of Atmospheric Factors and Geographic Elevation Affecting Wide – Body Aircraft Takeoff Performance̋, IEEE Transactions on Aerospace and Electronic Systems, vol, 58, no.3, pp.2145-2154. Jun.2022.
[3] European Union Aviation Safety Agency (EASA), Acceptable Means of Compliance and Guidance Material to Commission Regulation on Air Operations – Annex IV (Part – CAT): Aircraft Performance Classes Evaluation̋, EASA Decision 2021/005/R, Cologne, Germany, 2021.
[4] M. H. Sadraey, “Investigation of Aircraft Performance Elements: Analytical Models for Ground Speed and Rate of Climb Transition” Journal of Aerospace Engineering and Technology, vol. 14. no.2, pp.88-97, May2024.
[5] H. G. Taylor and L. E. Fernandez, “Geodetic Standardization of Airport Elevation Definition and Runway Surveying Protocols” IEEE Transactions on Intelligent Transportation Systems, vol.16, no.4, pp. 3412-3421, April 2023.
[6] R. M. Santos and M. R. AI – Mansoor, “Operational Categorization of Global Airports Based on Geographic Elevation and Hot Performance Thresholds Protocols” IEEE Journal of Selected Topics in Applied Earth Observations and Remote Sensing, vol.26, no.4, pp.4812-4823, April 2025.
[7] M. S. Alam and A. K. M. M. Islam, “Altitude estimation using simplified barometric formula unmanned aerial vehicles”, in proceedings of the IEEE International Conference on Aerospace Electronics and Systems (ICAES),2021, PP. 88-93.
[8] International Civil Aviation Organization (ICAO), Manual of the ICAO Standard Atmosphere (extend to 80 Kilometers), Doc7488/3,3 rd., Montreal, Canada: ICAO, 1993.
[9] NOAA, NASA, and USAF, “U. S. Substandard Atmosphere”, 1976, National Oceanic and Atmospheric Administration, Washington, D. C., Rep. NO AA – S/T 76 – 1562, Oct, 1976.
[10] J. H. Seinfeid and S. N. Pandis, Atmospheric Chemistry and Physics: From Air Pollution to Climate Change, 3rd. Hoboken, NJ, USA: John Wiley &Sons, 2016, pp. 15-22.
[11] J. D. Mattingly, Elements of Propulsion: Gas Turbines and Rockets, 2 nd ed. Reston VA, USA: American Institute of Aeronautic and Astronautic (AIAA), 2014, PP.415-480.
[12] Marinoni, M. S. de Sousa, and E. C. Marques, Virtual sensing for air mass flow rate estimation in turbofan engines, IEEE Transportations on Aerospace and Electronic Systems, vol.56, no.4pp.2891-2902, Aug.2020.
[13] S. Farokhi, Aircraft Propulsion, 2 nd. Chichester, UK: John Wiley & Sons, 2014, pp.145-182.
[14] Airbus, Airbus A380 Aircraft Characteristics: Airport and Maintenance Planning, Airbus S. A. S., Blagnac, France, Rev. 21, Dec.2021.
[15] T. G. Langton and M. J. Hoseini, Mathematical modelling of thrust specific fuel consumption during various flight phases, IEEE Transaction on Aerospace and Electronic Systems, vol.55, no.3, pp.1422-1431, Jun. 2019.
Cite This Article
  • APA Style

    Younes, A. L. (2026). Impact of Airport Elevation on the Operational Performance and Fuel Consumption of Wide – Body Aircraft within a Sustainable Development Framework. American Journal of Environmental Science and Engineering, 10(3), 100-111. https://doi.org/10.11648/j.ajese.20261003.14

    Copy | Download

    ACS Style

    Younes, A. L. Impact of Airport Elevation on the Operational Performance and Fuel Consumption of Wide – Body Aircraft within a Sustainable Development Framework. Am. J. Environ. Sci. Eng. 2026, 10(3), 100-111. doi: 10.11648/j.ajese.20261003.14

    Copy | Download

    AMA Style

    Younes AL. Impact of Airport Elevation on the Operational Performance and Fuel Consumption of Wide – Body Aircraft within a Sustainable Development Framework. Am J Environ Sci Eng. 2026;10(3):100-111. doi: 10.11648/j.ajese.20261003.14

    Copy | Download

  • @article{10.11648/j.ajese.20261003.14,
      author = {Abdel Latif Younes},
      title = {Impact of Airport Elevation on the Operational Performance and Fuel Consumption of Wide – Body Aircraft within a Sustainable Development Framework},
      journal = {American Journal of Environmental Science and Engineering},
      volume = {10},
      number = {3},
      pages = {100-111},
      doi = {10.11648/j.ajese.20261003.14},
      url = {https://doi.org/10.11648/j.ajese.20261003.14},
      eprint = {https://article.sciencepublishinggroup.com/pdf/10.11648.j.ajese.20261003.14},
      abstract = {This paper evaluates the impact of airport elevation on the operational performance of wide – body aircraft within a sustainable aviation framework. A comparative analysis was conducted across three distinct elevations: Singapore Changi Airport, Hartsfield – Jackson Atlanta International Airport, and Denver International Airport. Empirical results indicate that elevated airport altitudes induce reductions in ambient air density, atmospheric pressure, and oxygen molecules in cubic meter of air. Consequently, the diminished air mass flow rate entering the propulsion system attenuates both net engine thrust and instantaneous fuel consumption rate. Conversely, this degradation in in aerodynamic and propulsive efficiency exacts a significant penalty by extending the required takeoff distance. Balancing these high – elevations performance trade – offs is essential for optimizing eco – efficiency. since aircraft operations at high elevation airports lead to land - use expansion for airport infrastructure and concentrate engine emissions in low - lying areas, managing operations in high elevation airports faces significant challenges. therefore, through the results of the comparative study among the three airports, and in order to achieve environmental and economic sustainable development in the aviation sector, this research has assisted decision makers in trade- offs and in evaluating the implications of managing flight operations at high elevation airports.},
     year = {2026}
    }
    

    Copy | Download

  • TY  - JOUR
    T1  - Impact of Airport Elevation on the Operational Performance and Fuel Consumption of Wide – Body Aircraft within a Sustainable Development Framework
    AU  - Abdel Latif Younes
    Y1  - 2026/09/02
    PY  - 2026
    N1  - https://doi.org/10.11648/j.ajese.20261003.14
    DO  - 10.11648/j.ajese.20261003.14
    T2  - American Journal of Environmental Science and Engineering
    JF  - American Journal of Environmental Science and Engineering
    JO  - American Journal of Environmental Science and Engineering
    SP  - 100
    EP  - 111
    PB  - Science Publishing Group
    SN  - 2578-7993
    UR  - https://doi.org/10.11648/j.ajese.20261003.14
    AB  - This paper evaluates the impact of airport elevation on the operational performance of wide – body aircraft within a sustainable aviation framework. A comparative analysis was conducted across three distinct elevations: Singapore Changi Airport, Hartsfield – Jackson Atlanta International Airport, and Denver International Airport. Empirical results indicate that elevated airport altitudes induce reductions in ambient air density, atmospheric pressure, and oxygen molecules in cubic meter of air. Consequently, the diminished air mass flow rate entering the propulsion system attenuates both net engine thrust and instantaneous fuel consumption rate. Conversely, this degradation in in aerodynamic and propulsive efficiency exacts a significant penalty by extending the required takeoff distance. Balancing these high – elevations performance trade – offs is essential for optimizing eco – efficiency. since aircraft operations at high elevation airports lead to land - use expansion for airport infrastructure and concentrate engine emissions in low - lying areas, managing operations in high elevation airports faces significant challenges. therefore, through the results of the comparative study among the three airports, and in order to achieve environmental and economic sustainable development in the aviation sector, this research has assisted decision makers in trade- offs and in evaluating the implications of managing flight operations at high elevation airports.
    VL  - 10
    IS  - 3
    ER  - 

    Copy | Download

Author Information
  • Abstract
  • Keywords
  • Document Sections

    1. 1. Introduction
    2. 2. Research Problem
    3. 3. Methodology
    4. 4. Aircraft t Performance and Airport Elevation
    5. 5. What Is Airport Altitude (elevation)
    6. 6. Airport Elevation and Factors That Affect Aircraft Performance
    7. 7. Results and Discussion
    8. 8. Conclusion
    Show Full Outline
  • Abbreviations
  • Author Contributions
  • Conflicts of Interest
  • References
  • Cite This Article
  • Author Information