1. Introduction
Live fish transport is an essential activity in aquaculture value chains, supporting the movement of juveniles, fingerlings, and market-size fish between hatcheries, nurseries, grow-out farms, and markets. As aquaculture expands across sub-Saharan Africa to strengthen food and nutrition security and reduce pressure on capture fisheries, transportation frequency has increased and has become a routine husbandry operation in many production systems
| [1] | FAO (2022). The State of World Fisheries and Aquaculture 2022: Towards Blue Transformation. Food and Agriculture Organization of the United Nations, Rome, Italy. |
| [2] | El-Sayed, A. F. M. (2020). Tilapia Culture, 2nd ed. Academic Press, London, UK. https://doi.org/10.1016/C2016-0-01732-3 |
[1, 2]
. Despite its importance, transportation is widely recognised as one of the most stressful management procedures in aquaculture because fish are exposed to simultaneous physical and chemical stressors that may trigger severe physiological disturbance and compromise welfare and performance
| [3] | Conte, F. S. (2004). Stress and the welfare of cultured fish. Applied Animal Behaviour Science, 86(3-4), 205-223.
https://doi.org/10.1016/j.applanim.2004.02.003 |
| [4] | Harmon, T. S. (2009). Methods for reducing stressors and maintaining water quality associated with live fish transport in tanks: a review. Aquaculture, 295(3-4), 250-258.
https://doi.org/10.1016/j.aquaculture.2009.06.018 |
| [5] | Wedemeyer, G. A. (1996). Physiology of Fish in Intensive Culture Systems. Springer, New York, NY, USA.
https://doi.org/10.1007/978-1-4612-4916-7 |
[3-5]
. Poorly managed transport is therefore associated with mortality, reduced growth, post-transport disease outbreaks, reduced product quality, and delayed recovery, all of which translate into economic losses for farmers and value-chain actors
| [6] | Barton, B. A. (2002). Stress in fishes: a diversity of responses with particular reference to changes in circulating corticosteroids. Integrative and Comparative Biology, 42(3), 517-525.
https://doi.org/10.1093/icb/42.3.517 |
| [7] | Iversen, M., Finstad, B., Nilssen, K. J. (2020). Stress responses in Atlantic salmon (Salmo salar) smolts during commercial well-boat transport and effects on survival. Aquaculture, 526, 735409. https://doi.org/10.1016/j.aquaculture.2020.735409 |
| [8] | Schreck, C. B., Tort, L. (2016). The concept of stress in fish. In: Schreck, C. B., Tort, L., Farrell, A. P., Brauner, C. J. (Eds.), Biology of Stress in Fish. Academic Press, San Diego, CA, USA, pp. 1-34.
https://doi.org/10.1016/B978-0-12-802728-8.00001-1 |
[6-8]
.
In teleost fish, stress can be defined as a biological state where environmental or husbandry challenges threaten physiological homeostasis, forcing the fish to activate compensatory regulatory mechanisms
| [8] | Schreck, C. B., Tort, L. (2016). The concept of stress in fish. In: Schreck, C. B., Tort, L., Farrell, A. P., Brauner, C. J. (Eds.), Biology of Stress in Fish. Academic Press, San Diego, CA, USA, pp. 1-34.
https://doi.org/10.1016/B978-0-12-802728-8.00001-1 |
| [9] | Wendelaar Bonga, S. E. (1997). The stress response in fish. Physiological Reviews, 77(3), 591-625.
https://doi.org/10.1152/physrev.1997.77.3.591 |
[8, 9]
. The stress response is often described as a progressive cascade. Primary responses involve neuroendocrine activation, particularly stimulation of the hypothalamic–pituitary–interrenal axis and cortisol release. Secondary responses include metabolic and physiological adjustments such as elevated glucose levels, altered acid–base balance, and disruption of ionic regulation. Tertiary responses occur at the whole-organism level and may include immune suppression, reduced growth, reproductive impairment, and mortality
| [6] | Barton, B. A. (2002). Stress in fishes: a diversity of responses with particular reference to changes in circulating corticosteroids. Integrative and Comparative Biology, 42(3), 517-525.
https://doi.org/10.1093/icb/42.3.517 |
| [10] | Tort, L. (2011). Stress and immune modulation in fish. Developmental and Comparative Immunology, 35(12), 1366-1375. https://doi.org/10.1016/j.dci.2011.07.002 |
| [11] | Mommsen, T. P., Vijayan, M. M., Moon, T. W. (1999). Cortisol in teleosts: dynamics, mechanisms of action, and metabolic regulation. Reviews in Fish Biology and Fisheries, 9, 211-268. https://doi.org/10.1023/A:1008924418720 |
| [12] | Iwama, G. K., Afonso, L. O. B., Todgham, A., Ackerman, P., Nakano, K. (2011). Are hsps suitable for indicating stressed states in fish? Journal of Experimental Biology, 214(20), 3496-3506. https://doi.org/10.1242/jeb.051938 |
[6, 10-12]
. Consequently, transport stress can be quantified through direct performance outcomes (survival/mortality) and through endocrine, metabolic, and osmoregulatory biomarkers that reflect internal physiological disturbance.
Low dissolved oxygen (hypoxia) is among the most influential drivers of transport stress, particularly where fish are carried in sealed containers such as polythene bags. In sealed systems, oxygen is rapidly consumed by respiration while carbon dioxide accumulates, lowering pH and impairing respiratory efficiency. At the same time, nitrogenous wastes, especially ammonia, build up and may become toxic depending on temperature and pH
| [2] | El-Sayed, A. F. M. (2020). Tilapia Culture, 2nd ed. Academic Press, London, UK. https://doi.org/10.1016/C2016-0-01732-3 |
| [13] | Boyd, C. E., Tucker, C. S. (2012). Pond Aquaculture Water Quality Management. Springer, New York, NY, USA.
https://doi.org/10.1007/978-1-4615-5407-3 |
[2, 13]
. Hypoxia constrains aerobic metabolism and triggers compensatory adjustments including increased ventilation, altered cardiovascular activity, and mobilisation of energy reserves, with stress intensity increasing as exposure duration and severity rise
. Even hypoxia-tolerant species such as tilapias may experience significant metabolic and endocrine disturbance when hypoxia occurs simultaneously with confinement and progressive deterioration of transport water quality typically associated with sealed systems
.
High loading density (overcrowding) interacts strongly with oxygen limitation to intensify stress during transport. Increased density raises oxygen demand and accelerates deterioration of water quality, creating a feedback mechanism in which declining water conditions further stimulate physiological strain
| [3] | Conte, F. S. (2004). Stress and the welfare of cultured fish. Applied Animal Behaviour Science, 86(3-4), 205-223.
https://doi.org/10.1016/j.applanim.2004.02.003 |
| [7] | Iversen, M., Finstad, B., Nilssen, K. J. (2020). Stress responses in Atlantic salmon (Salmo salar) smolts during commercial well-boat transport and effects on survival. Aquaculture, 526, 735409. https://doi.org/10.1016/j.aquaculture.2020.735409 |
[3, 7]
. Crowding also increases physical contact and agitation among fish, which may increase abrasions, fin injuries, and energetic costs, thereby amplifying neuroendocrine stress responses
. In many cultured species, the relationship between loading density and mortality is non-linear, characterised by threshold points beyond which survival declines sharply even when oxygen is increased, implying that density management is often the critical determinant of transport success
| [7] | Iversen, M., Finstad, B., Nilssen, K. J. (2020). Stress responses in Atlantic salmon (Salmo salar) smolts during commercial well-boat transport and effects on survival. Aquaculture, 526, 735409. https://doi.org/10.1016/j.aquaculture.2020.735409 |
| [17] | Bolasina, S., Tagawa, M., Yamamoto, T., et al. (2006). Effect of stocking density on growth, stress response, and immunological parameters of juvenile Japanese flounder (Paralichthys olivaceus). Aquaculture, 259(1-4), 377-385.
https://doi.org/10.1016/j.aquaculture.2006.05.012 |
[7, 17]
. This issue is particularly important for smallholder aquaculture where transport is commonly performed using sealed bags, and farmers attempt to reduce costs by packing fish at high densities.
Physiologically, the endocrine response to transport stress is commonly reflected by elevation of circulating cortisol, a glucocorticoid hormone central to energy mobilisation, osmoregulation, and modulation of immune function
| [6] | Barton, B. A. (2002). Stress in fishes: a diversity of responses with particular reference to changes in circulating corticosteroids. Integrative and Comparative Biology, 42(3), 517-525.
https://doi.org/10.1093/icb/42.3.517 |
| [10] | Tort, L. (2011). Stress and immune modulation in fish. Developmental and Comparative Immunology, 35(12), 1366-1375. https://doi.org/10.1016/j.dci.2011.07.002 |
[6, 10]
. Increases in cortisol are frequently accompanied by elevated blood glucose due to enhanced gluconeogenesis and glycogenolysis, enabling fish to meet increased energetic demand during acute stress
| [8] | Schreck, C. B., Tort, L. (2016). The concept of stress in fish. In: Schreck, C. B., Tort, L., Farrell, A. P., Brauner, C. J. (Eds.), Biology of Stress in Fish. Academic Press, San Diego, CA, USA, pp. 1-34.
https://doi.org/10.1016/B978-0-12-802728-8.00001-1 |
| [11] | Mommsen, T. P., Vijayan, M. M., Moon, T. W. (1999). Cortisol in teleosts: dynamics, mechanisms of action, and metabolic regulation. Reviews in Fish Biology and Fisheries, 9, 211-268. https://doi.org/10.1023/A:1008924418720 |
[8, 11]
. These biomarkers are widely validated as sensitive indicators of acute stress in teleosts and provide a practical approach to evaluating transport-induced disturbance
| [5] | Wedemeyer, G. A. (1996). Physiology of Fish in Intensive Culture Systems. Springer, New York, NY, USA.
https://doi.org/10.1007/978-1-4612-4916-7 |
| [12] | Iwama, G. K., Afonso, L. O. B., Todgham, A., Ackerman, P., Nakano, K. (2011). Are hsps suitable for indicating stressed states in fish? Journal of Experimental Biology, 214(20), 3496-3506. https://doi.org/10.1242/jeb.051938 |
[5, 12]
. Transport stress also compromises osmoregulatory capacity because gill epithelia function in both gas exchange and ionic regulation. Under deteriorating water chemistry and hypoxia, changes in gill permeability and ion transport may lead to significant electrolyte imbalance, often reflected by reduced plasma sodium (Na
+) and chloride (Cl
-) levels
| [18] | Evans, D. H., Piermarini, P. M., Choe, K. P. (2005). The multifunctional fish gill: dominant site of gas exchange, osmoregulation, acid-base regulation, and excretion of nitrogenous waste. Physiological Reviews, 85(1), 97-177.
https://doi.org/10.1152/physrev.00050.2003 |
| [19] | Hwang, P. P., Lin, L. Y. (2013). Gill ion transport, acid-base regulation, and ammonia excretion. In: Evans, D. H., Claiborne, J. B. (Eds.), The Physiology of Fishes, 4th ed. CRC Press, Boca Raton, FL, USA, pp. 205-233. |
[18, 19]
. Ionic disturbance increases physiological workload and may reduce post-transport recovery, especially under combined crowding and oxygen limitation
| [2] | El-Sayed, A. F. M. (2020). Tilapia Culture, 2nd ed. Academic Press, London, UK. https://doi.org/10.1016/C2016-0-01732-3 |
| [12] | Iwama, G. K., Afonso, L. O. B., Todgham, A., Ackerman, P., Nakano, K. (2011). Are hsps suitable for indicating stressed states in fish? Journal of Experimental Biology, 214(20), 3496-3506. https://doi.org/10.1242/jeb.051938 |
[2, 12]
.
Although transport stress research is extensive for Nile tilapia (
Oreochromis niloticus), relatively limited evidence exists for
Oreochromis variabilis, an indigenous tilapia of ecological and conservation relevance in the Lake Victoria basin. Species-specific differences in stress tolerance are well documented, and best-management recommendations derived from widely farmed species may not be directly transferable to endemic species
| [8] | Schreck, C. B., Tort, L. (2016). The concept of stress in fish. In: Schreck, C. B., Tort, L., Farrell, A. P., Brauner, C. J. (Eds.), Biology of Stress in Fish. Academic Press, San Diego, CA, USA, pp. 1-34.
https://doi.org/10.1016/B978-0-12-802728-8.00001-1 |
| [16] | Randall, D. J., Tsui, T. K. N. (2002). Ammonia toxicity in fish. Marine Pollution Bulletin, 45(1-12), 17-23.
https://doi.org/10.1016/S0025-326X(02)00227-8 |
[8, 16]
. In Western Kenya, movement of live fish between hatcheries and farms is common, and transport-related losses linked to crowding and oxygen management are frequently reported by farmers, suggesting a need for locally informed evidence to guide transport protocols.
Therefore, this study quantified transport stress responses in juvenile Oreochromis variabilis under low oxygen and high loading density during road transportation in sealed polythene bags by assessing (i) mortality rate (%) and (ii) endocrine, metabolic, and osmoregulatory biomarkers, including serum cortisol, blood glucose, and plasma Na+ and Cl- ions, measured before and after transport. The findings are expected to support evidence-based recommendations on loading density limits and oxygen management, thereby reducing mortality, improving fish welfare, and enhancing sustainability of O. variabilis culture under smallholder conditions.
2. Materials and Methods
2.1. Study Design and Transport Protocol
This study quantified transport stress responses in juvenile
Oreochromis variabilis exposed to combined stressors of high loading density and reduced oxygen availability during road transportation in sealed polythene bags. Live fish transport is known to induce physiological disturbance due to handling, confinement and progressive deterioration of water quality
| [20] | APHA (2017). Standard Methods for the Examination of Water and Wastewater, 23rd ed. American Public Health Association, Washington, DC, USA. |
| [21] | Boyd, C. E. (2020). Water Quality: An Introduction. Springer, Cham, Switzerland.
https://doi.org/10.1007/978-3-030-23335-8 |
| [22] | Emerson, K., Russo, R. C., Lund, R. E., Thurston, R. V. (1975). Aqueous ammonia equilibrium calculations: effect of pH and temperature. Journal of the Fisheries Research Board of Canada, 32, 2379-2383.
https://doi.org/10.1139/f75-274 |
[20-22]
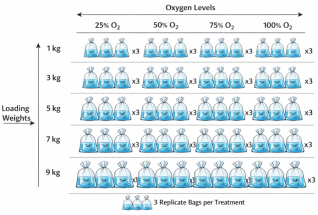
. The experiment followed a factorial arrangement where fish were packaged at five loading weights (1, 3, 5, 7 and 9 kg per bag) and supplied with four oxygen levels (25%, 50%, 75% and 100%), with each treatment combination replicated three times. The experimental unit was a single polythene bag.
Fish were transported by road from Kabonyo fish farm (Kisumu County) to Dominion farm (Siaya County), a distance of approximately 100 km. The journey lasted about two hours at an average vehicle speed of approximately 50 km h
-¹, monitored at 10-minute intervals using the vehicle speedometer. Transport was conducted in Styrofoam boxes to minimise temperature fluctuation and thereby reduce metabolic oxygen demand and mortality
. Although oxygen was supplemented at the time of packaging, the design simulated realistic sealed-bag transport conditions in which oxygen may progressively decline with respiration while carbon dioxide and nitrogenous wastes accumulate, especially under high loading density
| [22] | Emerson, K., Russo, R. C., Lund, R. E., Thurston, R. V. (1975). Aqueous ammonia equilibrium calculations: effect of pH and temperature. Journal of the Fisheries Research Board of Canada, 32, 2379-2383.
https://doi.org/10.1139/f75-274 |
| [24] | Martinez-Porchas, M., Martinez-Cordova, L. R. (2012). World aquaculture: environmental impacts and troubleshooting alternatives. The Scientific World Journal, 2012, 389623.
https://doi.org/10.1100/2012/389623 |
[22, 24]
.
2.2. Fish Collection, Acclimation and Biometric Measurements
Juvenile
O. variabilis (mean weight ≈ 20 g) were harvested using a seine net from grow-out ponds at Kabonyo fish farm. To minimise capture-related stress and stabilise baseline physiological conditions prior to treatment exposure, fish were held for 24 hours in a nylon cage (approximately 1.5 m
3) installed within the source pond
| [25] | Tietz, N. W., Logan, B. (1987). Clinical Guide to Laboratory Tests, 2nd ed. W. B. Saunders, Philadelphia, PA, USA. |
| [26] | Zar, J. H. (2010). Biostatistical Analysis, 5th ed. Prentice Hall, Upper Saddle River, NJ, USA. |
[25, 26]
. During acclimation, pond temperature was maintained at 24 ± 1°C by topping up with cool water stored in a farm reservoir.
At the end of acclimation, fish were measured for total length (TL, cm) to the nearest 0.1 cm using a measuring board and weighed to the nearest 0.1 g using an electronic balance (Digtron T745). Fish were then allocated into treatment groups corresponding to the loading weight treatments.
2.3. Packaging Procedure, Oxygen Treatments and Temperature Control
Transport units were prepared using polythene bags containing 10 L of water. Fish were stocked into bags at the assigned loading weights (1, 3, 5, 7 or 9 kg). For each loading group, bags were supplied with oxygen according to the assigned oxygen level (25%, 50%, 75% or 100%) and sealed immediately after oxygen introduction. Sealed bags were placed in Styrofoam boxes to provide insulation and protect fish from direct sunlight and mechanical shock during transportation. Ice cubes were placed above sealed bags within the Styrofoam boxes to maintain transport water temperature below 18°C and reduce fish metabolism and oxygen consumption during transit
| [21] | Boyd, C. E. (2020). Water Quality: An Introduction. Springer, Cham, Switzerland.
https://doi.org/10.1007/978-3-030-23335-8 |
| [22] | Emerson, K., Russo, R. C., Lund, R. E., Thurston, R. V. (1975). Aqueous ammonia equilibrium calculations: effect of pH and temperature. Journal of the Fisheries Research Board of Canada, 32, 2379-2383.
https://doi.org/10.1139/f75-274 |
[21, 22]
.
Figure 1. Factorial packaging design (five loading weights × four oxygen levels, triplicate bags).
2.4. Blood Sampling Schedule
Transport stress was evaluated using baseline and post-transport blood sampling. Baseline samples were obtained prior to packaging to establish initial physiological status. Post-transport samples were obtained immediately after arrival at Dominion farm, with sampling conducted separately for each treatment bag to capture treatment-specific responses.
Fish were collected from each bag using a scoop net and transferred into plastic basins containing water of similar temperature to the transport bags to minimise thermal shock, which can affect cortisol secretion and electrolyte balance
| [27] | Fazio, F. (2019). Fish hematology analysis as an important tool of aquaculture: a review. Aquaculture, 500, 237-242.
https://doi.org/10.1016/j.aquaculture.2018.10.030 |
| [28] | Iwama, G. K., Afonso, L. O. B., Vijayan, M. M. (2011). Stress in fish. In: Farrell, A. P. (Ed.), Encyclopedia of Fish Physiology: From Genome to Environment. Academic Press, San Diego, CA, USA, pp. 2267-2275.
https://doi.org/10.1016/B978-0-12-374553-8.00208-1 |
[27, 28]
.
2.5. Anaesthesia and Blood Collection Procedure
Fish were anaesthetised prior to sampling using 2-phenoxyethanol (1:2000; Sigma-Aldrich, St. Louis, MO, USA). This anaesthetic is widely applied in fish physiology studies because it provides effective sedation and facilitates safe collection of blood samples
| [27] | Fazio, F. (2019). Fish hematology analysis as an important tool of aquaculture: a review. Aquaculture, 500, 237-242.
https://doi.org/10.1016/j.aquaculture.2018.10.030 |
| [29] | Schreck, C. B., Tort, L., Farrell, A. P., Brauner, C. J. (2016). Biology of Stress in Fish. Academic Press, San Diego, CA, USA. https://doi.org/10.1016/B978-0-12-802728-8 |
[27, 29]
. After sedation, blood was withdrawn from the caudal vasculature using heparinised 5 mL syringes fitted with 21-gauge needles. Fish were randomly sampled from each bag, and the approximate sample size ranged from 50 to 90 fish depending on bag loading.
Within each bag/treatment, blood from sampled fish was pooled to generate a representative sample for biochemical analysis. A portion of blood was deproteinised using 8% perchloric acid (PCA), while anticoagulant-free blood was transferred into 1.5 mL microcentrifuge tubes and refrigerated overnight in a slanted position to facilitate serum separation. Samples were centrifuged at 4000 rpm for 4 minutes and the serum/plasma fraction stored at −20 °C until analysis. These handling and storage practices are recommended to preserve hormone, metabolite and electrolyte stability during laboratory processing
| [26] | Zar, J. H. (2010). Biostatistical Analysis, 5th ed. Prentice Hall, Upper Saddle River, NJ, USA. |
| [28] | Iwama, G. K., Afonso, L. O. B., Vijayan, M. M. (2011). Stress in fish. In: Farrell, A. P. (Ed.), Encyclopedia of Fish Physiology: From Genome to Environment. Academic Press, San Diego, CA, USA, pp. 2267-2275.
https://doi.org/10.1016/B978-0-12-374553-8.00208-1 |
[26, 28]
.
2.6. Determination of Cortisol, Glucose and Plasma Ions
Serum cortisol concentration was quantified as the primary endocrine indicator of transport stress and activation of the hypothalamic–pituitary–interrenal axis
| [25] | Tietz, N. W., Logan, B. (1987). Clinical Guide to Laboratory Tests, 2nd ed. W. B. Saunders, Philadelphia, PA, USA. |
| [26] | Zar, J. H. (2010). Biostatistical Analysis, 5th ed. Prentice Hall, Upper Saddle River, NJ, USA. |
[25, 26]
. Cortisol was measured using a commercial enzyme immunoassay kit (Cortisol EIA Kit; Enzo Life Sciences International Inc., PA, USA). Prior to analysis, serum was diluted by adding assay buffer to 10 µL of serum to obtain a final volume of 100 µL, and the assay was performed at room temperature following manufacturer instructions.
Blood glucose was measured as a secondary stress indicator of metabolic mobilisation, which commonly accompanies acute crowding and hypoxia stress
| [31] | Burtis, C. A., Bruns, D. E., Sawyer, B. G., & Ashwood, E. R. (2018). Tietz Textbook of Clinical Chemistry and Molecular Diagnostics (6th ed.). Elsevier, St. Louis, MO, USA.
https://doi.org/10.1016/C2015-0-00119-2 |
| [32] | Sokal, R. R., & Rohlf, F. J. (2012). Biometry: The Principles and Practice of Statistics in Biological Research (4th ed.). W. H. Freeman & Company, New York, NY, USA. |
[31, 32]
. Glucose concentration was determined using a handheld glucose meter (OneTouch Ultra; LifeScan, Milpitas, CA, USA). Approximately 10 µL of blood was applied onto a clean surface and the test strip inserted until the confirmation window filled, after which glucose concentration was recorded in mg dL
-¹.
Plasma sodium (Na
+) and chloride (Cl
-) concentrations were analysed as indicators of osmoregulatory disturbance, given that transport-related hypoxia, CO
2 accumulation and gill disruption can impair ion regulation
| [18] | Evans, D. H., Piermarini, P. M., Choe, K. P. (2005). The multifunctional fish gill: dominant site of gas exchange, osmoregulation, acid-base regulation, and excretion of nitrogenous waste. Physiological Reviews, 85(1), 97-177.
https://doi.org/10.1152/physrev.00050.2003 |
| [19] | Hwang, P. P., Lin, L. Y. (2013). Gill ion transport, acid-base regulation, and ammonia excretion. In: Evans, D. H., Claiborne, J. B. (Eds.), The Physiology of Fishes, 4th ed. CRC Press, Boca Raton, FL, USA, pp. 205-233. |
[18, 19]
. Electrolyte concentrations were determined using ion-selective electrodes (ISE) following established clinical chemistry procedures
| [31] | Burtis, C. A., Bruns, D. E., Sawyer, B. G., & Ashwood, E. R. (2018). Tietz Textbook of Clinical Chemistry and Molecular Diagnostics (6th ed.). Elsevier, St. Louis, MO, USA.
https://doi.org/10.1016/C2015-0-00119-2 |
[31]
, using Synermed ISE reagents.
2.7. Survival Assessment Following Transportation
Survival was assessed immediately after transport by gradually transferring fish from each bag into a wide open holding tank (2 × 2 × 1 m) containing clean, well-aerated water. Dead fish were removed and counted, and remaining fish were enumerated. Survival per bag was calculated from the initial number stocked minus the number of dead fish observed after transport, with mortality expressed as a percentage. Mortality and survival are widely used performance endpoints for assessing transport tolerance in live fish transport studies
| [21] | Boyd, C. E. (2020). Water Quality: An Introduction. Springer, Cham, Switzerland.
https://doi.org/10.1007/978-3-030-23335-8 |
| [22] | Emerson, K., Russo, R. C., Lund, R. E., Thurston, R. V. (1975). Aqueous ammonia equilibrium calculations: effect of pH and temperature. Journal of the Fisheries Research Board of Canada, 32, 2379-2383.
https://doi.org/10.1139/f75-274 |
[21, 22]
.
2.8. Water Quality Monitoring During Transportation
Water quality parameters were measured immediately before fish packaging and immediately upon arrival at the destination to assess environmental changes associated with sealed-bag transportation. Continuous measurements during transportation were not conducted due to logistical constraints associated with sealed-bag transport under field conditions. Consequently, the before–after comparisons were used to characterise the magnitude of water quality deterioration associated with transport. Dissolved oxygen (DO, mg L⁻¹) and temperature (°C) were measured in situ using a portable digital multiparameter meter (YSI ProPlus, YSI Inc., USA). Water pH was determined using a calibrated handheld pH meter (Hanna Instruments, USA). Total ammonia nitrogen (TAN) was analysed colorimetrically using the Nessler method, while unionised ammonia (NH₃) was calculated from TAN, temperature and pH according to standard conversion equations. Dissolved carbon dioxide (CO
2) concentration was determined by titration using standard acid–base methods. All analytical procedures followed standard methods for the examination of water and wastewater
| [21] | Boyd, C. E. (2020). Water Quality: An Introduction. Springer, Cham, Switzerland.
https://doi.org/10.1007/978-3-030-23335-8 |
| [22] | Emerson, K., Russo, R. C., Lund, R. E., Thurston, R. V. (1975). Aqueous ammonia equilibrium calculations: effect of pH and temperature. Journal of the Fisheries Research Board of Canada, 32, 2379-2383.
https://doi.org/10.1139/f75-274 |
| [23] | Ross, L. G., Ross, B. (2008). Anaesthetic and Sedative Techniques for Aquatic Animals, 3rd ed. Blackwell Publishing, Oxford, UK. https://doi.org/10.1002/9781444302264 |
| [24] | Martinez-Porchas, M., Martinez-Cordova, L. R. (2012). World aquaculture: environmental impacts and troubleshooting alternatives. The Scientific World Journal, 2012, 389623.
https://doi.org/10.1100/2012/389623 |
[21-24]
.
2.9. Statistical analysis
Data were entered and checked for accuracy prior to analysis. Mortality was expressed as percentage per experimental unit (bag). Physiological indicators analysed included serum cortisol, blood glucose, and plasma sodium (Na
+) and chloride (Cl
-) concentrations. Effects of loading density and oxygen level were assessed using two-way analysis of variance (two-way ANOVA), with loading weight (1, 3, 5, 7 and 9 kg) and oxygen level (25%, 50%, 75% and 100%) as fixed factors. Tukey’s honestly significant difference (HSD) test was used for post hoc comparisons where significant effects occurred. Assumptions of normality and homogeneity of variances were assessed using Shapiro–Wilk and Levene tests, respectively, and data were log-transformed where required
| [32] | Sokal, R. R., & Rohlf, F. J. (2012). Biometry: The Principles and Practice of Statistics in Biological Research (4th ed.). W. H. Freeman & Company, New York, NY, USA. |
[32]
. In addition, linear regression was used to examine the relationship between loading weight and mortality. Differences in water quality parameters before and after transport were evaluated using paired t-tests. Statistical significance was accepted at p < 0.05.
2.10. Ethical considerations
All handling and sampling procedures were conducted with the intention of minimising stress and unnecessary suffering. Fish were acclimatised prior to transport simulation, anaesthetised before blood sampling, and transferred carefully into recovery tanks following transport. Anaesthesia using 2-phenoxyethanol and caudal blood sampling are established methods in fish physiology and are considered appropriate for reducing distress during sampling
| [29] | Schreck, C. B., Tort, L., Farrell, A. P., Brauner, C. J. (2016). Biology of Stress in Fish. Academic Press, San Diego, CA, USA. https://doi.org/10.1016/B978-0-12-802728-8 |
| [27] | Fazio, F. (2019). Fish hematology analysis as an important tool of aquaculture: a review. Aquaculture, 500, 237-242.
https://doi.org/10.1016/j.aquaculture.2018.10.030 |
[29, 27]
. No protected species were used, and procedures followed accepted good practice standards for fish welfare during experimental handling.
3. Results
Transport stress significantly affected survival and physiological stress indicators in juvenile
Oreochromis variabilis. Both loading weight and oxygen supply influenced percentage survival (p < 0.05) and altered blood parameters (serum cortisol, glucose, plasma Na
+ and Cl
-) at destination (p < 0.01). Across all treatments, stress responses were expressed as increased cortisol and glucose concentrations, accompanied by reduced plasma sodium and chloride concentrations compared with baseline values (
Table 1). Overall, increasing loading density progressively intensified stress responses and increased mortality, while higher oxygen supply mitigated mortality and moderated biochemical disturbances.
Table 1. Survival (%) and post-transport blood parameters of Oreochromis variabilis under different loading weights and oxygen supply levels.
Loading weight | Oxygen (%) | Survival (%) | Cortisol | Glucose | Sodium (Na+) | Chloride (Cl-) |
1 kg | 25 | 100 | 30 | 40 | 114 | 230 |
| 50 | 100 | 27 | 38 | 122 | 269 |
| 75 | 100 | 24 | 34 | 134 | 281 |
| 100 | 100 | 20 | 30 | 141 | 300 |
3 kg | 25 | 67 | 48 | 36 | 83 | 170 |
| 50 | 70 | 45 | 31 | 88 | 230 |
| 75 | 85 | 40 | 26 | 97 | 252 |
| 100 | 98 | 37 | 21 | 120 | 268 |
5 kg | 25 | 58 | 45 | 43 | 57 | 123 |
5 kg | 50 | 75 | 40 | 35 | 69 | 145 |
5 kg | 75 | 81 | 36 | 27 | 78 | 172 |
5 kg | 100 | 86 | 30 | 23 | 108 | 228 |
| 25 | 22 | 73 | 50 | 24 | 73 |
| 50 | 33 | 65 | 38 | 37 | 95 |
| 75 | 40 | 45 | 34 | 43 | 112 |
| 100 | 65 | 38 | 23 | 76 | 120 |
9 kg | 25 | 2 | 82 | 63 | 12 | 25 |
| 50 | 3 | 70 | 56 | 17 | 33 |
| 75 | 4 | 57 | 51 | 20 | 57 |
| 100 | 11 | 43 | 40 | 31 | 65 |
3.1. Survival Response Following Transport
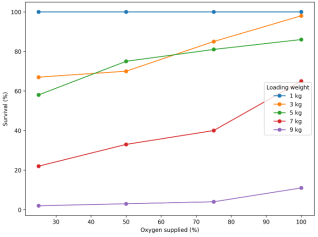
Survival was strongly affected by loading weight and oxygen level, declining sharply as loading density increased and improving with increasing oxygen supplementation. Fish transported at the lowest loading density (1 kg) maintained 100% survival across all oxygen levels (25–100%). At 3 kg, survival improved from 67% under 25% oxygen to 98% under 100% oxygen. Moderate loading (5 kg) recorded intermediate survival (58–86%), while high loading treatments showed marked losses: survival ranged from 22–65% at 7 kg, and only 2–11% at 9 kg. Although higher oxygen levels improved survival within all treatments, the effect was insufficient to prevent severe mortality at extreme loading density (9 kg), indicating that crowding became the dominant constraint even under oxygen enrichment.
Figure 2. Survival (%) of juvenile O. variabilis after transport as influenced by five loading weights (1–9 kg) and four oxygen supply levels (25–100%). Values represent means (triplicate bags).
3.2. Changes in Water Quality Before and After Transport
Transport was associated with significant deterioration of the aquatic environment within sealed bags, as reflected by marked changes in dissolved oxygen, temperature, pH, ammonia and carbon dioxide concentrations measured before packaging and upon arrival at the destination (
Table 2). These parameters are key drivers of physiological stress in transported fish and provide mechanistic context for the observed mortality and biomarker responses. Comparative analysis using paired t-tests confirmed that all measured water quality variables differed significantly between pre- and post-transport conditions (p < 0.001).
Table 2. Water quality parameters before and after transport of O. variabilis.
Parameter | Before Transport (Mean ± SD) | After Transport (Mean ± SD) | t-value | p-value |
Dissolved oxygen (mg L⁻¹) | 6.8 ± 0.4 | 2.1 ± 0.6 | 18.42 | <0.001 |
Temperature (°C) | 24.0 ± 1.0 | 17.5 ± 0.8 | 11.36 | <0.001 |
pH | 7.4 ± 0.2 | 6.5 ± 0.3 | 9.27 | <0.001 |
Total ammonia (mg L⁻¹) | 0.12 ± 0.03 | 1.45 ± 0.25 | 16.89 | <0.001 |
Unionised NH₃ (mg L⁻¹) | 0.003 ± 0.001 | 0.085 ± 0.014 | 15.21 | <0.001 |
Carbon dioxide (mg L⁻¹) | 4.1 ± 0.6 | 18.7 ± 2.3 | 14.77 | <0.001 |
(Independent paired t-test comparing before vs after transport values)
Dissolved oxygen concentration declined sharply following transport, indicating rapid respiratory oxygen consumption under confined conditions. Although water temperature was reduced through ice insulation, progressive accumulation of metabolic wastes occurred, as evidenced by substantial increases in total ammonia and dissolved carbon dioxide concentrations. The decrease in pH following transport reflects acidification associated with CO2 buildup and ammonia-related biochemical processes. Notably, unionised ammonia reached levels known to impair gill function and ionoregulation in tilapia species, particularly under combined crowding and hypoxia stress. These water quality shifts confirm that increasing loading density accelerated environmental deterioration within transport bags, thereby intensifying physiological stress and mortality risk.
3.3. Cortisol Response to Combined Overcrowding and Low Oxygen Stress
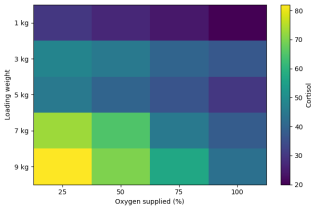
Serum cortisol concentration differed significantly among treatments (p < 0.01) and increased consistently with loading weight. The lowest cortisol values were recorded at 1 kg loading (20–30 units), while the highest levels occurred at 9 kg loading (43–82 units). Within each loading group, cortisol tended to decrease with increasing oxygen level, indicating that oxygen supplementation reduced stress severity. This effect was minor at low loading densities but became more pronounced at higher loads, where cortisol hotspots were concentrated under combined high loading and low oxygen supply.
Figure 3. Heatmap of serum cortisol concentration showing stress intensity across loading weights and oxygen levels (darker zones indicate higher cortisol).
3.4. Plasma Sodium (Na+) as an Indicator of Osmoregulatory Disturbance
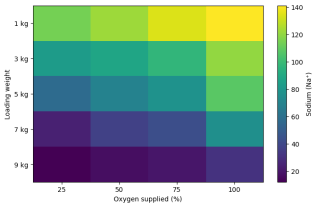
Plasma sodium concentration declined significantly following transport compared with baseline (p < 0.05), reflecting osmotic and ionic imbalance induced by transport stress. Sodium levels were highest at low loading and high oxygen (e.g., 141 units at 1 kg under 100% oxygen) and declined sharply as loading density increased, reaching minimum levels under 9 kg loading at 25% oxygen (12 units). Within all loading weight treatments, sodium generally increased with increasing oxygen supply, suggesting partial recovery or reduced impairment of ion regulation under improved oxygenation.
Figure 4. Heatmap of plasma sodium (Na+) concentration across loading weights and oxygen levels after transportation.
3.5. Plasma Chloride Response
Plasma chloride concentration showed a significant post-transport decline compared with baseline values (p < 0.05) and varied systematically with loading and oxygen treatments (
Table 1). Chloride concentrations were highest at low loading densities (1 kg) and lowest under the highest loading density (9 kg). Within each loading category, increasing oxygen supply improved chloride retention, indicating reduced osmoregulatory disturbance under higher oxygen availability.
Because chloride patterns closely mirrored sodium trends, and because sodium and chloride are physiologically coupled during ionoregulation, chloride results are presented in
Table 1 without additional graphical presentation to maintain a concise Results section.
4. Discussions
This study evaluated the combined effects of loading density and oxygen supply on survival and physiological stress responses in juvenile
Oreochromis variabilis during sealed-bag road transportation. The findings demonstrate that transport stress was strongly density-dependent and intensified under reduced oxygen supply, resulting in substantial mortality and pronounced endocrine–metabolic and osmoregulatory disturbances. Across treatments, increasing loading weight progressively reduced survival (
Figure 2) while simultaneously elevating serum cortisol (
Figure 3) and glucose and reducing plasma sodium and chloride concentrations (
Table 1;
Figure 4). These results are consistent with established knowledge that live fish transport imposes multiple interacting stressors—handling, confinement, overcrowding, and progressive water quality deterioration—that challenge physiological homeostasis and compromise welfare and performance
| [20] | APHA (2017). Standard Methods for the Examination of Water and Wastewater, 23rd ed. American Public Health Association, Washington, DC, USA. |
| [21] | Boyd, C. E. (2020). Water Quality: An Introduction. Springer, Cham, Switzerland.
https://doi.org/10.1007/978-3-030-23335-8 |
| [22] | Emerson, K., Russo, R. C., Lund, R. E., Thurston, R. V. (1975). Aqueous ammonia equilibrium calculations: effect of pH and temperature. Journal of the Fisheries Research Board of Canada, 32, 2379-2383.
https://doi.org/10.1139/f75-274 |
[20-22]
. Importantly, the study provides evidence that while oxygen supplementation moderates stress effects, it cannot fully compensate for excessive loading density, highlighting crowding as the primary constraint to safe transport of
O. variabilis under typical smallholder transport systems.
4.1. Loading Density and Oxygen Supply as Determinants of Survival During Transport
Survival patterns indicate that transport tolerance in juvenile
O. variabilis depends strongly on stocking load and secondarily on oxygen availability (
Figure 2). At 1 kg loading, survival remained 100% across all oxygen levels, suggesting that at low density fish were able to maintain respiratory and ionic balance despite confinement. However, survival declined sharply from moderate to high loading, with particularly severe losses at 7 kg (22–65%) and near-complete mortality at 9 kg (2–11%) (
Table 1;
Figure 2). This steep decline supports the principle that crowding increases stress intensity by elevating metabolic oxygen demand and accelerating deterioration of transport water quality through CO
2 accumulation and nitrogenous waste build-up
. Under high loading, fish also experience increased physical contact, restricted movement, and social stress (aggression and competition), which further increases energy expenditure and physiological strain even before oxygen becomes limiting
| [25] | Tietz, N. W., Logan, B. (1987). Clinical Guide to Laboratory Tests, 2nd ed. W. B. Saunders, Philadelphia, PA, USA. |
| [26] | Zar, J. H. (2010). Biostatistical Analysis, 5th ed. Prentice Hall, Upper Saddle River, NJ, USA. |
[25, 26]
.
Although increasing oxygen supply improved survival within most loading treatments, the benefits diminished at extreme density. For example, raising oxygen from 25% to 100% improved survival at 3 kg from 67% to 98% and at 7 kg from 22% to 65%, but even under 100% oxygen survival at 9 kg reached only 11% (
Table 1). This suggests that under extreme crowding, oxygen supplementation alone is not sufficient to prevent mortality because additional stress pathways become dominant, including CO
2 narcosis, acid–base disturbance, ammonia toxicity, and physical injury
| [20] | APHA (2017). Standard Methods for the Examination of Water and Wastewater, 23rd ed. American Public Health Association, Washington, DC, USA. |
| [22] | Emerson, K., Russo, R. C., Lund, R. E., Thurston, R. V. (1975). Aqueous ammonia equilibrium calculations: effect of pH and temperature. Journal of the Fisheries Research Board of Canada, 32, 2379-2383.
https://doi.org/10.1139/f75-274 |
| [24] | Martinez-Porchas, M., Martinez-Cordova, L. R. (2012). World aquaculture: environmental impacts and troubleshooting alternatives. The Scientific World Journal, 2012, 389623.
https://doi.org/10.1100/2012/389623 |
[20, 22, 24]
. In sealed systems, oxygen may remain relatively available due to supplementation, yet rising CO
2 reduces blood oxygen-carrying capacity and disrupts ventilation efficiency, while ammonia accumulation compromises gill function, collectively creating conditions where survival collapses regardless of oxygen enrichment. Thus, the transport failure at 9 kg implies a physiological threshold beyond which safe transport is unlikely without substantial protocol changes.
4.2. Water Quality Deterioration as a Mechanistic Driver of Transport Stress
The pronounced deterioration of water quality observed following transport provides a mechanistic explanation for the density-dependent stress responses recorded in
O. variabilis. Rapid depletion of dissolved oxygen coupled with accumulation of carbon dioxide and ammonia is characteristic of sealed-bag fish transport systems and has been widely documented as a primary driver of transport-induced mortality
. Elevated CO
2 reduces blood oxygen transport efficiency by inducing respiratory acidosis, while increasing ammonia compromises gill epithelial integrity and disrupts ion exchange processes critical for osmoregulation
| [13] | Boyd, C. E., Tucker, C. S. (2012). Pond Aquaculture Water Quality Management. Springer, New York, NY, USA.
https://doi.org/10.1007/978-1-4615-5407-3 |
| [18] | Evans, D. H., Piermarini, P. M., Choe, K. P. (2005). The multifunctional fish gill: dominant site of gas exchange, osmoregulation, acid-base regulation, and excretion of nitrogenous waste. Physiological Reviews, 85(1), 97-177.
https://doi.org/10.1152/physrev.00050.2003 |
[13, 18]
.
The observed decline in pH further exacerbates physiological stress by altering ammonia toxicity dynamics and impairing respiratory efficiency. Under such conditions, fish are forced to expend substantial energy to maintain acid–base and ionic balance, which is reflected in the elevated cortisol and glucose levels measured in the present study. Similar patterns of water quality degradation and associated stress responses have been reported in tilapia and other cultured species during high-density transport, where ammonia accumulation and CO
2 narcosis often become the dominant mortality drivers even when oxygen supplementation is applied
| [7] | Iversen, M., Finstad, B., Nilssen, K. J. (2020). Stress responses in Atlantic salmon (Salmo salar) smolts during commercial well-boat transport and effects on survival. Aquaculture, 526, 735409. https://doi.org/10.1016/j.aquaculture.2020.735409 |
| [21] | Boyd, C. E. (2020). Water Quality: An Introduction. Springer, Cham, Switzerland.
https://doi.org/10.1007/978-3-030-23335-8 |
[7, 21]
.
Collectively, these findings confirm that loading density governs the rate of environmental deterioration within transport containers, thereby setting a physiological stress threshold beyond which survival collapses regardless of oxygen enrichment. Effective transport management must therefore prioritise density control alongside oxygen supply to minimise waste accumulation and maintain acceptable water quality conditions.
4.3. Cortisol Elevation Confirms Endocrine Activation Under Combined Crowding and Hypoxia
Cortisol is the primary endocrine mediator of acute stress in teleost fish and reflects activation of the hypothalamic–pituitary–interrenal axis, which coordinates behavioural, cardiovascular and metabolic responses enabling short-term adaptation
| [25] | Tietz, N. W., Logan, B. (1987). Clinical Guide to Laboratory Tests, 2nd ed. W. B. Saunders, Philadelphia, PA, USA. |
| [26] | Zar, J. H. (2010). Biostatistical Analysis, 5th ed. Prentice Hall, Upper Saddle River, NJ, USA. |
[25, 26]
. In this study, serum cortisol increased systematically with loading density, reaching highest concentrations at 7–9 kg loading and being most pronounced under reduced oxygen conditions (
Table 1;
Figure 3). The cortisol heatmap clearly demonstrates that high loading and low oxygen produced a combined stress hotspot (
Figure 3), indicating that hypoxia amplified the crowding-induced response.
Mechanistically, this cortisol elevation reflects multi-stressor exposure: physical confinement, hypoxia-induced chemoreceptor activation, and progressive internal water chemistry stress. Under acute stress, cortisol mobilises energy reserves by stimulating gluconeogenesis and glycogenolysis, alters cardiovascular function to prioritise oxygen delivery, and modulates ion transport processes at the gills
| [31] | Burtis, C. A., Bruns, D. E., Sawyer, B. G., & Ashwood, E. R. (2018). Tietz Textbook of Clinical Chemistry and Molecular Diagnostics (6th ed.). Elsevier, St. Louis, MO, USA.
https://doi.org/10.1016/C2015-0-00119-2 |
| [32] | Sokal, R. R., & Rohlf, F. J. (2012). Biometry: The Principles and Practice of Statistics in Biological Research (4th ed.). W. H. Freeman & Company, New York, NY, USA. |
[31, 32]
. The observed decrease in cortisol with increasing oxygen within each loading category indicates that oxygen supplementation reduced stress severity by improving respiratory stability and preventing rapid progression into severe hypoxemia. This aligns with transport physiology literature showing that maintaining oxygen availability reduces cortisol elevation and improves survival outcomes, especially in densely stocked transport systems
. However, cortisol remained elevated even at high oxygen under extreme loading (9 kg), indicating that the stress response was not driven by oxygen limitation alone but by the broader transport stress complex.
4.4. Metabolic Mobilisation: Glucose Increase as a Downstream Stress Outcome
Blood glucose is a key secondary indicator of acute transport stress and typically increases following cortisol elevation due to mobilisation of energy substrates needed to cope with stress demands
| [31] | Burtis, C. A., Bruns, D. E., Sawyer, B. G., & Ashwood, E. R. (2018). Tietz Textbook of Clinical Chemistry and Molecular Diagnostics (6th ed.). Elsevier, St. Louis, MO, USA.
https://doi.org/10.1016/C2015-0-00119-2 |
| [32] | Sokal, R. R., & Rohlf, F. J. (2012). Biometry: The Principles and Practice of Statistics in Biological Research (4th ed.). W. H. Freeman & Company, New York, NY, USA. |
[31, 32]
. In the present study, glucose concentrations increased with loading density and decreased with increasing oxygen supply (
Table 1), mirroring the cortisol trend. This pattern suggests that metabolic disturbance escalated as transport conditions became more stressful, consistent with the concept of a graded stress response where endocrine activation precedes metabolic mobilisation. Elevated glucose under high loading likely reflects increased energy requirements for sustained ventilation, swimming attempts, and maintenance of physiological homeostasis under deteriorating water quality conditions.
Under such conditions, fish may transition partly to anaerobic metabolism, leading to lactate accumulation and further acid–base imbalance, contributing to fatigue and mortality
| [20] | APHA (2017). Standard Methods for the Examination of Water and Wastewater, 23rd ed. American Public Health Association, Washington, DC, USA. |
| [21] | Boyd, C. E. (2020). Water Quality: An Introduction. Springer, Cham, Switzerland.
https://doi.org/10.1007/978-3-030-23335-8 |
[20, 21]
. Thus, glucose elevation provides metabolic confirmation of the stress gradient observed in survival and cortisol responses.
4.5. Ionoregulatory Disruption: Sodium and Chloride Depletion Indicates Gill Dysfunction and Osmotic Imbalance
A major strength of this study is the inclusion of plasma sodium and chloride as indicators of osmoregulatory stress. Transport induced significant reductions in plasma Na
+ and Cl
- concentrations compared with baseline values, and the magnitude of depletion increased with loading density while being partially alleviated by oxygen supplementation (
Table 1;
Figure 4). These changes reflect transport-induced impairment of gill function and ionoregulatory capacity, triggered by hypoxia, elevated CO
2, increased ammonia, and physical abrasion under crowding
| [18] | Evans, D. H., Piermarini, P. M., Choe, K. P. (2005). The multifunctional fish gill: dominant site of gas exchange, osmoregulation, acid-base regulation, and excretion of nitrogenous waste. Physiological Reviews, 85(1), 97-177.
https://doi.org/10.1152/physrev.00050.2003 |
| [19] | Hwang, P. P., Lin, L. Y. (2013). Gill ion transport, acid-base regulation, and ammonia excretion. In: Evans, D. H., Claiborne, J. B. (Eds.), The Physiology of Fishes, 4th ed. CRC Press, Boca Raton, FL, USA, pp. 205-233. |
| [24] | Martinez-Porchas, M., Martinez-Cordova, L. R. (2012). World aquaculture: environmental impacts and troubleshooting alternatives. The Scientific World Journal, 2012, 389623.
https://doi.org/10.1100/2012/389623 |
[18, 19, 24]
. In teleost fish, the gills are not only the primary site for gas exchange but also for ion uptake and acid–base regulation, and stress-related disruption of branchial transporters can lead to rapid electrolyte imbalance
| [18] | Evans, D. H., Piermarini, P. M., Choe, K. P. (2005). The multifunctional fish gill: dominant site of gas exchange, osmoregulation, acid-base regulation, and excretion of nitrogenous waste. Physiological Reviews, 85(1), 97-177.
https://doi.org/10.1152/physrev.00050.2003 |
[18]
.
The sodium heatmap highlights a pronounced decline at high loading and low oxygen (
Figure 4), suggesting that combined hypoxia and density stress strongly impaired active ion uptake. Additionally, rising CO
2 in sealed bags causes respiratory acidosis, forcing fish to engage in acid–base compensation through ion exchange mechanisms that further disrupt sodium and chloride balance
| [18] | Evans, D. H., Piermarini, P. M., Choe, K. P. (2005). The multifunctional fish gill: dominant site of gas exchange, osmoregulation, acid-base regulation, and excretion of nitrogenous waste. Physiological Reviews, 85(1), 97-177.
https://doi.org/10.1152/physrev.00050.2003 |
| [19] | Hwang, P. P., Lin, L. Y. (2013). Gill ion transport, acid-base regulation, and ammonia excretion. In: Evans, D. H., Claiborne, J. B. (Eds.), The Physiology of Fishes, 4th ed. CRC Press, Boca Raton, FL, USA, pp. 205-233. |
[18, 19]
.
Importantly, ion imbalance can directly increase mortality risk by impairing cardiac function, neuromuscular activity and overall osmotic stability, thereby providing a physiological basis for the strong survival declines observed at 7–9 kg loading (
Figure 2).
4.6. Integrated Interpretation: A Density–Oxygen Stress Threshold in Sealed-Bag Transport of O. variabilis
Survival (
Figure 2), cortisol (
Figure 3), glucose (
Table 1), and sodium/chloride disturbances (
Figure 4;
Table 1) reveal a coherent stress progression. The pattern suggests a transport stress threshold where combined stressors shift from manageable to catastrophic. In practical terms, this threshold appears to lie between 5 kg and 7 kg loading weight per 10 L transport bag for juveniles of ~20 g under 2-hour transit conditions. Beyond this threshold, oxygen supplementation yields diminishing returns because other stressors dominate. This aligns with live fish transport studies in other species, where safe transport depends on balancing density, oxygenation, temperature control and waste management rather than relying on oxygen alone
| [21] | Boyd, C. E. (2020). Water Quality: An Introduction. Springer, Cham, Switzerland.
https://doi.org/10.1007/978-3-030-23335-8 |
| [22] | Emerson, K., Russo, R. C., Lund, R. E., Thurston, R. V. (1975). Aqueous ammonia equilibrium calculations: effect of pH and temperature. Journal of the Fisheries Research Board of Canada, 32, 2379-2383.
https://doi.org/10.1139/f75-274 |
[21, 22]
.
4.7. Implications for Aquaculture Transport Management in Kenya
The results have direct implications for Kenya’s smallholder systems where sealed-bag transport is common. Given the steep mortality increase at ≥7 kg loading, farmers should adopt conservative loading limits. Oxygen supplementation remains valuable at moderate loads, but should be combined with appropriate loading limits and temperature control. From a welfare and biosecurity perspective, reducing stress is also essential because stress predisposes fish to disease through immunosuppression and vulnerability to opportunistic pathogens
| [25] | Tietz, N. W., Logan, B. (1987). Clinical Guide to Laboratory Tests, 2nd ed. W. B. Saunders, Philadelphia, PA, USA. |
| [26] | Zar, J. H. (2010). Biostatistical Analysis, 5th ed. Prentice Hall, Upper Saddle River, NJ, USA. |
[25, 26]
.
4.8. Study Limitations and Future Research Needs
Although key water quality parameters including dissolved oxygen, temperature, pH, ammonia and carbon dioxide were quantified before and after transportation, continuous monitoring during transit was not conducted due to logistical constraints associated with sealed-bag transport under field conditions. Consequently, the precise temporal dynamics of water quality deterioration could not be captured. Future studies should incorporate real-time or interval-based water chemistry measurements to characterise rates of oxygen depletion and waste accumulation under varying loading densities.
In addition, survival was assessed immediately upon arrival, and delayed mortality associated with physiological exhaustion, osmoregulatory failure and secondary stress responses may have been underestimated. Incorporating post-transport recovery observation periods (24–72 h) would provide a more comprehensive evaluation of transport tolerance. Further research should also explore additional stress biomarkers such as blood lactate, oxidative stress indices and immune parameters to deepen mechanistic understanding of transport-induced physiological disturbance and resilience in tilapia species.