1. Introduction
Proton exchange membrane (PEM) fuel cells are devices that directly convert the chemical energy of fuel into electricity using an electrochemical process
| [1] | Springer, T. E., Zawodzinski, T. A., & Gottesfeld, S. (1991). Polymer electrolyte fuel cell model. Journal of the electrochemical society, 138(8), 2334.
https://doi.org/10.1149/1.2085971 |
[1]
. PEMFC fuel cells use dihydrogen to generate electricity. Ahmad et al. (2024)
| [2] | Ahmad, S., Ullah, A., Samreen, A., Qasim, M., Nawaz, K., Ahmad, W.,... & Egilmez, M. (2024). Hydrogen production, storage, transportation and utilization for energy sector: A current status review. Journal of Energy Storage, 101, 113733.
https://doi.org/10.1016/j.est.2024.113733 |
[2]
examined the potential of green hydrogen as a solution to the climate crisis. They showed that green hydrogen technology will dominate the sector, not only because of its zero-carbon potential, but above all because of government commitments to achieve carbon neutrality by 2050. Alaswad et al. 2020
| [3] | Alaswad, A., Omran, A., Sodre, J. R., Wilberforce, T., Pignatelli, G., Dassisti, M., Baroutaji, A., & Olabi, A. G. (2021). Technical and Commercial Challenges of Proton-Exchange Membrane (PEM) Fuel Cells. Energies, 14(1), 144.
https://doi.org/10.3390/en14010144 |
[3]
showed that PEM fuel cells are a promising alternative energy source for portable, automotive and stationary applications due to their relatively low operating temperature (60-80°C), high efficiency (40-60%) and high-power density (0.5-1.0) W/cm², comparable to that of existing internal combustion technology
| [3] | Alaswad, A., Omran, A., Sodre, J. R., Wilberforce, T., Pignatelli, G., Dassisti, M., Baroutaji, A., & Olabi, A. G. (2021). Technical and Commercial Challenges of Proton-Exchange Membrane (PEM) Fuel Cells. Energies, 14(1), 144.
https://doi.org/10.3390/en14010144 |
[3]
. PEM fuel cells have attracted the attention of the automotive industry as candidates for power generation applications with a lower environmental impact
| [4] | Yang, D., Tan, Y., Li, B., Ming, P., Xiao, Q., & Zhang, C. (2022). A Review of the Transition Region of Membrane Electrode Assembly of Proton Exchange Membrane Fuel Cells: Design, Degradation, and Mitigation. Membranes, 12(3), 306.
https://doi.org/10.3390/membranes12030306 |
[4]
. Several parameters, such as entropy, contribute to improving the chemical stability of materials that conduct protons for fuel cell operation. This is the case with Ullah et al. 2023
| [5] | Ullah, A., Hussain, B., Youn, Y., Bae, H. B., Hong, J. E., Joh, D. W.,... & Kim, H. S. (2023). A multicomponent equimolar proton-conducting quadruple hexagonal perovskite-related oxide system. Dalton Transactions, 52(7), 1885-1894.
https://doi.org/10.1039/D2DT02897B |
[5]
., who synthesized for the first time a new type of multicomponent proton-conducting oxide with a hexagonal perovskite structure capable of integrating up to eight different rare earth elements. They demonstrated that increasing the configurational entropy significantly improves the chemical stability of the material against CO
2, without degrading its proton conductivity. This work broadens the field of crystal structures compatible with the “high entropy” approach and paves the way for the systematic study of the link between entropy, conductivity, and chemical stability. On the other handThe, GDL consisting of a porous microfibrous substrate combined with a micro-nanoporous layer, improves gas distribution
| [6] | Yang, W., Zhu, L., Wang, S., Yin, Z., Xiao, L., Shao, Q.,... & Sui, P. C. (2022). Investigation of fabrication of gas diffusion substrate for proton exchange membrane fuel cells. International Journal of Hydrogen Energy, 47(83), 35423-35436. https://doi.org/10.1016/j.ijhydene.2022.08.094 |
[6]
. GDLs are made from porous materials that have good electrical conductivity and an anisotropic porous microstructure
| [6] | Yang, W., Zhu, L., Wang, S., Yin, Z., Xiao, L., Shao, Q.,... & Sui, P. C. (2022). Investigation of fabrication of gas diffusion substrate for proton exchange membrane fuel cells. International Journal of Hydrogen Energy, 47(83), 35423-35436. https://doi.org/10.1016/j.ijhydene.2022.08.094 |
| [7] | Xiao, L., Bian, M., Zhu, L., Duan, K., Leng, W., Zeis, R.,... & Zhang, H. (2022). High-density and low-density gas diffusion layers for proton exchange membrane fuel cells: Comparison of mechanical and transport properties. International Journal of Hydrogen Energy, 47(53), 22532-22544.
https://doi.org/10.1016/j.ijhydene.2022.05.092 |
[6, 7]
. Its main function is to efficiently remove water from fuel cells during operation
| [8] | Santamaria, A. D., Das, P. K., MacDonald, J. C., & Weber, A. Z. (2014). Liquid-water interactions with gas-diffusion-layer surfaces. Journal of The Electrochemical Society, 161(12), F1184. https://doi.org/10.1149/2.0321412jes |
[8]
. It also facilitates the diffusion of reactants and the removal of reaction products while ensuring uniform current distribution
| [9] | Zhang, H., Rahman, M. A., Mojica, F., Sui, P. C., & Chuang, P. Y. A. (2021). A comprehensive two-phase proton exchange membrane fuel cell model coupled with anisotropic properties and mechanical deformation of the gas diffusion layer. Electrochimica acta, 382, 138273.
https://doi.org/10.1016/j.electacta.2021.138273 |
| [10] | Ozden, A., Shahgaldi, S., Li, X., & Hamdullahpur, F. (2019). A review of gas diffusion layers for proton exchange membrane fuel cells—With a focus on characteristics, characterization techniques, materials and designs. Progress in Energy and Combustion Science, 74, 50-102.
https://doi.org/10.1016/j.pecs.2019.05.002 |
[9, 10]
. Due to its fibrous structure, GDL material has high anisotropy, which differentiates the transport of gas species, electrons and heat, as well as water
| [9] | Zhang, H., Rahman, M. A., Mojica, F., Sui, P. C., & Chuang, P. Y. A. (2021). A comprehensive two-phase proton exchange membrane fuel cell model coupled with anisotropic properties and mechanical deformation of the gas diffusion layer. Electrochimica acta, 382, 138273.
https://doi.org/10.1016/j.electacta.2021.138273 |
| [11] | Majlan, E. H., Rohendi, D., Daud, W. R. W., Husaini, T., & Haque, M. A. (2018). Electrode for proton exchange membrane fuel cells: A review. Renewable and Sustainable Energy Reviews, 89, 117-134.
https://doi.org/10.1016/j.rser.2018.03.007 |
[9, 11]
. Nabovat et. (2014)
| [12] | Nabovati, A., Hinebaugh, J., Bazylak, A., & Amon, C. H. (2014). Effect of porosity heterogeneity on the permeability and tortuosity of gas diffusion layers in polymer electrolyte membrane fuel cells. Journal of Power Sources, 248, 83-90. https://doi.org/10.1016/j.jpowsour.2013.09.061 |
[12]
have shown that tortuosity affects the path of protons in the catalytic layer and electrons in the carbon fibres of the GDL. Due to the many difficulties associated with observing and measuring the movement and distribution of species within a PEM fuel cell, numerical modelling and simulations have become indispensable tools
| [13] | Reshetenko, T., & Ben, B. L. (2021). Impact of a gas diffusion layer's structural and textural properties on oxygen mass transport resistance in the cathode and performance of proton exchange membrane fuel cells. Electrochimica acta, 371, 137752. https://doi.org/10.1016/j.electacta.2021.137752 |
| [14] | Dokkar, B., Settou, N. E., Imine, O., Saifi, N., Negrou, B., & Nemouchi, Z. (2011). Simulation of species transport and water management in PEM fuel cells. international journal of hydrogen energy, 36(6), 4220-4227.
https://doi.org/10.1016/j.ijhydene.2010.09.060 |
[13, 14]
. Software such as COMSOL Multiphysics are powerful tools for studying the effects of tortuosity on PEM fuel cell performance in numerical modelling
| [15] | Secanell, M., Jarauta, A., Kosakian, A., Sabharwal, M., & Zhou, J. (2017). PEM fuel cells, modeling. In Encyclopedia of Sustainability Science and Technology. Springer, New York, NY, (pp. 1-61).
https://doi.org/10.1007/978-1-4939-7789-5_1019 |
[15]
. These models enable accurate simulation of transport and reaction processes in GDLs, providing valuable information for optimising their structure. Experimental studies have demonstrated the significant effect of GDL structural parameters and material characteristics on species transport
| [16] | Molaeimanesh, G. R., & Nazemian, M. (2017). Investigation of GDL compression effects on the performance of a PEM fuel cell cathode by lattice Boltzmann method. Journal of Power Sources, 359, 494-506.
https://doi.org/10.1016/j.jpowsour.2017.05.078 |
[16]
. GDL tortuosity describes the complexity of the path that gas molecules must take through the porous structure and has a direct impact on the transport of reactive species
| [17] | Tayarani-Yoosefabadi, Z., Harvey, D., Bellerive, J., & Kjeang, E. (2016). Stochastic microstructural modeling of fuel cell gas diffusion layers and numerical determination of transport properties in different liquid water saturation levels. Journal of Power Sources, 303, 208-221.
https://doi.org/10.1016/j.jpowsour.2015.11.005 |
| [18] | Cindrella, L., Kannan, A. M., Lin, J. F., Saminathan, K., Ho, Y., Lin, C. W., & Wertz, J. (2009). Gas diffusion layer for proton exchange membrane fuel cells—A review. Journal of Power Sources, 194(1), 146-160.
https://doi.org/10.1016/j.jpowsour.2009.04.005 |
| [19] | Arvay, A., Yli-Rantala, E., Liu, C. H., Peng, X. H., Koski, P., Cindrella, L.,... & Kannan, A. M. (2012). Characterization techniques for gas diffusion layers for proton exchange membrane fuel cells–A review. Journal of Power Sources, 213, 317-337. https://doi.org/10.1016/j.jpowsour.2012.04.026 |
[17-19]
.
Yu et al. 2012
| [20] | Yu, Z., Carter, R. N., & Zhang, J. (2012). Measurements of pore size distribution, porosity, effective oxygen diffusivity, and tortuosity of PEM fuel cell electrodes. Fuel Cells, 12(4), 557-565. https://doi.org/10.1002/fuce.201200017 |
[20]
have shown that high tortuosity can lead to increased transport resistances, limiting the diffusion of reactants to active sites and the removal of generated water, while too low tortuosity can compromise water management in the cell. Wang and al. (2017); Zhao and all. (2018); Jing and all. (2024)
| [21] | Wang, Y., & Wang, S. (2017). Evaluation and modeling of PEM fuel cells with the Bruggeman correlation under various tortuosity factors. International Journal of Heat and Mass Transfer, 105, 18-23.
https://doi.org/10.1016/j.ijheatmasstransfer.2016.09.030 |
| [22] | Zhao, J., Shahgaldi, S., Alaefour, I., Yang, S., & Li, X. (2018). Pore structure and effective diffusion coefficient of catalyzed electrodes in polymer electrolyte membrane fuel cells. International Journal of Hydrogen Energy, 43(7), 3776-3785. https://doi.org/10.1016/j.ijhydene.2018.01.019 |
| [23] | Jing, S. Y., Sun, Z. Y., Yang, L., & Wang, Y. (2024). Effects of porosity and porosity distribution in gas diffusion layer on the performances of proton exchange membrane fuel cell. Journal of Power Sources, 613, 234957.
https://doi.org/10.1016/j.jpowsour.2024.234957 |
[21-23]
have shown that tortuosity affects the diffusion of reactants such as oxygen and hydrogen, which has an impact on cell efficiency. In the case of anisotropic tortuosity, i.e. tortuosity that varies depending on the direction in the GDL, this can influence the directional distribution and transport efficiency of species (oxygen, hydrogen, water)
| [24] | Ramaswamy, N., Gu, W., Ziegelbauer, J. M., & Kumaraguru, S. (2020). Carbon support microstructure impact on high current density transport resistances in PEMFC cathode. Journal of The Electrochemical Society, 167(6), 064515.
https://doi.org/10.1149/1945-7111/ab819c |
[24]
. This means that the performance of PEM fuel cells can be better or worse depending on the orientation of the GDL relative to the gas flow. Anisotropy induced by tortuosity can lead to differences in gas diffusion, affecting the distribution of reactants on the catalytic surface
| [25] | Pant, L. M., Mitra, S. K., & Secanell, M. (2011, January). Mass transport measurements in porous transport layers of a PEM fuel cell. In International Conference on Nanochannels, Microchannels, and Minichannels (Vol. 44632, pp. 257-262).
https://doi.org/10.1115/ICNMM2011-58181 |
| [26] | Niblett, D., Niasar, V., & Holmes, S. (2019). Enhancing the performance of fuel cell gas diffusion layers using ordered microstructural design. Journal of The Electrochemical Society, 167(1), 013520. https://doi.org/10.1149/2.0202001JES |
[25, 26]
. This leads to areas that are underfed with oxygen, creating ‘hot spots’ where the electrochemical reaction is less efficient. Although tortuosity is a key factor in the transport of reactive gases and reaction products, previous work has often neglected it or modelled it in a simplified manner
| [11] | Majlan, E. H., Rohendi, D., Daud, W. R. W., Husaini, T., & Haque, M. A. (2018). Electrode for proton exchange membrane fuel cells: A review. Renewable and Sustainable Energy Reviews, 89, 117-134.
https://doi.org/10.1016/j.rser.2018.03.007 |
| [27] | Lange, K. J., Sui, P. C., & Djilali, N. (2010). Pore scale simulation of transport and electrochemical reactions in reconstructed PEMFC catalyst layers. Journal of The Electrochemical Society, 157(10), B1434.
https://doi.org/10.1149/1.3478207 |
[11, 27]
. Fick's diffusion models, the Stefan-Maxwell model, convective diffusion, Boltzmann and numerical models (CFD: Computational Fluid Dynamics) are used to study the transport of gaseous species in GDLs
| [28] | Jourdani, M. (2019). Simulation numérique couplée des phénomènes thermo-fluide, électrochimique et mécanique dans une pile à combustible type PEMFC (Doctoral dissertation, Université Mohammed V-Rabat).
https://theses.hal.science/tel-02194893 |
| [29] | Błesznowski, M., Sikora, M., Kupecki, J., Makowski, Ł., & Orciuch, W. (2022). Mathematical approaches to modelling the mass transfer process in solid oxide fuel cell anode. Energy, 239, 121878. https://doi.org/10.1016/j.energy.2021.121878 |
| [30] | Andersson, M., Yuan, J., & Sundén, B. (2010). Review on modeling development for multiscale chemical reactions coupled transport phenomena in solid oxide fuel cells. Applied Energy, 87(5), 1461-1476.
https://doi.org/10.1016/j.apenergy.2009.11.013 |
[28-30]
. This study aims to model the behaviour of PEM fuel cells by analysing the impact of the GDL microstructure on performance, including mass transport losses (via Maxwell-Stefan equations for gaseous reactants: H₂, O₂, H₂O, N₂); pressure losses (via Darcy's generalised law governing gas flows) and the essential role of tortuosity (τ) in these phenomena. We are therefore primarily studying the impact of tortuosity on species transport within the gas diffusion layers (GDL) of a proton exchange membrane fuel cell. The study explores the influence of GDL tortuosity on PEM fuel cell performance.
2. Materials and Methods
2.1. PEMFC Prototype Serving as Voltage and Current Measurements
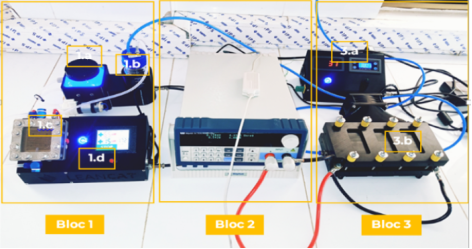
Figure 1 shows a 50-watt fuel cell device as hardware. It consists of three main compartments. Block 1 is the electrolysis compartment, block 2 is the electronics compartment, and block 3 is the fuel cell compartment.
As shown in this figure, the demineralized water contained in the tank is sent to the proton exchange membrane electrolyzer using a pump. This produces a reaction that breaks down the water into oxygen and protons at the electrodes (anode and cathode). Then, thanks to the current flowing through the bipolar titanium plates, the protons pass through the solid membrane made of Nafion 115 and converge towards the cathode. The oxygen obtained and the excess water are returned to the water tank. The second reaction occurs at the cathode. Two electrons flow through the bipolar plate and recombine with two H+ protons that exit the membrane. Finally, hydrogen and water are obtained in a mixture. The mixture then converges towards the gas separator, where the hydrogen is separated from the water. The electrons generate current flowing through the bipolar plates. These plates distribute the gases evenly across the electrodes and separate the gases between the anode and cathode. The protons then pass through the solid membrane. The final reaction inside the fuel cell occurs at the iridium cathode, where oxygen from the air recombines with electrons and protons to produce water vapor through an exothermic reaction according to the following equations:
Cathode:heat(2)
Figure 1. Voltage and current measuring equipment.
2.2. Description of the Model
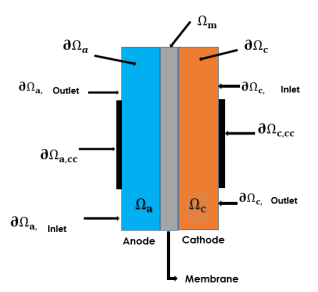
The modelled section of the fuel cell is composed of three main parts: (a) an anode (Ωa), (b) a proton exchange membrane (Ωm) and (c) a cathode (Ωc) as shown in
Figure 2. In that figure, the electrodes are in contact with a gas distributor, which has an inlet channel (∂Ωa, inlet), a current collector (∂Ωa, cc) and an outlet channel (∂Ωa, outlet).
The feed gases (humidified hydrogen and humidified air) are treated as ideal gases and are transported by diffusion and convection. The electrodes are treated as homogeneous porous media with uniform morphological properties such as porosity and permeability. The gas inside each electrode exists as a continuous phase, so Darcy's law applies. An agglomerate model describes the electrode reactions in the active catalyst layers. The agglomerates are composed of catalyst particles and carbon embedded in a polymer electrolyte. The equations for the agglomerate model are derived from the analytical solution of a diffusion-reaction problem in a spherical porous particle. The different models used in the simulation are presented below:
2.3. Equations for Gas Diffusion Layers (GDL)
2.3.1. Conservation of Mass and Equation of Momentum: Darcy's Law
The modelling of gas flows is based on Darcy's law in the interface of the PEM fuel cell, where the gas velocity is given by the continuity equation
:
in and with and
is the electrode permeability (m2), ղ is the gas viscosity (Pa.s), p is the pressure (Pa), R is the gas constant (J/mol.K), T is the temperature (K), M is the molar mass (kg/mol), and is the molar fraction. At the inputs, we have:
(4)
At the thin electrode gas diffusion boundary for the anode and cathode, the gas velocity is automatically calculated by the hydrogen fuel cell interface from the total mass flow given by the electrochemical reaction rate and the stoichiometric coefficients using Faraday's law.
2.3.2. Charge Equilibrium
The hydrogen fuel cell interface is used to model the potential distributions in the three domains, which local current density expressions, for the anode and cathode are given by the following equation
| [32] | Ressam, I., Lahcini, M., Belen Jorge, A., Perrot, H., & Sel, O. (2017). Correlation between the proton conductivity and diffusion coefficient of sulfonic acid functionalized chitosan and Nafion composites via impedance spectroscopy measurements. Ionics, 23(8), 2221-2227.
https://doi.org/10.1007/s11581-017-2151-5 |
[32]
:
Where the subscript e represents « a » (anode) or «c» (cathode), is the radius of the agglomerate in m and and (in A/m3) are the current densities given by the agglomerate model, is porosity (the macroscopic porosity) The specific surface area of the fine gas diffusion electrode (in 1/m) can be calculated by the following formula:
2.3.3. Charge Transport
In electrodes and conductive GDL, electrons move according to Ohm's law:
where:
is electron current density [A/m2]
is electrical conductivity of the solid [S/m]
is electrical potential in the solid phase [V]
2.3.4. Anode and Cathode Agglomeration Model
The agglomerate model describes the current density in an active layer made up of agglomerates of ionic conductive material and electric conductive particles partially coated with catalyst. The resulting equations for the current density in the anode and cathode are given by the following formula
| [28] | Jourdani, M. (2019). Simulation numérique couplée des phénomènes thermo-fluide, électrochimique et mécanique dans une pile à combustible type PEMFC (Doctoral dissertation, Université Mohammed V-Rabat).
https://theses.hal.science/tel-02194893 |
[28]
:
(8)
(9)
(10)
In these equations, is the gas diffusivity of the sinter (m2/s), is the number of «charge transfers» (1 for the anode and -2 for the cathode), S is the specific surface area of the catalyst inside the sinter (1/m), and F is the Faraday constant (C/mol), the are the reference concentrations of the species (mol/m3), are the corresponding concentrations in the surface of the cluster (mol/m3), are the exchange current densities (A/m2), R is the gas constant, T is the temperature (K), and the overvoltage’s at the anode and cathode are given by the following formula where represents the equilibrium voltage:
(11)
The concentrations of hydrogen and oxygen dissolved at the surface of the agglomerates are related to the molar fractions of the respective species in the gas phase by Henry's law, where
K is Henry's constant (Pa.m
3/mol)
| [33] | Hinaje, M., Nguyen, D. A., Bonnet, C., Lapicque, F., Raël, S., & Davat, B. (2011). 2D modeling of a defective PEMFC. International journal of hydrogen energy, 36(17), 10884-10890.
https://doi.org/10.1016/j.ijhydene.2011.05.146 |
[33]
:
(12)
The boundary conditions for the charge equilibrium potential are:
();cathode()(13)
2.3.5. Maxwell-Stefan Mass Transport
The model takes into account two species at the anode H
2 and H
2O and three at the cathode O
2, H
2O and N
2. The interface of the PEM fuel cell uses Maxwell-Stefan multi-component diffusion governed by the equations
| [34] | Jung, J. H., Ahmed, S., & Enjeti, P. (2010). PEM fuel cell stack model development for real-time simulation applications. IEEE Transactions on Industrial Electronics, 58(9), 4217-4231. https://doi.org/10.1109/TIE.2010.2098365 |
[34]
:
(14)
To solve (
13) for mass fractions
, this PEM fuel cell model assumes that temperature-induced diffusion is insignificant and sets the source term
R to zero. The binary Maxwell-Stefan diffusion coefficients,
(
m2/s), are calculated automatically by the interface.
In porous GDLs, the effective binary diffusion coefficients, must be taken into account using a diffusivity correction for porous media based on porosity and tortuosity which defines the binary diffusion coefficient according to the relationship:
Here, tortuosity is defined as a tensor in the form of a 2 x 2 diagonal matrix according to the formula:
In steady state, all temporal variations disappear:
(18)
This simplified form is used to model gas transport in porous GDLs. The mole fractions of the feed gas are reported at the inputs. At the boundaries of the fine gas diffusion electrodes, the mass fluxes of the species are automatically determined from the electrochemical reaction rate and the stoichiometric coefficients, using Faraday's law. Contributions to the Stefan velocity are also automatically calculated by the interface. The membrane transport functionalities of the hydrogen fuel cell interface are used to model the transport of water in the ionomer phase in the membrane domain.
2.3.6. Mass and Charge Transport Equations for the Fuel Cell Membrane
Water transport in the membrane of a PEMFC cell is governed by two main mechanisms: diffusive transport due to water concentration gradients in the membrane, and electro-osmotic transport induced by hydrated protons (H3O+) crossing the membrane from the anode to the cathode. The average number of water molecules transported per proton, denoted nd, is called the electro-osmotic entrainment coefficient. The molar flux density of water transported in the membrane is then given by the following equation:
(19)
where:
is the electrical potential in the membrane [V]
is the ionic conductivity of the membrane []
F is Faraday's constant, []
is the diffusion coefficient of water in the membrane []
is the molar concentration of water in the membrane []
The flow of ionic charges in the membrane follows the local Ohm's law:
2.3.7. Electrochemical Model
The reaction layers are the areas where electrochemical reactions take place. Due to the sintering process, a fraction of the catalyst can partially penetrate the membrane. Since these layers are much thinner than the other components of the cell (such as the channels, gas diffusion layers, and membrane), they are generally treated as interfaces or boundary conditions in mathematical models. To determine the local distribution of current density on the catalytic surface, the Butler-Volmer kinetic equation is applied in both static and dynamic approaches. At very low current densities, this equation correctly reproduces the cell voltage.
(21)
(22)
Where j is local current density; is reference exchange current density; α is charge transfer coefficient; C is concentration of reactive species; is activation overpotential; R is ideal gas constant; F is Faraday constant.
2.3.8. Boundary Conditions
Boundary conditions are defined on all external boundaries of the calculation domain in order to describe the behaviour of the fluid and chemical species.
At the channel inlet, a Dirichlet condition is applied: it directly sets the values of the main variables, such as velocity, pressure and species concentrations. This means that the characteristics of the gas mixture are known at the inlet.
At the outlet of the channels, a Neumann condition is used. This assumes that the velocity, pressure and concentration gradients in the direction of flow are zero. In other words, the variables no longer vary when they leave the domain, which corresponds to a free outlet of the fluid.
Finally, on the channel walls and at the ends of the MEA, the conditions applied to pressure, velocities and concentrations are also Neumann-type. This reflects the absence of material flow and pressure variation across these surfaces, which are considered impermeable.
The table below provides information on the boundary conditions used in this study.
Table 1. Conditions at the Anode Boundaries.
Conditions at the Anode Boundaries |
Velocity Field (Described by Darcy's Law) | |
Mass transit | ; |
Freight transport | |
Table 2. Boundary conditions at the membrane.
Boundary conditions at the membrane |
Velocity Field (Described by Darcy's Law) | - |
Mass transit | - |
Freight transport | |
Table 3. Conditions at the Cathode Boundaries.
Conditions at the Cathode Boundaries |
Velocity Field (Described by Darcy's Law) | |
Mass transit | =0; =0; |
Freight transport | |
3. Results and Discussion
3.1. Impacts of Tortuosity in Gas Species Diffusion Gradients on the Degradation and Durability of PEMFC Fuel Cells
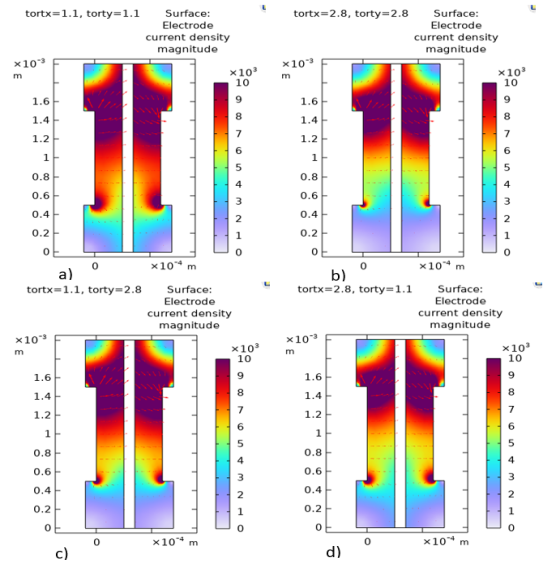
Figure 3 illustrates the impact of tortuosity configurations on current density in the porous medium of the PEM fuel cell. Four cases are examined according to the x and y directions, namely low isotropic tortuosity (tortx=1.1, torty=1.1) and high tortuosity (tortx=2.8, torty=2.8) and anisotropic cases (tortx=1.1, torty=2.8) and (tortx=2.8, torty=1.1). After analysis, it was found that low tortuosity produces a uniform current density, while high tortuosity (2.8, 2.8) results in a non-uniform distribution with localised reductions due to impeded transport of reactants. In anisotropic cases, the case (tortx=1.1, torty=2.8) facilitates transport along x but hinders it along y, resulting in a higher current density along x. The inverse asymmetry occurs for (tortx=2.8, torty=1.1), with easier transport along y.
Figure 3. Effect of GDL Tortuosity on Current Density Distribution in the x- and y- Directions: a) tortx=1.1, torty=1.1; b) tortx=2.8, torty=2.8; c) tortx=1.1, torty=2.8; d) tortx=2.8, torty=1.1.
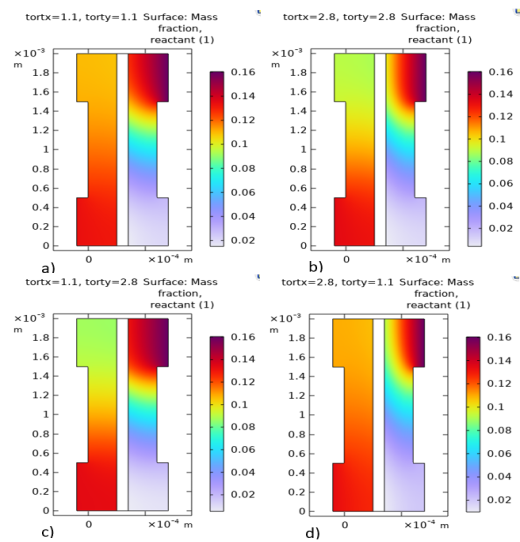
Figure 4 presents the impact of tortuosity on the mass fractions of reactants (H
2 at the anode and O
2 at the cathode) in the PEM fuel cell. The previous four different configurations are compared. In the case of low tortuosity (tortx=1.1, torty=1.1), the mass fractions of the reactants are high and uniformly distributed, indicating efficient gas transport. In contrast, when tortuosity is higher (tortx=2.8, torty=2.8), the overall mass fractions decrease, leading to increased resistance to gas transport in both directions.
For anisotropic tortuosity, an asymmetry in the distribution is observed. This results in a significant reduction in the mass fractions along the x- and y-directions in the cases of (tortx=1.1, torty=2.8) and (tortx=2.8, torty=1.1), respectively. Thus, reactants are less accessible under anisotropic tortuosity, leading to increased concentration gradients. This phenomenon can cause a local decrease in the mass fraction of reactants, particularly in regions where tortuosity is highest.
Figure 4. Effect of GDL Tortuosity on Reactant Mass Fractions Distribution in the x- and y- Directions: a) tortx=1.1, torty=1.1; b) tortx=2.8, torty=2.8; c) tortx=1.1, torty=2.8; d) tortx=2.8, torty=1.1.
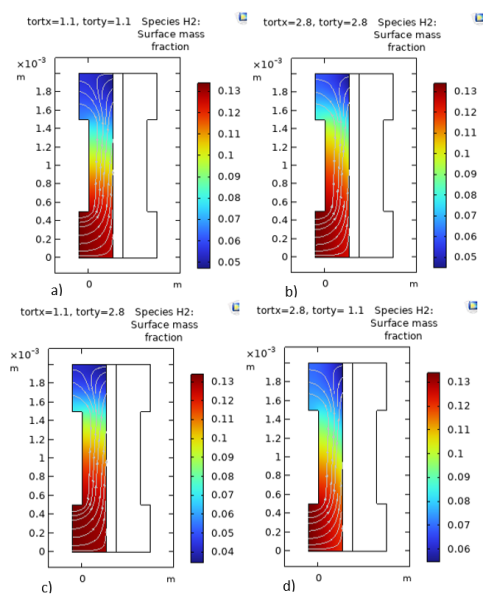
Figure 5. Effect of GDL Tortuosity on Hydrogen Mass Fraction Distribution in the x- and y- Directions: a) tortx=1.1, torty=1.1; b) tortx=2.8, torty=2.8; c) tortx=1.1, torty=2.8; d) tortx=2.8, torty=1.1.
Figure 5 illustrates the influence of tortuosity on the hydrogen mass fraction.
This figure shows that in the cases of isotropic tortuosity (tortx=1.1, torty=1.1) and (tortx=2.8, torty=2.8), the tortuosity is low and high respectively in the x and y directions. In the case (tortx=1.1, torty=1.1), hydrogen diffuses easily through the GDL while in the case (tortx=2.8, torty=2.8), hydrogen encounters strong transport resistance in both directions, which significantly reduces the mass fraction near the membrane. In the case of anisotropic tortuosity, i.e. (tortx=1.1, torty=2.8) and (tortx=2.8, torty=1.1), there is an asymmetric distribution of the mass fraction with under-utilised zones in the direction of high tortuosity.
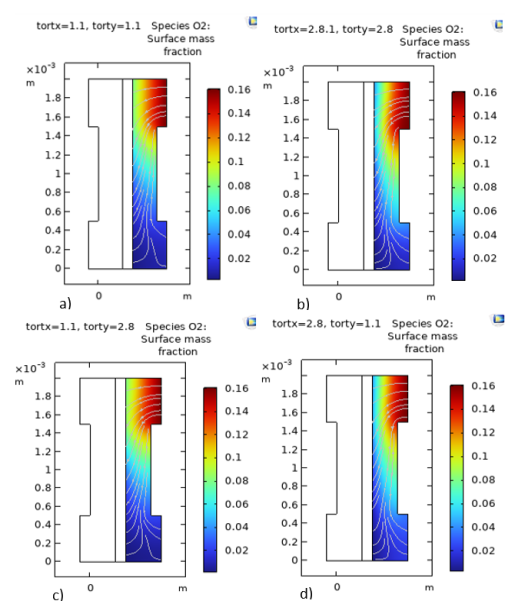
Figure 6 shows the influence of tortuosity on the oxygen mass fraction.
As in the case of the study of the influence of tortuosity on the hydrogen mass fraction, similar results are obtained for the influence of tortuosity on the oxygen mass fraction. Indeed, low tortuosity, i.e. (tortx=1.1, torty=1.1), after analysis is ideal for a uniform and high distribution of the oxygen mass fraction, which maximises the performance of the cell. Anisotropic tortuosity (tortx=1.1, torty=2.8) or (tortx=2.8, torty=1.1) also results in an asymmetric mass fraction distribution, with under-utilised areas in the direction of high tortuosity. Analysis of the figure also shows that high tortuosity (tortx=2.8, torty=2.8) is the least favourable because it reduces the overall oxygen mass fraction, thus increasing losses by concentration.
Figure 6. Effect of GDL Tortuosity on Oxygen Mass Fraction Distribution: a) tortx=1.1, torty=1.1; b) tortx=2.8, torty=2.8; c) tortx=1.1, torty=2.8; d) tortx=2.8, torty=1.1.
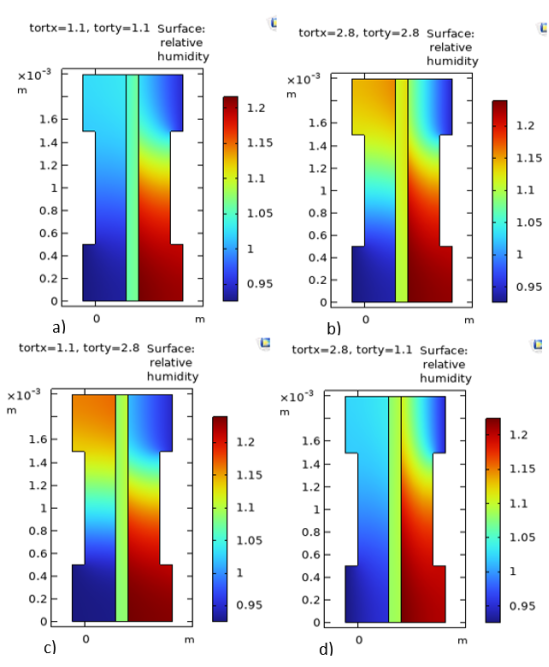
Figure 7 illustrates the influence of tortuosity on relative humidity.
The analysis of this figure shows that the water produced during the electrochemical reaction, along with the water from the humidification of the reactant gases, diffuses easily through the GDL when the tortuosity is isotropic and low (i.e. tortx=1.1, torty=1.1). This promotes good proton conductivity within the membrane. Conversely, when the isotropic tortuosity is high (tortx=2.8, torty=2.8), water transport is significantly hindered in both directions, resulting to dryness near the membrane. A reduction in proton conductivity could therefore be observed, leading also to a reduction in cell performance. As in the case of other species, anisotropic tortuosity (tortx=1.1, torty=2.8) or (tortx=2.8, torty=1.1) leads to an asymmetric distribution of relative humidity, with under-utilised areas in the direction of high values of tortuosity. Similarly, increased tortuosity leads to less pronounced concentration gradients, which can limit the efficiency of charge transfer.
Figure 7. Effect of Tortuosity on Relative Humidity Distribution in the PEM Fuel Cell: a) tortx=1.1, torty=1.1; b) tortx=2.8, torty=2.8; c) tortx=1.1, torty=2.8; d) tortx=2.8, torty=1.1.
3.2. Effect of Operation Parameters on PEMFC Performance
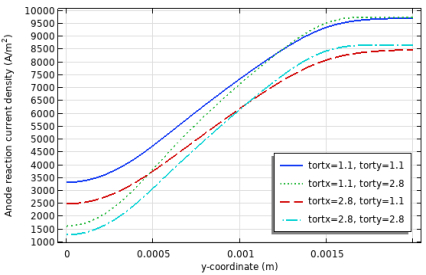
Figure 8 illustrates the variation of current density within the anode active layer as a function of cell height (i.e. Vertical position). Here, the cell height represents the spatial coordinate used to examine the distribution of different tortuosity configurations on this distribution.
In this figure, an uneven distribution of current density is observed across the layer for both configurations. Despite the variations, the curves for each configuration follow a similar overall trend, with the current density showing noticeable variation along the x and y directions due to tortuosity effects. A comparison between the two tortuosity reveals distinct differences. The highest current density is achieved when the tortuosity is low and isotropic (tortx=1.1, torty=1.1). Conversely, the lowest current density occurs in the configuration with high isotropic tortuosity (tortx=2.8, torty=2.8). Thus, low tortuosity, particularly when it is isotropic, favours optimum anodic performance by facilitating mass transport and ensuring a more homogeneous distribution of current. These results indicate that reducing the GDL tortuosity enhances reactant transport.
Figure 8. Current Density Distribution in the Anode Catalyst Layer for Two GDL Tortuosity Configurations.
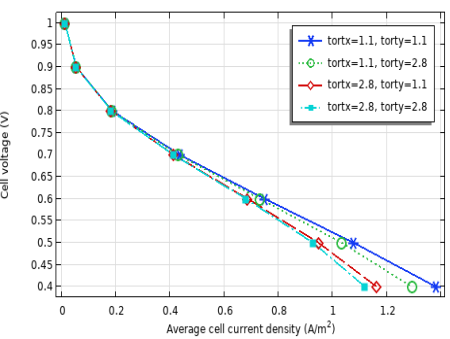
Figure 9 illustrates the effect of gas diffusion layer (GDL) tortuosity on the polarization curve of the proton exchange membrane fuel cell (PEMFC). The different curves, corresponding to various tortuosity configurations, exhibit similar general shapes and can be divides into three characteristic performance regions: activation losses, ohmic losses, and mass transport (concentration) losses.
Figure 9. Polarization Curves of the PEM Fuel Cell for Different GDL Tortuosity Conditions.
Activation zone (0-0.2 A/m²): a sharp drop in voltage is observed at low current density. This phenomenon is linked to the activation potential, which reflects the kinetics of electrochemical reactions at the anodic and cathodic interfaces.
Ohmic zone (0.2-0.8 A/cm²): Linear decrease in voltage with increasing current density, reflecting ohmic losses due to resistance to proton transport across the membrane and electron conduction through the electrodes and interconnections.
Mass transport zone (0.8-1.4 A/cm²): The cell voltage drops rapidly with increasing current density. This results from mass transport limitations, where depletion of reactants (mainly oxygen) at the catalytic sites hinders the electrochemical reaction, leading to concentration. These different results imply that the best performance is achieved for low isotropic tortuosity (tortx = 1.1, torty = 1.1), where reactant transport is most efficient and voltage losses are minimized.
3.3. Assessment of the Model’S Performance Compared to Experimental Data
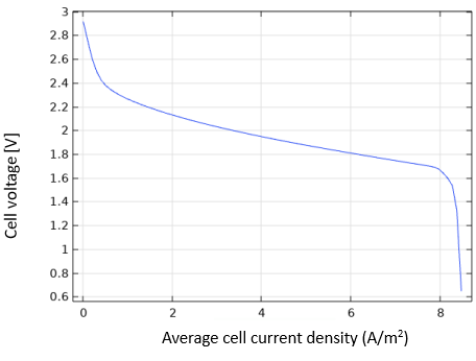
In order to assess the consistency of the model developed, a qualitative comparison was made between the numerical results and the experimental data from the PEMFC stack device available in the laboratory shown in
Figure 10. This comparison focuses mainly on the shape of the polarization curve, representing the variation in cell voltage as a function of current density. The objective is not to quantitatively validate the model, but to evaluate its ability to reproduce the general trends observed experimentally.
Figure 10. Experimental voltage curve.
Observation of the experimental and simulated polarization curves highlights the three distinct zones characteristic of the operation of a PEMFC fuel cell:
Activation region: For low current densities, the voltage drops rapidly. This decrease is mainly due to activation losses associated with electrochemical reactions at the electrodes. The model correctly reproduces this trend, although the initial slope may differ slightly due to the approximation of the kinetic parameters used.
Ohmic region: In the intermediate zone, the voltage decreases almost linearly with current density. This part is dominated by ohmic losses due to the ionic resistance of the membrane and electrical contacts. The numerical results show a slope similar to that observed experimentally, reflecting a good representation of the overall resistance of the system.
Mass transport region: At high current densities, the voltage drops sharply due to diffusion limitations of the reactants in the diffusion layers and the catalytic layer. This drop is also reproduced by the model, although the transition to this zone may appear more or less pronounced depending on the operating conditions considered.
In general, the shape of the simulated curve follows that of the experimental curve, which shows that the model adequately captures the main physical phenomena influencing the electrochemical behavior of the cell. Nevertheless, discrepancies may remain, attributable to simplifications in the model.
3.4. Other Parameters Affecting PEMFC Performance
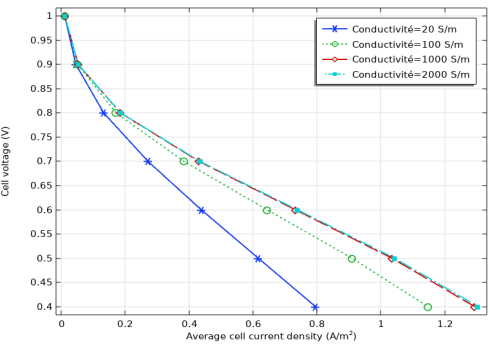
Figure 11 illustrates the polarisation curves for four electrical conductivity values, namely 20 S/m, 100 S/m, 1000 S/m and 2000 S/m. It can be seen that the increase in conductivity significantly improves the cell voltage for the same current density, reflecting a notable reduction in ohmic losses in the solid phase. This behavior is particularly pronounced in the ohmic region of the curve, where the electronic resistance of the GDL plays a predominant role. Thus, increasing conductivity from 20 S/m to 100 S/m reduces ohmic losses by approximately 30% (calculated from voltage differences at 0.6 A/m²), as mass transport resistance is negligible. Higher conductivity therefore allows for more efficient transport of electrons to the reaction sites, thereby reducing the potential drop associated with the passage of current. However, it should also be noted that the benefits of improved conductivity become progressively less significant above 1000 S/m. The curves associated with conductivities of 1000 S/m and 2000 S/m overlap, indicating that performance improvement saturates beyond a certain threshold. It appears that moderate conductivity, in the order of 1000 S/m, seems to be a satisfactory compromise between performance and material feasibility, while that values below 100 S/m cause significant losses and should be avoided in realistic battery configurations. The analysis shows that a conductivity between 100 and 1000 S/m is sufficient to ensure optimal performance.
Figure 11. Effect of electrical conductivity on PEM Fuel Cell Performance.
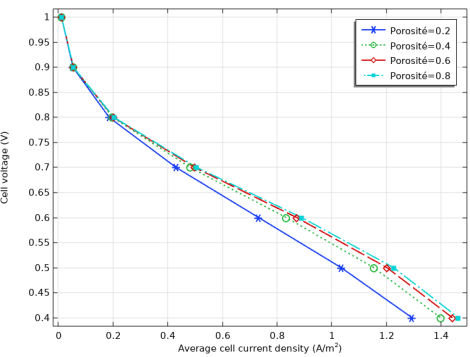
Figure 12. Effect of Porosity on PEM Fuel Cell Performance.
Figure 12 illustrates the impact of porosity on the polarization curve of a proton exchange membrane fuel cell. The simulation were conducted at a constant temperature of 80°C and pressure of and 1 atm.
As illustrated by the polarization curves in the figure for porosities of 0.2, 0.4, 0.6, and 0.8, the influence of GDL porosity on PEMFC performance is reflected in a characteristic change in voltage as a function of current density. For each porosity value, the voltage decreases gradually as the current density increases, which corresponds to typical polarization behavior. However, there is a noticeable improvement in performance as porosity increases: at equal current density, the voltage is higher. This gain is particularly significant between porosities of 0.2 and 0.6. In this range, the increase in porosity facilitates the diffusion of reactive gases (particularly oxygen) to the active sites of the cathode. Increased permeability thus reduces the limitations due to mass transport, which become predominant at high current densities. Beyond a porosity of 0.6, the improvement in performance diminishes; at 0.8, it becomes negligible. This is because higher porosity promotes better gas distribution in the GDL and the catalytic layer, which increases oxygen availability and improves the removal of water produced by the reaction. However, when porosity exceeds a certain threshold (approximately 0.8), the solid fraction of the porous layer is reduced excessively. This reduction can then compromise the cell's power output, despite the advantages it brings to gas transfer and water removal.
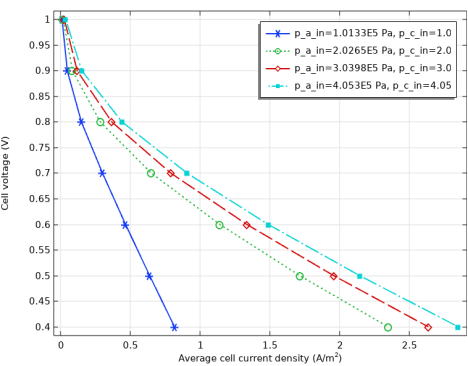
Figure 13 explores the influence of gas pressure on the polarization behaviour of the PEMFC under the same operating temperature of 80°C. This figure aims to highlight how variations in operating pressure affect the cell’s voltage-current characteristics.
Figure 13. Effect of Anode and Cathode Gas Pressure on PEM Fuel Cell Performance.
This figure shows that at a constant current density of 1 A/m², the cell voltage increases by approximately 6% when the pressure rises from 1 atm to 4 atm. This increase in pressure is necessary to maintain a constant current density as the pressure increases. The increase in pressure causes an increase in the partial pressures of the reactive gases, which increases the Nernst potential. Above 4 atm, the improvement in cell performance becomes marginal, revealing the existence of a critical pressure threshold. Finally, it is important to note that high-pressure operation can induce technical constraints, risk of membrane drying, premature aging of components (mechanical stress), and additional energy consumption related to gas compression.
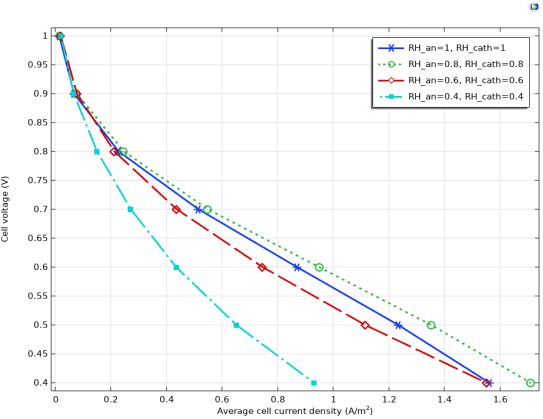
Figure 14 highlights the influence of relative humidity on PEM stack performance.
This figure shows the polarisation curves for different concentrations of oxygen and hydrogen, with relative humidity (RH) levels between 40% and 100%. At an operating voltage of approximately 0.7 V, there is a significant increase in current density, from 0.22 A/m² to 0.3 A/m² when RH increases from 40% to 80%. Optimal performance is achieved when RH is maintained between 60% and 80%. At low RH values (e.g. 40%), dehydration of the membrane occurs, leading to a reduction in proton conductivity, and high RH levels can cause membrane clogging.
Figure 14. Effect of Relative Humidity on PEM fuel cell Performance.