Abstract
Fiber Bragg gratings (FBGs) are regularly spaced patterns written into the core of optical fibers, which reflect certain wavelengths while allowing others to pass. They are widely used in telecommunications, sensing, and photonics. The most common method to create FBGs is the phase mask technique, a reliable and repeatable approach where an ultraviolet (UV) laser is passed through a carefully designed mask, producing an interference pattern that permanently changes the fiber core’s refractive index. The phase mask is a transparent silica plate with etched grooves that diffract the UV light predominantly into the ±1 orders, while suppressing the zeroth order to low levels (typically < 5%), resulting in an interference pattern with a period half that of the mask grating pitch. The spectral performance of an FBG such as its Bragg wavelength, bandwidth, reflectivity, sidelobe suppression, and spectral shape is directly influenced by the physical design parameters of the phase mask. The grating period of the phase mask determines the Bragg wavelength according to the Bragg condition, while the groove depth and duty cycle affect the diffraction efficiency and interference contrast necessary to produce a strong and uniform index modulation. Variations in these parameters can lead to shifts in spectral response or decreased performance, highlighting the importance of precise mask fabrication. This study examines the relationship between phase mask design and FBG optical characteristics by integrating coupled?mode theory and numerical modeling to quantify how mask geometry and fabrication tolerances influence the resulting grating performance. Understanding this relationship enables optimization of phase mask specifications for enhanced grating reflectivity, tailored bandwidth, and reduced sidelobes, which are essential for high?speed optical communication systems and advanced sensor designs. The insights from this work contribute to improved phase mask design strategies, bridging the gap between theoretical modeling and practical implementation of better FBGs.
Keywords
Fiber Bragg Grating (FBG), Phase Mask, Optical Fiber, Diffraction Efficiency, Bragg Wavelength
1. Introduction
Fiber Bragg gratings (FBGs) consist of regular variations in the refractive index along an optical fiber core. They reflect specific wavelengths while allowing others to pass, making them highly effective as wavelength-selective filters, reflectors, and sensing elements in modern optical communication and sensing systems
| [1] | K. O. Hill, Y. Fujii, D. C. Johnson, and B. S. Kawasaki, “Photosensitivity in optical fiber waveguides: Application to reflection filter fabrication,” Applied Physics Letters, vol. 32, no. 10, pp. 647–649, 1978.
https://doi.org/10.1063/1.89881 |
| [2] | K. O. Hill and G. Meltz, “Fiber Bragg grating technology fundamentals and overview,” Journal of Lightwave Technology, vol. 15, no. 8, pp. 1263–1276, 1997.
https://doi.org/10.1109/50.618320 Scilit |
[1, 2]
. The wavelength reflected by an FBG, called the Bragg wavelength, depends on the effective refractive index of the fiber core and the grating period, following the Bragg condition: as
where
is the effective refractive index and
is the grating period
| [3] | A. Othonos and K. Kalli, Fiber Bragg Gratings: Fundamentals and Applications in Telecommunications and Sensing, Artech House, 1999. |
[3]
. This selective reflection occurs due to constructive interference of light reflected from consecutive refractive index modulations along the fiber
. The performance of an FBG including reflectivity, bandwidth, spectral shape, sidelobe suppression, and sensitivity to temperature or strain largely depends on the quality of the refractive index modulation and the grating’s physical parameters
| [5] | G. Meltz, W. W. Morey, and W. H. Glenn, “Formation of Bragg gratings in optical fibers by a transverse holographic method,” Optics Letters, vol. 14, no. 15, pp. 823–825, 1989.
https://doi.org/10.1364/OL.14.000823 Optica Publishing Group. |
| [6] | A. Yariv, Optical Electronics in Modern Communications, 5th ed., Oxford University Press, 1997. |
[5, 6]
. These parameters are directly influenced by the fabrication method. Among the various techniques for inscribing FBGs, such as interferometric and point-by-point UV writing, the phase mask approach has become the standard in both research and industry because it offers reproducibility, simplicity, and the ability to produce high-quality gratings with consistent characteristics
| [7] | H. Kogelnik, “Coupled wave theory for thick hologram gratings,” Bell System Technical Journal, vol. 48, no. 9, pp. 2909–2947, 1969. |
| [8] | K. O. Hill, B. Malo, F. Bilodeau, D. C. Johnson, and J. Albert, “Bragg gratings fabricated in monomode photosensitive optical fiber by UV exposure through a phase mask,” Journal of Lightwave Technology, vol. 9, no. 5, pp. 963–969, 1991.
https://doi.org/10.1109/50.85661 |
[7, 8]
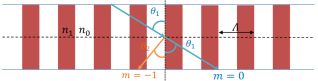
. In the phase mask method, a photosensitive optical fiber is exposed to ultraviolet (UV) light through a transparent plate with a periodic surface relief structure the phase mask. The mask diffracts the UV beam into +1 and −1 orders while reducing the zero-order component. The phase mask etching depth and duty cycle directly influence the induced refractive index modulation (
) and diffraction efficiency, affecting the Bragg wavelength, reflectivity, and sidelobe suppression. The interference of these diffracted beams just behind the mask forms a stationary fringe pattern with a period equal to half of the mask period, creating a permanent modulation of the refractive index in the fiber core
| [9] | R. Kashyap, Fiber Bragg Gratings, 2nd ed., Academic Press, 2009. https://doi.org/10.1016/C2009?0?16830?7 |
| [10] | M. C. Large and A. D. Kersey, “Fiber optic Bragg grating sensors: An overview,” IEEE Sensors Journal, vol. 1, no. 4, pp. 204–218, 2001.
https://doi.org/10.1109/7361.969397 |
[9, 10]
. The grating period produced in this way directly determines the Bragg wavelength of the FBG. Therefore, the phase mask’s geometry its period, groove depth, and duty cycle are critical in defining the optical performance of the grating. Accurate control of these parameters affects the magnitude and uniformity of the index change, the diffraction efficiency of the mask, and the final spectral properties of the grating
| [11] | T. Erdogan, “Fiber grating spectra,” Journal of Lightwave Technology, vol. 15, no. 8, pp. 1277–1294, 1997.
https://doi.org/10.1109/50.618322 Semantic Scholar |
| [12] | D. M. Marom and A. Yariv, “Phase mask technique for fiber grating fabrication: Theory and experiments,” Optics Communications, vol. 97, no. 4–6, pp. 291–296, 1993.
https://doi.org/10.1016/0030?4018(93)90398?C |
[11, 12]
. Understanding the link between phase mask design and FBG performance is essential for optimizing gratings used in telecommunications, sensing, and advanced photonic devices
| [13] | P. C. C. Freire, J. Albert, and M. C. Large, “Chirped fiber Bragg gratings: Design, fabrication, and applications,” IEEE Photonics Technology Letters, vol. 11, no. 11, pp. 1450–1452, 1999.
https://doi.org/10.1109/68.803601 |
| [14] | X. Bao and L. Chen, “Recent progress in fiber Bragg grating sensors,” Sensors, vol. 12, no. 7, pp. 9267–9309, 2012.
https://doi.org/10.3390/s120709267 |
[13, 14]
. This study examines this relationship through analytical modeling and numerical simulations, providing practical guidelines for designing high-performance FBGs
.
2. Mathematical Relationship Between Phase Masks and Bragg Gratings in Optical Fibers
Phase masks are essential tools for creating fiber Bragg gratings (FBGs) within optical fibers
| [8] | K. O. Hill, B. Malo, F. Bilodeau, D. C. Johnson, and J. Albert, “Bragg gratings fabricated in monomode photosensitive optical fiber by UV exposure through a phase mask,” Journal of Lightwave Technology, vol. 9, no. 5, pp. 963–969, 1991.
https://doi.org/10.1109/50.85661 |
| [12] | D. M. Marom and A. Yariv, “Phase mask technique for fiber grating fabrication: Theory and experiments,” Optics Communications, vol. 97, no. 4–6, pp. 291–296, 1993.
https://doi.org/10.1016/0030?4018(93)90398?C |
[8, 12]
. They are optical components that split and diffract a UV laser beam to produce a regular interference pattern, which is then transferred into the fiber core. This process generates a periodic variation in the refractive index, forming a Bragg grating that selectively reflects certain wavelengths while allowing others to pass. Understanding how phase mask design affects the resulting grating is key for developing accurate FBGs for telecommunications, sensing, and optical signal processing applications
| [9] | R. Kashyap, Fiber Bragg Gratings, 2nd ed., Academic Press, 2009. https://doi.org/10.1016/C2009?0?16830?7 |
| [10] | M. C. Large and A. D. Kersey, “Fiber optic Bragg grating sensors: An overview,” IEEE Sensors Journal, vol. 1, no. 4, pp. 204–218, 2001.
https://doi.org/10.1109/7361.969397 |
[9, 10]
. The coupled-mode equations are solved for each fiber segment and then combined into a transfer matrix to determine the overall grating response. This approach allows the simulation of both uniform and non-uniform gratings efficiently.
2.1. Modeling Operation
Various approaches exist to model the behavior of Bragg gratings. In this work, the coupled-mode theory is adopted due to its simplicity and its ability to closely match experimental observations. In this framework, a Bragg grating is treated as a regular modulation of the effective refractive index, denoted as , along the fiber axis:
The variation of the fiber’s effective refractive index, , along the grating can be expressed as:
(2)
With:
: the mean amplitude of the refractive index variation across a single grating period.
: the magnitude of the refractive index variation.
: the spacing of one complete cycle of the grating.
: the relative position or shift of the grating pattern.
2.2. Classification of Bragg
Bragg gratings can be categorized as follows:
For an unchanging grating, the Bragg structure behaves like a standard optical diffraction grating.
3. Materials and Methods
Creating a phase mask involves choosing materials that have a precise refractive index contrast between the fiber core and cladding. To accomplish this, the fiber is first modeled mathematically, and the results are then simulated using MATLAB.
3.1. Modeling the Phase Masks
Therefore, the influence of the grating on a light wave traveling at an angle can be described by the following equation:
With:
1) : the angle at which the light is diffracted.
2) : the diffraction order of the beam.
This relation gives the angle
where the interference pattern forms, but it does not indicate the wavelength at which the grating achieves maximum mode coupling. For a reflective Bragg grating, only the interaction between the incident and reflected light is considered, leading to the following expression:
| [7] | H. Kogelnik, “Coupled wave theory for thick hologram gratings,” Bell System Technical Journal, vol. 48, no. 9, pp. 2909–2947, 1969. |
| [11] | T. Erdogan, “Fiber grating spectra,” Journal of Lightwave Technology, vol. 15, no. 8, pp. 1277–1294, 1997.
https://doi.org/10.1109/50.618322 Semantic Scholar |
[7, 11]
We then introduce the propagation constant:
| [6] | A. Yariv, Optical Electronics in Modern Communications, 5th ed., Oxford University Press, 1997. |
[6]
And it can be rewritten as follows:
In a reflective Bragg grating, the primary contribution comes from the first diffraction order. By taking , the following relation is obtained:
Since the diffraction corresponds to the first order , the relation can be written as:
From this, the wavelength at which a mode with effective index couples to a mode with can be determined as:
For , This leads to the following expression:
3.2. Modeling Transfer Matrix Method
For this work, the transfer matrix technique was employed to simulate the spectral behavior of Bragg gratings. This method provides an efficient and accurate way to model the optical reflection characteristics of the grating.
| [13] | P. C. C. Freire, J. Albert, and M. C. Large, “Chirped fiber Bragg gratings: Design, fabrication, and applications,” IEEE Photonics Technology Letters, vol. 11, no. 11, pp. 1450–1452, 1999.
https://doi.org/10.1109/68.803601 |
| [14] | X. Bao and L. Chen, “Recent progress in fiber Bragg grating sensors,” Sensors, vol. 12, no. 7, pp. 9267–9309, 2012.
https://doi.org/10.3390/s120709267 |
[13, 14]
Additionally, it offers flexibility, making it suitable for analyzing non-uniform gratings as well. A cross-sectional length of 10 periods (5.35 μm) was chosen to balance simulation accuracy and computation time. Convergence analysis confirmed that this segmentation does not introduce numerical artifacts compared to single-period segments.
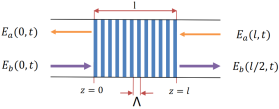
The forward and backward-propagating electric fields within a fiber segment of length in the Bragg grating can be expressed as:
The coupled-mode theory represents the complex amplitudes and in the following way:
(13)
With:
1) The coupling constant
2)
The following relationships serve as the foundation for simulating Bragg gratings in optical fibers. By applying the boundary conditions:
Solving this system of equations provides the expressions for how these two waves vary along the z-axis:
The backward-propagating wave and the forward-propagating wave can be represented through a scattering matrix formulation:
(18)
By replacing
and
from the equation (
18), the resulting relations are:
(19)
(20)
With:
Using the matrix along with the definitions of and , the resulting transfer matrix can be written a:
(22)
With:
(23)
(24)
Calculating the transfer matrix enabled efficient modeling of various Bragg grating types. The grating is segmented into uniform sections, each spanning one or more grating periods. When simulating a grating with gradually varying periods, careful consideration must be given to the maximum size of each segment.
Certainly, if the sections are too long, oscillations appear in both the reflection spectrum and the group delay. Therefore, the section length must be limited to ensure that the Bragg grating behaves like one with a linearly varying period.
The optimal approach is to use sections containing a single grating period. To keep simulation times reasonable, however, a section length of 10 periods was chosen as a practical compromise and applied throughout this study. The optical response of each section is then cascaded to determine the overall response of the Bragg grating of total length. This approach allows assigning a distinct period to each section, enabling the simulation of non-uniform gratings. Mathematically, this can be expressed as:
We obtain:
(26)
The wavelength calculation involves determining the transfer matrix for each section and multiplying them to derive the overall response of the Bragg grating. This results in a transfer matrix of the form:
It is thus possible to obtain the reflectivity and the phase of the light from the reflection coefficient :
For a uniform grating, in which the effective refractive index and the period are constant, we obtain:
(30)
Thus, for the Bragg wavelength , with:
We obtain:
This modeling method allows assigning a unique period to each section, enabling the simulation of non-uniform Bragg gratings. It also makes it possible to calculate the group delay (), representing the time each wavelength takes to be reflected, with the formula below:
With:
Where:
1) : the phase
2) : the speed of light
Similarly, the effect of apodization a technique consisting of applying a varying refractive index change along the grating can.
4. Results
In this work, we analyzed the main factors affecting the behavior of Bragg gratings, including:
The total grating length,
;
| [2] | K. O. Hill and G. Meltz, “Fiber Bragg grating technology fundamentals and overview,” Journal of Lightwave Technology, vol. 15, no. 8, pp. 1263–1276, 1997.
https://doi.org/10.1109/50.618320 Scilit |
| [5] | G. Meltz, W. W. Morey, and W. H. Glenn, “Formation of Bragg gratings in optical fibers by a transverse holographic method,” Optics Letters, vol. 14, no. 15, pp. 823–825, 1989.
https://doi.org/10.1364/OL.14.000823 Optica Publishing Group. |
[2, 5]
The refractive index difference,
, between the UV-exposed and unexposed regions of the fiber;
| [1] | K. O. Hill, Y. Fujii, D. C. Johnson, and B. S. Kawasaki, “Photosensitivity in optical fiber waveguides: Application to reflection filter fabrication,” Applied Physics Letters, vol. 32, no. 10, pp. 647–649, 1978.
https://doi.org/10.1063/1.89881 |
| [9] | R. Kashyap, Fiber Bragg Gratings, 2nd ed., Academic Press, 2009. https://doi.org/10.1016/C2009?0?16830?7 |
[1, 9]
The bandwidth and group delay characteristics of chirped gratings.
| [12] | D. M. Marom and A. Yariv, “Phase mask technique for fiber grating fabrication: Theory and experiments,” Optics Communications, vol. 97, no. 4–6, pp. 291–296, 1993.
https://doi.org/10.1016/0030?4018(93)90398?C |
| [13] | P. C. C. Freire, J. Albert, and M. C. Large, “Chirped fiber Bragg gratings: Design, fabrication, and applications,” IEEE Photonics Technology Letters, vol. 11, no. 11, pp. 1450–1452, 1999.
https://doi.org/10.1109/68.803601 |
[12, 13]
4.1. Results of Uniform Bragg Grating Modeling
From equation (
33), it can be seen that, for a constant-period Bragg grating, the key parameters to optimize are limited to the grating length and the induced change in effective refractive index.
| [2] | K. O. Hill and G. Meltz, “Fiber Bragg grating technology fundamentals and overview,” Journal of Lightwave Technology, vol. 15, no. 8, pp. 1263–1276, 1997.
https://doi.org/10.1109/50.618320 Scilit |
| [6] | A. Yariv, Optical Electronics in Modern Communications, 5th ed., Oxford University Press, 1997. |
[2, 6]
4.2. Influence of Grating Length
To check the accuracy of the results, simulations were carried out on constant-period Bragg gratings of varying lengths, using a refractive index contrast of:
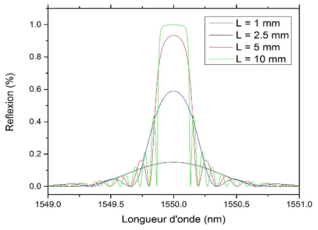
Figure 3 presents the reflected power of the Bragg grating versus the light wavelength for various grating lengths.
Figure 3. Reflected power of uniform Bragg gratings with lengths ranging from 1 mm to 10 mm, a period of 535 nm,, and different . Reflected power of uniform Bragg gratings with lengths ranging from 1 mm to 10 mm, a period of 535 nm,, and different .
For:
It is observed that the grating reaches a reflection plateau at its maximum. As the refractive index contrast decreases, the reflected power drops correspondingly, with saturation disappearing for .. In practice, varies depending on the amount of energy delivered to the fiber. This trend, previously confirmed by experimental studies, supports the validity of the mathematical model for simulating non-uniform gratings. Therefore, to avoid saturation effects, a value of is considered optimal and is adopted for all subsequent grating simulations in this chapter.
4.3. Chirped Bragg Gratings
For the simulation of chirped gratings, the mathematical model is modified to closely replicate their optical behavior. In a Bragg grating with a linearly varying period, each section (still
long) is assigned a slightly longer period. The overall grating period for such a Bragg grating can then be expressed as:
| [13] | P. C. C. Freire, J. Albert, and M. C. Large, “Chirped fiber Bragg gratings: Design, fabrication, and applications,” IEEE Photonics Technology Letters, vol. 11, no. 11, pp. 1450–1452, 1999.
https://doi.org/10.1109/68.803601 |
| [15] | M. H. Khan, H. Ahmad, and A. Saleem, “Transfer matrix modeling of uniform and chirped fiber Bragg gratings,” Optik, vol. 125, no. 17, pp. 4902–4908, 2014.
https://doi.org/10.1016/j.ijleo.2014.04.061 |
[13, 15]
With:
1) and : the grating periods at the ends of the grating
2) : the total length of the grating
This method enables the simulation of gratings with gradually changing periods without extending computation time. In this work, the specified periods correspond to those engraved on the phase mask, resulting in a fiber grating period that is half of the mask period.
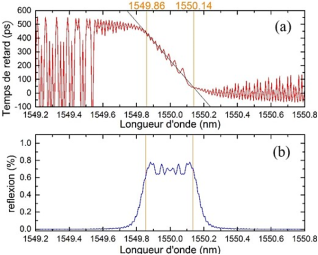
Simulating FBG with a linearly varying period illustrates how a gradual period change affects both reflection and group delay. For the cases shown in
Figure 4, we adopted parameters from the reference, which, to our knowledge, provide optimal dispersion performance, with a grating period variation of
Figure 4(a) presents the group delay versus wavelength, while
Figure 4(b) displays the reflected power as a function of wavelength.
Linear variation of the group delay with respect to wavelength allows estimating the grating dispersion. We thus obtain a dispersion of , which is close to the experimentally measured value of , thereby validating our modeling.
5. Discussion
The modeling and simulation results obtained in this study provide a comprehensive understanding of the behavior of fiber Bragg gratings (FBGs) under various design parameters. Several aspects of the FBG performance were examined, including the effects of grating length, refractive index modulation, chirping, and apodization on reflectivity, group delay, and dispersion. The study demonstrates that accurate control of the phase mask period, groove depth, and duty cycle is critical for achieving high reflectivity, desired bandwidth, and effective sidelobe suppression.
5.1. Uniform Bragg Gratings
For Bragg gratings with a constant period, the simulations indicate that reflectivity is mainly influenced by two factors: the grating’s total length LLL and the difference in refractive index
| [2] | K. O. Hill and G. Meltz, “Fiber Bragg grating technology fundamentals and overview,” Journal of Lightwave Technology, vol. 15, no. 8, pp. 1263–1276, 1997.
https://doi.org/10.1109/50.618320 Scilit |
| [5] | G. Meltz, W. W. Morey, and W. H. Glenn, “Formation of Bragg gratings in optical fibers by a transverse holographic method,” Optics Letters, vol. 14, no. 15, pp. 823–825, 1989.
https://doi.org/10.1364/OL.14.000823 Optica Publishing Group. |
[2, 5]
.
Longer gratings and higher
values lead to stronger reflection and faster saturation of the reflected power. However, excessively high
can result in over-saturation and undesirable spectral side lobes, which may compromise the spectral purity of the reflected signal
| [6] | A. Yariv, Optical Electronics in Modern Communications, 5th ed., Oxford University Press, 1997. |
| [11] | T. Erdogan, “Fiber grating spectra,” Journal of Lightwave Technology, vol. 15, no. 8, pp. 1277–1294, 1997.
https://doi.org/10.1109/50.618322 Semantic Scholar |
[6, 11]
.
Our results indicate that a refractive index contrast around
provides a good balance between reflection efficiency and suppression of side lobes. This value is consistent with previous experimental studies and validates the accuracy of the transfer matrix modeling approach
| [9] | R. Kashyap, Fiber Bragg Gratings, 2nd ed., Academic Press, 2009. https://doi.org/10.1016/C2009?0?16830?7 |
| [15] | M. H. Khan, H. Ahmad, and A. Saleem, “Transfer matrix modeling of uniform and chirped fiber Bragg gratings,” Optik, vol. 125, no. 17, pp. 4902–4908, 2014.
https://doi.org/10.1016/j.ijleo.2014.04.061 |
[9, 15]
. The simulation also confirms that the reflection spectrum of uniform FBGs is narrow and symmetric, which is advantageous for wavelength-selective filtering applications in optical communications
| [3] | A. Othonos and K. Kalli, Fiber Bragg Gratings: Fundamentals and Applications in Telecommunications and Sensing, Artech House, 1999. |
| [4] | J. Canning, “The technology of fiber Bragg gratings,” Reports on Progress in Physics, vol. 69, no. 2, pp. 233–276, 2006.
https://doi.org/10.1088/0034?4885/69/2/R04 |
[3, 4]
.
5.2. Chirped Bragg Gratings
The modeling of chirped FBGs demonstrated the ability to control the group delay and dispersion properties by linearly varying the grating period along the fiber
| [13] | P. C. C. Freire, J. Albert, and M. C. Large, “Chirped fiber Bragg gratings: Design, fabrication, and applications,” IEEE Photonics Technology Letters, vol. 11, no. 11, pp. 1450–1452, 1999.
https://doi.org/10.1109/68.803601 |
| [15] | M. H. Khan, H. Ahmad, and A. Saleem, “Transfer matrix modeling of uniform and chirped fiber Bragg gratings,” Optik, vol. 125, no. 17, pp. 4902–4908, 2014.
https://doi.org/10.1016/j.ijleo.2014.04.061 |
[13, 15]
. Simulations showed a linear dependence of group delay on wavelength, with a calculated dispersion of 1404
, closely matching experimental measurements of 1311
. This confirms that the transfer matrix method accurately captures the dispersive properties of chirped gratings and can be used to design devices for dispersion compensation in optical fiber networks
| [12] | D. M. Marom and A. Yariv, “Phase mask technique for fiber grating fabrication: Theory and experiments,” Optics Communications, vol. 97, no. 4–6, pp. 291–296, 1993.
https://doi.org/10.1016/0030?4018(93)90398?C |
| [14] | X. Bao and L. Chen, “Recent progress in fiber Bragg grating sensors,” Sensors, vol. 12, no. 7, pp. 9267–9309, 2012.
https://doi.org/10.3390/s120709267 |
[12, 14]
.
Chirped gratings also exhibited broader reflection bandwidths compared to uniform gratings. This is a direct consequence of the varying Bragg wavelength along the grating length, which spreads the reflected spectrum. The ability to engineer the bandwidth through the chirp rate offers practical advantages in applications requiring tailored spectral profiles, such as optical pulse shaping or broadband sensing
| [10] | M. C. Large and A. D. Kersey, “Fiber optic Bragg grating sensors: An overview,” IEEE Sensors Journal, vol. 1, no. 4, pp. 204–218, 2001.
https://doi.org/10.1109/7361.969397 |
| [13] | P. C. C. Freire, J. Albert, and M. C. Large, “Chirped fiber Bragg gratings: Design, fabrication, and applications,” IEEE Photonics Technology Letters, vol. 11, no. 11, pp. 1450–1452, 1999.
https://doi.org/10.1109/68.803601 |
[10, 13]
.
5.3. Effect of Apodization
The simulations demonstrated that applying apodization along the grating can reduce side-lobe levels and improve the spectral quality of the reflected signal. Apodization, achieved by varying
gradually along the grating, suppresses unwanted reflections from the grating edges and smooths the reflection spectrum
| [11] | T. Erdogan, “Fiber grating spectra,” Journal of Lightwave Technology, vol. 15, no. 8, pp. 1277–1294, 1997.
https://doi.org/10.1109/50.618322 Semantic Scholar |
| [12] | D. M. Marom and A. Yariv, “Phase mask technique for fiber grating fabrication: Theory and experiments,” Optics Communications, vol. 97, no. 4–6, pp. 291–296, 1993.
https://doi.org/10.1016/0030?4018(93)90398?C |
[11, 12]
. This effect is particularly significant for long gratings or high-reflectivity designs, where side lobes can otherwise distort the transmitted signal. Applying the Gaussian apodization function reduced side-lobe levels and improved spectral quality.
5.4. Implications for Phase Mask Design
The study highlights the critical relationship between phase mask parameters and FBG performance. The period, groove depth, and duty cycle of the phase mask directly influence the induced index modulation and the resulting Bragg wavelength. Accurate phase mask design is essential to achieve the desired grating properties, whether for uniform, chirped, or apodized FBGs. The simulation results provide guidelines for selecting phase mask parameters to optimize reflection efficiency, spectral bandwidth, and dispersion characteristics
| [7] | H. Kogelnik, “Coupled wave theory for thick hologram gratings,” Bell System Technical Journal, vol. 48, no. 9, pp. 2909–2947, 1969. |
| [8] | K. O. Hill, B. Malo, F. Bilodeau, D. C. Johnson, and J. Albert, “Bragg gratings fabricated in monomode photosensitive optical fiber by UV exposure through a phase mask,” Journal of Lightwave Technology, vol. 9, no. 5, pp. 963–969, 1991.
https://doi.org/10.1109/50.85661 |
| [9] | R. Kashyap, Fiber Bragg Gratings, 2nd ed., Academic Press, 2009. https://doi.org/10.1016/C2009?0?16830?7 |
[7-9]
.
5.5. Limitations and Future Work
While the transfer matrix method provides accurate and efficient modeling of FBGs, some limitations exist. The approach assumes idealized refractive index modulation and does not fully account for fabrication imperfections, non-linear effects, or temperature variations in the fiber. Future work could extend the model to include these effects and validate the simulations with additional experimental data. Moreover, the influence of higher-order chirp profiles and complex apodization functions on advanced optical applications could be explored
| [10] | M. C. Large and A. D. Kersey, “Fiber optic Bragg grating sensors: An overview,” IEEE Sensors Journal, vol. 1, no. 4, pp. 204–218, 2001.
https://doi.org/10.1109/7361.969397 |
| [14] | X. Bao and L. Chen, “Recent progress in fiber Bragg grating sensors,” Sensors, vol. 12, no. 7, pp. 9267–9309, 2012.
https://doi.org/10.3390/s120709267 |
[10, 14]
.
6. Conclusion
In this work, we explored how the design of phase masks affects the optical behavior of fiber Bragg gratings (FBGs) through both analytical modeling and numerical simulations. By combining coupled-mode theory with the transfer matrix method, we achieved an efficient and versatile way to predict reflection spectra, group delay, and dispersion for uniform as well as non-uniform gratings.
For uniform FBGs, the grating length and the refractive index contrast were identified as the most critical parameters for achieving maximum reflectivity and controlling spectral properties. In chirped gratings, linearly varying the grating period along the fiber allowed precise control over dispersion and reflection bandwidth, as confirmed by the simulated group delay and reflection spectra. The estimated dispersion values closely matched experimental measurements, validating the accuracy of the modeling approach.
Furthermore, the study highlighted the advantages of the phase mask technique, including its reproducibility and capability to produce high-quality gratings with tailored optical properties. By dividing the grating into sections and simulating non-uniform period variations, the method enables efficient optimization of grating designs while maintaining manageable computation times. The inclusion of apodization and controlled period chirp provides additional flexibility for suppressing sidelobes, controlling bandwidth, and managing dispersion, which is essential for advanced optical communication and sensing applications. The method can be applied to both linear and nonlinear chirped gratings, enabling optimization for advanced optical communication and pulse-shaping applications.
Overall, this work demonstrates that careful design of phase masks, combined with robust modeling techniques, allows the fabrication of high-performance FBGs with predictable and tunable optical characteristics. The methodologies and insights presented here provide a practical framework for optimizing gratings for telecommunications, sensing, and other photonic systems.
Abbreviations
FBG | Fiber Bragg Grating |
WDM | Wavelength-Division Multiplexing |
| Zeroth-order Light Intensity |
| Nth-order Light Intensity |
| Grating Period |
| Bragg Wavelength |
| Effective Refractive Index |
Conflicts of Interest
The authors state that there are no financial or personal connections that could have improperly affected the research presented in this study. This work was carried out independently without funding or support from commercial or external organizations. The authors also confirm that no conflicts of interest exist regarding the methods, results, or conclusions of this manuscript.
References
| [1] |
K. O. Hill, Y. Fujii, D. C. Johnson, and B. S. Kawasaki, “Photosensitivity in optical fiber waveguides: Application to reflection filter fabrication,” Applied Physics Letters, vol. 32, no. 10, pp. 647–649, 1978.
https://doi.org/10.1063/1.89881
|
| [2] |
K. O. Hill and G. Meltz, “Fiber Bragg grating technology fundamentals and overview,” Journal of Lightwave Technology, vol. 15, no. 8, pp. 1263–1276, 1997.
https://doi.org/10.1109/50.618320
Scilit
|
| [3] |
A. Othonos and K. Kalli, Fiber Bragg Gratings: Fundamentals and Applications in Telecommunications and Sensing, Artech House, 1999.
|
| [4] |
J. Canning, “The technology of fiber Bragg gratings,” Reports on Progress in Physics, vol. 69, no. 2, pp. 233–276, 2006.
https://doi.org/10.1088/0034?4885/69/2/R04
|
| [5] |
G. Meltz, W. W. Morey, and W. H. Glenn, “Formation of Bragg gratings in optical fibers by a transverse holographic method,” Optics Letters, vol. 14, no. 15, pp. 823–825, 1989.
https://doi.org/10.1364/OL.14.000823
Optica Publishing Group.
|
| [6] |
A. Yariv, Optical Electronics in Modern Communications, 5th ed., Oxford University Press, 1997.
|
| [7] |
H. Kogelnik, “Coupled wave theory for thick hologram gratings,” Bell System Technical Journal, vol. 48, no. 9, pp. 2909–2947, 1969.
|
| [8] |
K. O. Hill, B. Malo, F. Bilodeau, D. C. Johnson, and J. Albert, “Bragg gratings fabricated in monomode photosensitive optical fiber by UV exposure through a phase mask,” Journal of Lightwave Technology, vol. 9, no. 5, pp. 963–969, 1991.
https://doi.org/10.1109/50.85661
|
| [9] |
R. Kashyap, Fiber Bragg Gratings, 2nd ed., Academic Press, 2009.
https://doi.org/10.1016/C2009?0?16830?7
|
| [10] |
M. C. Large and A. D. Kersey, “Fiber optic Bragg grating sensors: An overview,” IEEE Sensors Journal, vol. 1, no. 4, pp. 204–218, 2001.
https://doi.org/10.1109/7361.969397
|
| [11] |
T. Erdogan, “Fiber grating spectra,” Journal of Lightwave Technology, vol. 15, no. 8, pp. 1277–1294, 1997.
https://doi.org/10.1109/50.618322
Semantic Scholar
|
| [12] |
D. M. Marom and A. Yariv, “Phase mask technique for fiber grating fabrication: Theory and experiments,” Optics Communications, vol. 97, no. 4–6, pp. 291–296, 1993.
https://doi.org/10.1016/0030?4018(93)90398?C
|
| [13] |
P. C. C. Freire, J. Albert, and M. C. Large, “Chirped fiber Bragg gratings: Design, fabrication, and applications,” IEEE Photonics Technology Letters, vol. 11, no. 11, pp. 1450–1452, 1999.
https://doi.org/10.1109/68.803601
|
| [14] |
X. Bao and L. Chen, “Recent progress in fiber Bragg grating sensors,” Sensors, vol. 12, no. 7, pp. 9267–9309, 2012.
https://doi.org/10.3390/s120709267
|
| [15] |
M. H. Khan, H. Ahmad, and A. Saleem, “Transfer matrix modeling of uniform and chirped fiber Bragg gratings,” Optik, vol. 125, no. 17, pp. 4902–4908, 2014.
https://doi.org/10.1016/j.ijleo.2014.04.061
|
Cite This Article
-
-
@article{10.11648/j.ajop.20261401.11,
  author = {Randriana Heritiana Nambinina Erica and Ando Nirina Andriamanalina},
  title = {Correlation Between Phase Mask Design and Fiber Bragg Grating Performance},
  journal = {American Journal of Optics and Photonics},
  volume = {14},
  number = {1},
  pages = {1-8},
  doi = {10.11648/j.ajop.20261401.11},
  url = {https://doi.org/10.11648/j.ajop.20261401.11},
  eprint = {https://article.sciencepublishinggroup.com/pdf/10.11648.j.ajop.20261401.11},
  abstract = {Fiber Bragg gratings (FBGs) are regularly spaced patterns written into the core of optical fibers, which reflect certain wavelengths while allowing others to pass. They are widely used in telecommunications, sensing, and photonics. The most common method to create FBGs is the phase mask technique, a reliable and repeatable approach where an ultraviolet (UV) laser is passed through a carefully designed mask, producing an interference pattern that permanently changes the fiber core’s refractive index. The phase mask is a transparent silica plate with etched grooves that diffract the UV light predominantly into the ±1 orders, while suppressing the zeroth order to low levels (typically < 5%), resulting in an interference pattern with a period half that of the mask grating pitch. The spectral performance of an FBG such as its Bragg wavelength, bandwidth, reflectivity, sidelobe suppression, and spectral shape is directly influenced by the physical design parameters of the phase mask. The grating period of the phase mask determines the Bragg wavelength according to the Bragg condition, while the groove depth and duty cycle affect the diffraction efficiency and interference contrast necessary to produce a strong and uniform index modulation. Variations in these parameters can lead to shifts in spectral response or decreased performance, highlighting the importance of precise mask fabrication. This study examines the relationship between phase mask design and FBG optical characteristics by integrating coupled?mode theory and numerical modeling to quantify how mask geometry and fabrication tolerances influence the resulting grating performance. Understanding this relationship enables optimization of phase mask specifications for enhanced grating reflectivity, tailored bandwidth, and reduced sidelobes, which are essential for high?speed optical communication systems and advanced sensor designs. The insights from this work contribute to improved phase mask design strategies, bridging the gap between theoretical modeling and practical implementation of better FBGs.},
 year = {2026}
}
 Copy
|
Copy
|
 Download
-
TY  - JOUR
T1  - Correlation Between Phase Mask Design and Fiber Bragg Grating Performance
AU  - Randriana Heritiana Nambinina Erica
AU  - Ando Nirina Andriamanalina
Y1  - 2026/01/19
PY  - 2026
N1  - https://doi.org/10.11648/j.ajop.20261401.11
DO  - 10.11648/j.ajop.20261401.11
T2  - American Journal of Optics and Photonics
JF  - American Journal of Optics and Photonics
JO  - American Journal of Optics and Photonics
SP  - 1
EP  - 8
PB  - Science Publishing Group
SN  - 2330-8494
UR  - https://doi.org/10.11648/j.ajop.20261401.11
AB  - Fiber Bragg gratings (FBGs) are regularly spaced patterns written into the core of optical fibers, which reflect certain wavelengths while allowing others to pass. They are widely used in telecommunications, sensing, and photonics. The most common method to create FBGs is the phase mask technique, a reliable and repeatable approach where an ultraviolet (UV) laser is passed through a carefully designed mask, producing an interference pattern that permanently changes the fiber core’s refractive index. The phase mask is a transparent silica plate with etched grooves that diffract the UV light predominantly into the ±1 orders, while suppressing the zeroth order to low levels (typically < 5%), resulting in an interference pattern with a period half that of the mask grating pitch. The spectral performance of an FBG such as its Bragg wavelength, bandwidth, reflectivity, sidelobe suppression, and spectral shape is directly influenced by the physical design parameters of the phase mask. The grating period of the phase mask determines the Bragg wavelength according to the Bragg condition, while the groove depth and duty cycle affect the diffraction efficiency and interference contrast necessary to produce a strong and uniform index modulation. Variations in these parameters can lead to shifts in spectral response or decreased performance, highlighting the importance of precise mask fabrication. This study examines the relationship between phase mask design and FBG optical characteristics by integrating coupled?mode theory and numerical modeling to quantify how mask geometry and fabrication tolerances influence the resulting grating performance. Understanding this relationship enables optimization of phase mask specifications for enhanced grating reflectivity, tailored bandwidth, and reduced sidelobes, which are essential for high?speed optical communication systems and advanced sensor designs. The insights from this work contribute to improved phase mask design strategies, bridging the gap between theoretical modeling and practical implementation of better FBGs.
VL  - 14
IS  - 1
ER  -
Copy
|
Download