Research Article | | Peer-Reviewed

An Efficient Tropical Cyclone Center Prediction Scheme Using Firefly Algorithm in Infrared Image (IR)

Received: 8 July 2026     Accepted: 22 July 2026     Published: 18 August 2026
Views:       Downloads:
Abstract

Tropical cyclones have a strong potential to bring significant economic loss to cyclone-prone areas. Locating the tropical cyclone center is significant and necessary for the timely forecasting of tropical cyclones. The observation of the typhoon's center, primarily carried out through the use of infrared (IR) images, is not easy. In some situations, the typhoon center is identified by the typhoon eye, which is overlaid on an infrared image. Therefore, the purpose of this study is to address the challenges of tropical cyclone center localization in infrared images by developing a firefly algorithm-based optimization scheme for accurate center prediction. This research proposes an efficient tropical cyclone center prediction scheme with optimization performed by the firefly algorithm to predict the central point in tropical cyclone infrared images. In addition, problems associated with pattern matching and other localization challenges are addressed through the optimization process to obtain the most accurate tropical cyclone center. Finally, the proposed scheme achieved highly accurate center localization. The proposed approach contributes to the scientific community by providing an optimization-based framework for tropical cyclone center localization that can support future research in automated cyclone analysis, infrared satellite image processing, and the development of more reliable tropical cyclone forecasting methods.

Published in American Journal of Science, Engineering and Technology (Volume 11, Issue 3)
DOI 10.11648/j.ajset.20261103.15
Page(s) 149-158
Creative Commons

This is an Open Access article, distributed under the terms of the Creative Commons Attribution 4.0 International License (http://creativecommons.org/licenses/by/4.0/), which permits unrestricted use, distribution and reproduction in any medium or format, provided the original work is properly cited.

Copyright

Copyright © The Author(s), 2026. Published by Science Publishing Group

Keywords

Tropical Cyclone, Optimization, Firefly, Center Prediction

1. Introduction
Tropical cyclones (TCs) are speedily revolving storms, which are considered by strong winds, low-pressure centers, and spiral structure of thunderstorms. TCs are also called typhoons, tropical depression, tropical storms, and hurricanes. Hence, these types of cyclones may cause major natural disasters due to the generation of sustained high winds, storm floods, and heavy rain . In general, coastal areas are mostly affected by the tropical cyclone that causes significant loss of human lives and economic than other natural disasters . The operational agencies issue forewarnings using prediction and tracking of TC is required for reducing such losses. In this, the most important task is the accurate prediction of circulation position or spiral position of TC which is also referred to as TC center or TC eye. The tropical cyclones differ widely in terms of their size and intensity characteristics. This generates a wind speed of >200km/hr. Tools and procedures developed from more than 30yrs are still being deployed by the world hurricane centers to send warnings and forecasts. These tools contain less satellite technology as well as image processing methods. Usually establishing the location of the hurricane eye is carried out manually by investigating the flow of spiral rainbands, utilizing continuous satellite-sensing images, and even with the overlying of spiral templates on remote-sensing images. The automated techniques of locating the tropical cyclone position usually make use of objective measures and gale field analysis, and pattern matching approaches , and application of the automatic tracking radar echoes by correlation algorithm. To establish the location in which the tropical cyclone is formed, Liu et al. proposed an algorithm that utilizes both edge detection and density matrix. The proposed algorithm experimented on two types of cyclones, i.e., Usagi and Haiyan, which are differentiated by the period of the cyclone. Although the central location was well identified, the algorithm was limited to only two cyclones. To measure the TC’s structure and change of intensity in IR images, Wang et al. suggested a method that considers variables or features from IR data and computes the gradient of their brightness (intensity) temperatures. Though the method exhibits an incredible capacity to distinguish the best track, the strength of the TC especially those cyclones that include simple strength characteristics such as their formation, intensification, and weakening in some instances the method cannot demonstrate complete details. Thus, it requires further analysis of some useful information, for example, the low and high oscillations due to cloud structures located within some disturbances.
Tropical cyclones with extreme speed are very harmful conditions for airborne. The images acquired from the geostationary satellites are the best tools for the identification of the hurricane eye, its shape, and location. But, there exists a problem of optimizing the outcome of motion tendency of the tropical cyclone which is used for the prediction and assisting personalities to evade the cyclone catastrophes that happen as a result of strong, sturdy winds and heavy rains. Thus, the main objective of this study is to predict and estimate the central point on the tropical cyclone infrared images (IR) by the proposed efficient tropical cyclone center prediction scheme with an optimization performed by the firefly algorithm.
For quite some time the synthetic aperture radar tool has maintained its popularity in hurricane monitoring. The image obtained by this tool is a resultant of the radar satellite (RADARSAT) tool which transmits a C-band. The radar satellite being a dynamic microwave detector or sensor radiates sensor pulsates which easily infiltrates over the clouds and later receives a sensor backscatter that comes out of the earth’s exterior. Consequently, the synthetic aperture radar tool takes pictures of the earth's exterior, and the pictures taken contain in-depth information and features of the hurricane on the surface of the sea . The synthetic aperture radar hurricane images from the surface of the ocean display the ocean’s exterior imprint of the tempests and are connected to the exterior coarseness influenced by the winds on the ocean surface, waves, and others . The features of the hurricane that are present in the synthetic aperture radar contain some bright dark curved patterns. The radar backscattering is relatively weak in cases where the rain and wind elements are missing within the hurricane position. Rarely SAR image contains typhoon or cyclone but missing an eye. The hurricane center estimation techniques have two (2) categories, namely the wind field analysis and pattern matching . There is a likelihood of the synthetic aperture radar image comprising some parts of the tropical cyclone but the absence of an eye in it. The procedures for calculating the center of a cyclone or hurricane in previous researches have been performed by the pattern matching methods of the single image . Additional methods have also been suggested by the researchers to automate the process of fixing the cyclone center using the satellite acquired images. Unlike conventional approaches that primarily rely on handcrafted feature extraction followed by optimization or heuristic localization, the major innovation of our proposed method lies in the integration of infrared (IR) image analysis with a Firefly Algorithm-based optimization framework for direct tropical cyclone (TC) center prediction. Thereby providing a more robust and effective solution for tropical cyclone center detection. The main innovations are summarized as follows:
1) Optimization-based TC center prediction: The proposed framework directly predicts the TC center by integrating pattern matching with a global optimization strategy, avoiding the dependence on handcrafted feature descriptors and heuristic localization employed in many existing methods.
2) IR image-driven cyclone representation: The method utilizes IR satellite imagery, which provides continuous observations and preserves the spatial distribution of cloud-top temperatures associated with TC formation, intensification, maturity, and decay. These thermodynamic signatures offer discriminative structural information for robust center localization under diverse meteorological conditions.
3) Firefly Algorithm for optimal center estimation: The Firefly Algorithm (FA) is adopted to perform global optimization over the IR image, iteratively searching for the optimal convergence point corresponding to the TC center. Its population-based search mechanism improves convergence toward the global optimum while reducing sensitivity to complex cloud morphology and asymmetric cyclone structures.
2. Related Works
The study by Wang et al. presented a cyclone center prediction approach based on the thermal infrared (TIR) image obtained from the geostationary satellites. In this, the minimization method is used to predict the center with the consideration of a near elliptic formation of a cyclone. The results demonstrate the accuracy of more than 70% of the ellipse fitting approach for cyclone center prediction. Ref. proposed an automatic prediction of the center of hurricanes using curved feature extraction from IR images. In this, the meteorological satellite-5 infrared images of two hurricanes and Sub-Tropical Storm 4 are examined based on the image processing techniques. Also, the hurricane’s central area is predicted with adjustment of curved features at different positions. The approach achieved an accurate prediction, in which the images posed curved structures that were featured strongly. Nevertheless, the approach provides considerable errors in the formative or decaying stage of the hurricane because of the inadequacy of robust patterns in the IR images. Ref. examined the track of TC using the unique markings of its center to find its behavior by the use of remotely-sensed moderate resolution imaging spectroradiometer (MODIS) and advanced synthetic aperture radar (ASAR) data. In order to discover and evaluate the precinct surrounded by the hurricane's eye and estimate the relative center of the hurricane's eye, they applied morphological operators.
Zheng et al. described typhoon eyes using wavelet analysis of synthetic aperture radar and IR images to predict the eyes on the surface of the ocean and top of the rain-clouds. The typhoon eye location on the surface of the ocean fluctuates from that on the top of the rain-clouds due to the vertical gale shear which acts as an upright tilt. Therefore, the big horizontal distance between typhoon eyes on the sea surface and the cloud top indicates the vertical wind shear profile that is significantly extra intricate than normally estimated. Still, the upright tilt may be affected by the seashore's response or island obstruction outcome. Wang et al. presented an approach for locating the position of the TC center using IR images. Initially, the difference of the intensity of the heat at the individual image element from neighboring image elements is estimated and hereafter the variation of the fluctuation of the slope values is evaluated. Then a line corresponding to the slope vector at each image element (pixel) is identified and the score values are stored in the density matrix. Finally, the cyclone center is predicted by comparing computed values from the hurricane center that is the Joint Typhoon Warning Centre (JTWC). Jin et al. , and Zheng et al. investigated an image processing chain to successfully discover the hurricane’s center. Initially, a filtering approach is employed to minimize speckle noise in the synthetic aperture radar image, and image contrast is improved by using top-hat transform. Then, watershed-based image segmentation is applied extracting the geometric features and semantic information. Based on these features, the pattern of typhoon eyes is predicted.
Liu et al. studied the prediction of the typhoon eye from images that are obtained by several sensors such as SAR and IR. The achieved result illustrates the existence of big horizontal distances among the cyclone circles on the surface of the sea using SAR and those on the top of the rain-cloud using IR data. Lee et al. investigated a numerical morphology approach for obtaining the eye of the hurricane automatically from the SAR information. Initially, the pruning of skeletal lines is done through the use of a technique known as discrete skeleton evolution (DSE). This is implemented to validate the public and private maintenance of the contours in the cyclone eye. To mine the edges of the cyclone eye, which effectively circumvents segmentation errors by minimization unrelated skeletal lines distance weighted algorithm is performed. Jin et al. proposed a semiautomatic center location prediction using significant region identification and pattern matching approaches. This approach is applied where a remarkable region mapping comprises the rainbands of a hurricane in a synthetic aperture radar image. In this, the pattern classification puzzle is converted as an optimization problem which is solved through the use of particle swarm optimization (PSO) algorithm to predict the best-estimated center of the TC. Xu et al. introduced a technique to predict the center of the hurricane from synthetic aperture radar images using a well-defined pattern for the hurricane’s eyes in the SAR data.
3. Materials and Methods
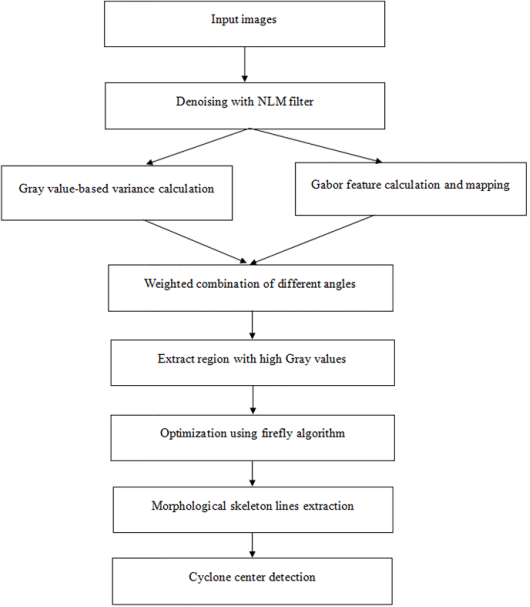
The methodology employed in the work employs infrared tropical cyclone images for the center detection based on the inflow angle, velocity of the air and intensity of the pixel in the images. The input database has been subjected to various steps to extract the information for the detection of cyclone center. The methods involved to locate the central point on the tropical cyclone infrared image is presented. The IR image is considered as an input for the detection. The IR data from the satellites are used for the analysis. The primary step is to find out the location of the hurricane in the input IR image. The proposed flowchart of the process is as shown in Figure 1.
3.1. Model Description
Generally, images hold some noisy information, we, therefore, subjected the input image to denoising with non-local-means (NLM) filter technique. First, this filtering technique is perceived as one of the excellent techniques among the image denoising methods and effectively helps in removing the noise. Secondly, it uses the entire self-estimations and self-likenesses that the digital image provides and determines the image element's weightiness for reducing a distorted image. Also, it utilizes the repetition of image features that occurs as a result of comparable patterns and structures contained in the infrared image. The technique has a grey-value in each pixel which is obtained by the weighted average of all the grey-values of all the pixels in the infrared image. If we consider a discrete noisy image for a pixel the value which is estimated is computed as the weighted average of all the pixels, i.e.,
NL=Vi=jiw i,j.v(j)(1)
where represents the weighted family of the weights which are subject to the resemblance between the image elements .
Typically, the locating of the TC’s center requires the rainband information if pattern matching and other methods are not implemented. Thus, the segmentation methods are usually included and work well with different grey-levels of the rainbands from one region to the other. Often, they seem easy and not much effective under few conditions. Therefore, the salient region detection is considered an optimized region. Primarily, the use of salient region detection helps in the extraction of the rainband regions which are taken as regions of attraction to human visual attention during the processing of the image. Next, the standard deviation is obtained, which helps to determine the discrete degree of the dataset. The results of the standard deviation are then normalized to achieve the grey-value feature maps of the IR image. Few of the grey-values match the rainbands but the main interest is not the extraction of the salient regions with grey-value facts. Because of the good directional attributes and sensitivity of the Gabor features to edge information it can be applied in the processing of an image. To obtain the Gabor features from the IR image, the image is convulsed and filtered using the Gabor filter. The Gabor filter with different tropical cyclone IR images in different orientations is calculated. The Gabor filter is broadly applied in the image processing and is expressed as,

hx,y=12πσ2exp-x2+y22σ2exp2πj(Ux́+Vý)(2)
where and represent the orientation, represents the scaling parameter, and the center frequencies is represented by .
The blending of fur angles that is mapped with image weightiness that contains utmost grey-values in the Gabor features of much directional or wavelength information results into the Gabor feature maps. Finally, the blending of Gabor features maps and grey-value variance feature maps with various weights aids in constructing of final outstanding and salient region maps.
Figure 1. Workflow Diagram.
3.2. Firefly (FA) Optimization Algorithm
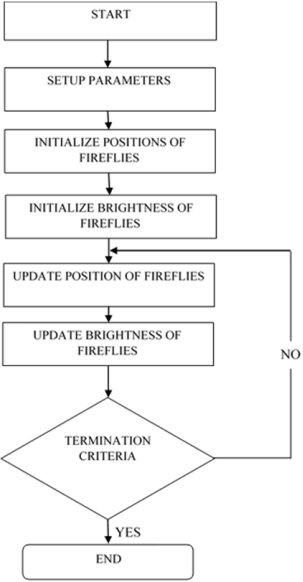
The optimization algorithm used in our work is the FA, as shown in Figure 2. This algorithm helps in image optimization. The FA has been applied in different areas of research and has proven to be very accurate and efficient as a nature-based algorithm . The FA takes some assumptions such as,
1) All the fireflies are unisex, that means there is neither male nor female and is attracted to every firefly.
2) Brightness is key factor plays a vital role and when considering two firefly search agents, the brighter agent attracts the less bright one.
3) In a situation where there is a missing brighter firefly, there is random movement of fireflies in search of the neighbors.
Figure 2. Flowchart of firefly algorithm.
This algorithm has two steps, namely the variant of light intensity and the calculation of the attractiveness of the light intensity , which varies with the distance between the flies monotonically and exponentially, and its set as,
I=I0e-γr(3)
From the equation defines the initial light intensity and gamma denotes the light absorption co-efficient.
To compute the firefly’s attractiveness is expressed by,
β=β0e-γr2(4)
where in the equation represents the distance between the two fireflies. it defines the attractiveness of the same fireflies at .
During the firefly move whereby the less bright firefly moves towards the brighter firefly (5). This change of positions is expressed as,
Xi=Xi+β0e-γr2xj-xi+άi(5)
where is a random variable that is uniformly distributed within a range of .
An overall step of the FA is to initialize the firefly’s population in the algorithm. The size of the firefly determines the amount of solutions that will be achieved. The fitness is evaluated by its light intensity. The distance between the fireflies is considered as the Cartesian distance.
The boundaries of the rainbands in an IR image are not regular. Therefore, the extraction of skeleton lines contains more branches. The gaps in the rainband regions make the skeleton line achieve the spherical lines. To ensure the process, measures are taken to maintain and achieve smooth skeleton lines. The extension of rainbands is achieved by applying morphological operators before the extraction of the skeleton lines. The model is programmed using the MATLAB R2016a framework, which shows the central location in steps. Table 1 gives a summary of the optimization (FA) algorithm parameters.
Table 1. Summary of the firefly optimization algorithm parameters.

No

Variable

Value

Description

1

nVar

5

Number of decision variables

2

VarSize

[1, 5]

Decision variables matrix size

3

VarMin

-10

Lower bound decision variables

4

VarMax

10

Upper bound decision variables

5

MaxIt

100

Number of iterations

6

nPop

25

Number of fireflies (Swarm Size)

7

gamma

1

Light absorption coefficient

8

Beta0

2

Attraction coefficient base value

9

alpha

0.2

Mutation coefficient

10

Alpha_damp

0.98

Mutation coefficient damping ratio

11

delta

1

Range of uniform mutation

4. Experiments
4.1. Data
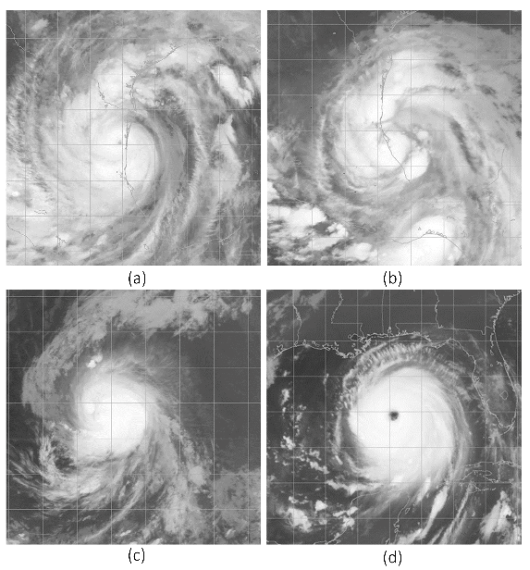
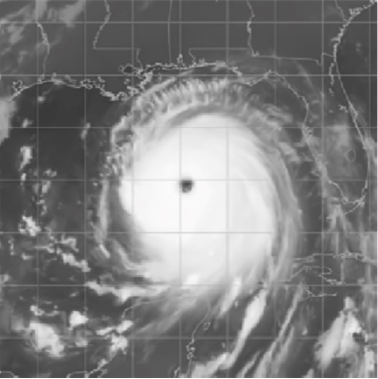
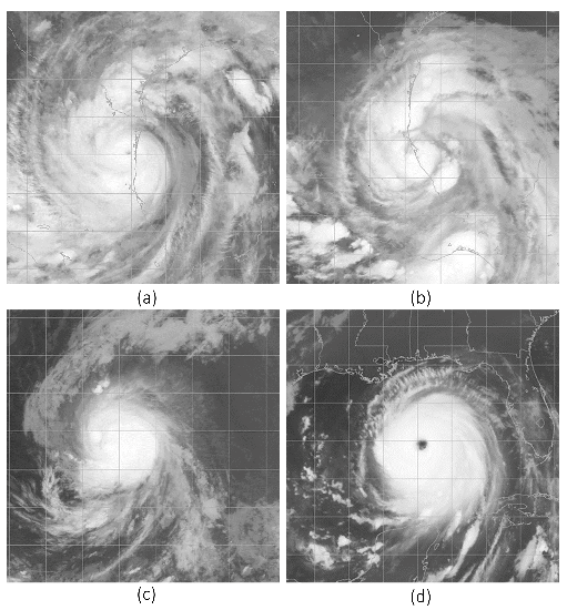
In this research, we employed 600 infrared images from geostationary satellites for center detection, and FA was used as an optimization algorithm. Table 2 records a detailed description of the mentioned IR images, which we randomly selected for our experiments. Figure 3 shows the described IR images.
Table 2. The details of the different four infrared images.

No.

Tropical cyclone

UTC Time (yy.mm.dd-hh.mm)

Maximum Intensity (knots)

1

Atl-Alex

20100701-0445

85

2

Atl-Arlene

20110630-1200

55

3

Alt-Danielle

20100823-2345

65

4

Alt-Katrina

20050828-1145

140

Figure 3. Sample of the infrared images for the analysis.
4.2. Simulation Results and Performance Evaluation
This section discusses the simulation and performance evaluation results.
4.2.1. Non-Local Means (NLM) Filtering
The next step is the computation of the salient region maps from the denoised input images using NLM filter to avoid the speckle noise and make the process smoother and the obtained filtered image gives more effective results. Figure 4 depicts the obtained image after filtering. The results demonstrate that NLM filtering suppresses image noise while preserving structural details, improving the quality of the input data for subsequent processing.
Figure 4. Filtered denoised images obtained from NLM filter.
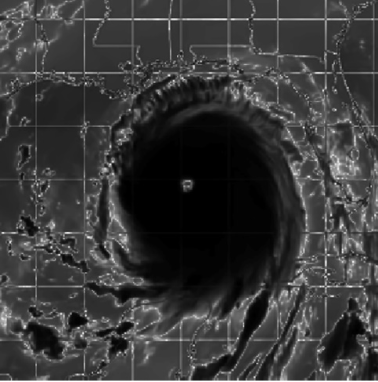
Figure 5. The grey-value variance feature map of the denoised infrared image.
The determination of the grey-value variance feature map is obtained by dividing an infrared image into different patches through the use of a sliding window. In each step of the process, the length of the sliding window is divided into halves. In cases, where the sliding window is too big, there's a likelihood of the blocking effect occurring and thus presents unrelated areas in the grey-value variance feature map. The grey-level mapped image is as shown in Figure 5.
Grey-value variance captures local intensity variations and contrast, effectively describing the statistical distribution of cloud structures in infrared tropical cyclone images, whereas Gabor features extract complementary multi-scale and orientation-dependent texture information that characterizes spiral cloud bands and cyclone morphology. Their integration provides a more comprehensive and discriminative feature representation by combining statistical and textural characteristics, thereby improving the robustness and accuracy of tropical cyclone center localization.
4.2.2. Gabor Feature Extraction
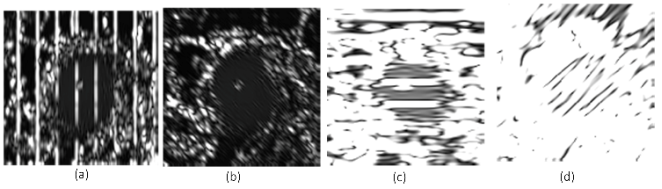
The normalization of individual patches of the IR image is determined by calculating its standard deviation. The position of the rainbands is indicated by the grey-value feature maps. The paths which are having higher pixel values contain the rainbands. The orientation and wavelength information are used to find out the Gabor features in the image. The pre-processed Gabor structures of the TC infrared images are computed by applying four different angles to obtain the required Gabor structure maps. Further, Gabor structure maps and grey variance structure maps are combined to obtain the maximum pixel density map and the result of this combination are as depicted in Figure 6.
Figure 6. Gabor feature map with different orientations a) A=0°, WI=4, b) A=45°, WI=4, c) A=90°, WI=8, and d) A=135°, WI=12.
The analysis shows that Gabor features enhance the representation of texture and directional characteristics of tropical cyclones, improving discrimination of cyclone structures compared with using raw image features alone.
4.2.3. Gabor Feature Extraction
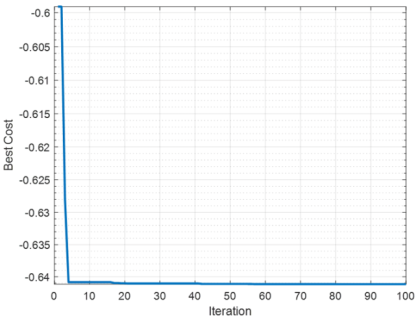
Relevant region maps are segmented into binary images. To select the band region two filter criteria are used and the long and thin lines are represented, which explains the characteristics of the rainbands. After the combination of Gabor and grey-value map, the optimization of the FA gives the convergence curve with the best search optimum interval value of -0.64 as shown in Figure 7. The results indicate that the optimization process improves convergence toward the cyclone center and localization accuracy compared with a non-optimized approach.
Figure 7. Optimization using firefly algorithm.
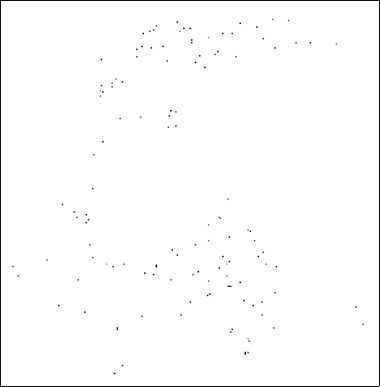
After the optimization of the firefly algorithm, the skeletal lines are extracted to avoid the impact of the blurs. Before the real extraction of skeletal lines, the rainbands are expanded through the use of the morphological operators. The optimized output is employed for skeleton extraction. Expansion is performed to make the skeleton lines smoother and is shown in Figure 8.
Figure 8. Results of the extracted skeleton lines from the infrared image.
The optimal solution of separate skeleton lines is computed and the center location results are determined by finding the average of all the skeleton lines which were optimized. Based upon the skeleton image information, including the pixel orientation, intensity, and centroid the center of the cyclone is detected and the resulting images are depicted in Figure 9.
Figure 9. Cyclone center detection on different tropical cyclone infrared images, a) Atl-Alex -20100701, b) Atl-Arlene -20110630, c) 3. Alt-Danielle -20100823, and d) Alt-Katrina -20050828.

Table 3 lists the mean track error of our proposed algorithm compared with other methods for tropical cyclone estimation.
Table 3. The details of the different four infrared images.

Researcher (s)

Mean track error (km)

Processing time (sec)

Liu et al.

46.27

-

S. Wang et al.

74

-

P. Wang et al.

56.13

-

H. Wang et al.

50

-

Jin et al.

-

20-25

Proposed

44.72

13-14

Through the use of FA as optimization algorithm in our proposed algorithm, the image computation took between 13-14 s for each image as can be seen from Table 3.
5. Conclusions
In this research, an efficient technique that is the firefly algorithm for optimization is employed to predict the central point in the tropical cyclone (TC) on infrared image (s). Denoising process is carried out using NLM filter technique to obtain a blur-free image. The locating of this TC center is based on the detection of the salient region of interest and optimizing the results for IR images. Some steps are followed that is, the salient region detection method based on Gabor features and grey-values. The two filter criteria are employed for the selection of rainbands and the skeleton line is obtained by the rainbands and the optimization process is followed. Thus, it is observed that the firefly algorithm gives accurate output compared to others. In Future, the proposed system can be ameliorated by using different advanced techniques which gives more effective results.
Limitations of the proposed scheme: Even though the proposed framework achieved accurate tropical cyclone center localization, its performance depended on the quality of the input infrared images and may degrade under severe noise, cloud occlusions, or irregular cyclone structures. Furthermore, the iterative optimization process increased computational complexity, which may limit real-time applicability. The framework has also been evaluated on a limited dataset; therefore, further validation using diverse satellite sensors, geographical regions, and cyclone intensities is required to establish its robustness and generalizability. Future studies can focus on improving computational efficiency and integrating advanced feature learning techniques to enhance prediction accuracy and operational performance.
Abbreviations

FA

Firefly Algorithm

IR

Infrared

NLM

Non-local-means

PSO

Particle Swarm Optimization

TC

Tropical Cyclone

UTC

Universal Time Coordinated

Author Contributions
Douglas Omwenga Nyabuga: Conceptualization, Data curation, Formal Analysis, Investigation, Methodology, Project administration, Resources, Software, Supervision, Validation, Visualization, Writing – original draft, Writing – review & editing
Conflicts of Interest
The authors declare no conflicts of interest.
References
[1] X. Wang, W. Wang, and C. Tong, “A review on impact of typhoons and hurricanes on coastal wetland ecosystems,” Acta Ecologica Sinica, vol. 36, no. 1, pp. 23–29, Feb. 2016,
[2] X. Wang, L. Xue, C. Zhang, L. Ma, and X. Lu, “Objective location method of tropical cyclone by the deviation angle variance with pre-processing,” p. 263, Mar. 2021,
[3] P. Wang, P. Wang, C. Wang, Y. Yuan, and D. Wang, “A center location algorithm for tropical cyclone in satellite infrared images,” IEEE J. Sel. Top. Appl. Earth Obs. Remote Sens., vol. 13, pp. 2161–2172, 2020,
[4] Y. Y. Cheng, H. H. Lo, B. F. Chen, and H. C. Kuo, “Analyzing Tropical Cyclone Surface Wind Asymmetry with a Polar-Coordinate Periodic-Domain Deep Learning Model,” Mon. Weather Rev., vol. 154, no. 6, pp. 1109–1132, Jun. 2026,
[5] J. Liu, C. Liu, B. Wang, and D. Qin, “A novel algorithm for detecting center of tropical cyclone in satellite infrared images,” in 2015 IEEE International Geoscience and Remote Sensing Symposium (IGARSS), IEEE, Jul. 2015, pp. 917–920.
[6] S. Wang, G. Liu, Y. Yu, W. Ma, and X. Yang, “A Multi-Features-Based Model for Tropical Cyclone Intensity Estimation with Infrared Remote Sensing Observations,” 2025 Photonics and Electromagnetics Research Symposium - Spring, PIERS-Spring 2025 - Proceedings, 2025,
[7] S. Mu, H. Wang, C. Wang, W. Perrie, and X. Li, “Retrieval and Attribution of Tropical Cyclone Vertical Tilt From SAR and Infrared Satellite Imagery,” Geophys. Res. Lett., vol. 53, no. 5, Mar. 2026,
[8] F. Xu, X. Li, P. Wang, J. Yang, W. G. Pichel, and Y.-Q. Jin, “A Backscattering Model of Rainfall Over Rough Sea Surface for Synthetic Aperture Radar,” IEEE Transactions on Geoscience and Remote Sensing, vol. 53, no. 6, pp. 3042–3054, Jun. 2015.
[9] S. Jin, S. Wang, X. Li, L. Jiao, J. A. Zhang, and D. Shen, “A Salient Region Detection and Pattern Matching-Based Algorithm for Center Detection of a Partially Covered Tropical Cyclone in a SAR Image,” IEEE Transactions on Geoscience and Remote Sensing, vol. 55, no. 1, pp. 280–291, Jan. 2017,
[10] G. Zheng, J. Liu, J. Yang, and X. Li, “Automatically locate tropical cyclone centers using top cloud motion data derived from geostationary satellite images,” IEEE Transactions on Geoscience and Remote Sensing, vol. 57, no. 12, pp. 10175–10190, Dec. 2019,
[11] H. Wang, Q. Xu, X. Yin, and Y. Cheng, “Determination of Low-Intensity Tropical Cyclone Centers in Geostationary Satellite Images Using a Physics-Enhanced Deep-Learning Model,” IEEE Transactions on Geoscience and Remote Sensing, vol. 62, pp. 1–10, 2024,
[12] S. Jin, S. Wang, and X. Li, “Typhoon eye extraction with an automatic SAR image segmentation method,” Int. J. Remote Sens., vol. 35, no. 11–12, pp. 3978–3993, Jun. 2014,
[13] G. Zheng, J. Yang, A. K. Liu, X. Li, W. G. Pichel, and S. He, “Comparison of Typhoon Centers From SAR and IR Images and Those From Best Track Data Sets,” IEEE Transactions on Geoscience and Remote Sensing, vol. 54, no. 2, pp. 1000–1012, Feb. 2016,
[14] A. K. Liu, S. He, Y. Pan, and J. Yang, “Observations of typhoon eye using SAR and IR sensors,” Int. J. Remote Sens., vol. 35, no. 11–12, pp. 3966–3977, Jun. 2014,
[15] I. K. Lee, A. Shamsoddini, X. Li, J. C. Trinder, and Z. Li, “Extracting Hurricane Eye Morphology from Spaceborne SAR Images Using Morphological Analysis,” Springer, Singapore, 2017, pp. 119–139.
[16] S. Jin, S. Wang, X. Li, L. Jiao, and J. A. Zhang, “Tropical Cyclone Center Location in SAR Images Based on Feature Learning and Visual Saliency,” 2017, pp. 141–181.
[17] Q. Xu, X. Li, S. Bao, and G. Zhang, “Tropical Cyclone Eye Morphology and Extratropical-Cyclone-Forced Mountain Lee Waves on SAR Imagery,” Springer, Singapore, 2017, pp. 373–398.
[18] I. Brajević and P. Stanimirović, “An improved chaotic firefly algorithm for global numerical optimization,” International Journal of Computational Intelligence Systems, vol. 12, no. 1, pp. 131–148, Nov. 2018,
[19] X. S. Yang, Nature-Inspired Optimization Algorithms. 2014.
Cite This Article
  • APA Style

    Nyabuga, D. O. (2026). An Efficient Tropical Cyclone Center Prediction Scheme Using Firefly Algorithm in Infrared Image (IR). American Journal of Science, Engineering and Technology, 11(3), 149-158. https://doi.org/10.11648/j.ajset.20261103.15

    Copy | Download

    ACS Style

    Nyabuga, D. O. An Efficient Tropical Cyclone Center Prediction Scheme Using Firefly Algorithm in Infrared Image (IR). Am. J. Sci. Eng. Technol. 2026, 11(3), 149-158. doi: 10.11648/j.ajset.20261103.15

    Copy | Download

    AMA Style

    Nyabuga DO. An Efficient Tropical Cyclone Center Prediction Scheme Using Firefly Algorithm in Infrared Image (IR). Am J Sci Eng Technol. 2026;11(3):149-158. doi: 10.11648/j.ajset.20261103.15

    Copy | Download

  • @article{10.11648/j.ajset.20261103.15,
      author = {Douglas Omwenga Nyabuga},
      title = {An Efficient Tropical Cyclone Center Prediction Scheme Using Firefly Algorithm in Infrared Image (IR)},
      journal = {American Journal of Science, Engineering and Technology},
      volume = {11},
      number = {3},
      pages = {149-158},
      doi = {10.11648/j.ajset.20261103.15},
      url = {https://doi.org/10.11648/j.ajset.20261103.15},
      eprint = {https://article.sciencepublishinggroup.com/pdf/10.11648.j.ajset.20261103.15},
      abstract = {Tropical cyclones have a strong potential to bring significant economic loss to cyclone-prone areas. Locating the tropical cyclone center is significant and necessary for the timely forecasting of tropical cyclones. The observation of the typhoon's center, primarily carried out through the use of infrared (IR) images, is not easy. In some situations, the typhoon center is identified by the typhoon eye, which is overlaid on an infrared image. Therefore, the purpose of this study is to address the challenges of tropical cyclone center localization in infrared images by developing a firefly algorithm-based optimization scheme for accurate center prediction. This research proposes an efficient tropical cyclone center prediction scheme with optimization performed by the firefly algorithm to predict the central point in tropical cyclone infrared images. In addition, problems associated with pattern matching and other localization challenges are addressed through the optimization process to obtain the most accurate tropical cyclone center. Finally, the proposed scheme achieved highly accurate center localization. The proposed approach contributes to the scientific community by providing an optimization-based framework for tropical cyclone center localization that can support future research in automated cyclone analysis, infrared satellite image processing, and the development of more reliable tropical cyclone forecasting methods.},
     year = {2026}
    }
    

    Copy | Download

  • TY  - JOUR
    T1  - An Efficient Tropical Cyclone Center Prediction Scheme Using Firefly Algorithm in Infrared Image (IR)
    AU  - Douglas Omwenga Nyabuga
    Y1  - 2026/08/18
    PY  - 2026
    N1  - https://doi.org/10.11648/j.ajset.20261103.15
    DO  - 10.11648/j.ajset.20261103.15
    T2  - American Journal of Science, Engineering and Technology
    JF  - American Journal of Science, Engineering and Technology
    JO  - American Journal of Science, Engineering and Technology
    SP  - 149
    EP  - 158
    PB  - Science Publishing Group
    SN  - 2578-8353
    UR  - https://doi.org/10.11648/j.ajset.20261103.15
    AB  - Tropical cyclones have a strong potential to bring significant economic loss to cyclone-prone areas. Locating the tropical cyclone center is significant and necessary for the timely forecasting of tropical cyclones. The observation of the typhoon's center, primarily carried out through the use of infrared (IR) images, is not easy. In some situations, the typhoon center is identified by the typhoon eye, which is overlaid on an infrared image. Therefore, the purpose of this study is to address the challenges of tropical cyclone center localization in infrared images by developing a firefly algorithm-based optimization scheme for accurate center prediction. This research proposes an efficient tropical cyclone center prediction scheme with optimization performed by the firefly algorithm to predict the central point in tropical cyclone infrared images. In addition, problems associated with pattern matching and other localization challenges are addressed through the optimization process to obtain the most accurate tropical cyclone center. Finally, the proposed scheme achieved highly accurate center localization. The proposed approach contributes to the scientific community by providing an optimization-based framework for tropical cyclone center localization that can support future research in automated cyclone analysis, infrared satellite image processing, and the development of more reliable tropical cyclone forecasting methods.
    VL  - 11
    IS  - 3
    ER  - 

    Copy | Download

Author Information
  • Information Technology Department, Mount Kigali University, Kigali, Rwanda

    Biography: Douglas Omwenga Nyabuga is a lecturer, postgraduate and undergraduate lecturer in the university level. He holds a PhD in Enterprise Information Systems and Engineering from Donghua University, China, Masters in Computer Science from Periyar University, India. Published more than 15 academic papers in academic journals and conferences. He has been included in many papers by SCI and EI. Dr. Douglas’ main research directions are; Human-Computer Interaction (mainly Education systems), Image Processing, Remote Sensing, Pattern Recognition, and Machine Learning. He is a distinguished Reviewer at IET Image Processing journal, IAES International Journal of Artificial Intelligence (IJ-AI), and a Programme Committee member for the International Conference on Artificial Neural Networks. My research interest focuses on utilizing computing and remote sensing techniques to solve problems related to natural resource management, ecology, natural disaster mapping, vegetation property extraction, and urban remote sensing.

    Research Fields: Human-Computer Interaction (mainly Education systems), Image Processing, Remote Sensing, Pattern Recognition, Machine Learning, and Artificial Intelligence.