Abstract
Background: Price changes in economics present significant geometric challenges due to sharp discontinuities, which cannot be efficiently described by continuous processes like Brownian motion. Traditional models often rely on linear assumptions, yet financial data frequently exhibit irregular, complex patterns. Fractal theory, a mathematical framework, offers a more accurate way to describe these fluctuations by revealing the underlying self-similar structures in price changes and scaling phenomena. This study explores the use of fractal geometry to gain deeper insights into market behavior. Objective: The objective is to demonstrate that an alternative model, constructed based on geometric scaling assumptions, offers a more accurate description of price changes in competitive markets. Method: The study combined the scaling principle from fractal geometry with a stable Levy model to formulate an integrated model. The logarithmic transformation of the model was applied over successive price changes to observe the behavior of market prices. Result: The scaling principle asserts that no specific time interval (such as a day or a week) holds inherent significance in competitive markets. Instead, these time features are compensated or arbitrated away, supporting the idea that market behavior is self-similar across different time scales. Conclusion: The scaling principle provides a more reliable framework for modeling price changes and is recommended for consideration in economic analyses.
Keywords
Fractal Theory, Scaling Principle, Levy Model, Price Changes
1. Introduction
In economics, understanding price changes and scaling phenomena is essential for both theoretical insights and practical applications. Scaling is a fundamental concept in geometry and mathematics, with applications that extend to financial markets,
. Uniform (or isotropic) scaling is a linear transformation that changes the size of an object while maintaining its shape, whereas non-uniform (anisotropic) scaling alters the object’s shape by applying different scale factors along different directions. These scaling concepts form the basis for analyzing geometric changes over time, which also apply to financial models of price changes.
| [2] | Sung M-C, McDonald DCJ, Johnson JEV, Tai C-C, Cheah E-T Improving prediction market forecasts by detecting and correcting possible over-reaction to price movements. Eur J Oper Res 272(1): 389-405. 2019. https://doi.org/10.1016/j.ejor.2018.06.024 |
| [14] | Wu, Y., Hernández-Lobato, J. M., Ghahramani, Z. Gaussian process volatility model. In: Abstracts of the Advances in Neural Information Processing Systems 2014, Montreal, Quebec, Canada, 8-13 December 2014. |
[2, 14]
To model real-world processes, economists often use the Gaussian process and Brownian motion,
| [2] | Sung M-C, McDonald DCJ, Johnson JEV, Tai C-C, Cheah E-T Improving prediction market forecasts by detecting and correcting possible over-reaction to price movements. Eur J Oper Res 272(1): 389-405. 2019. https://doi.org/10.1016/j.ejor.2018.06.024 |
| [3] | Mushunje L, Mashasha M, Chandiwana E. Estimating short-term returns with volatilities for high frequency stock trades in emerging economies using Gaussian processes (GPs). IntechOpen ebooks, 2021. https://doi.org/10.5772/intechopen.96486 |
| [8] | Taylor SJ. Modeling stochastic volatility: A review and comparative study. Math Finance 4(2): 183-204. https://doi.org/10.1111/j.1467-9965.1994.tb00057.x.1994 |
| [9] | Hussain, Murthy, Singh. Stock market volatility: A review of the empirical literature. IUJ J. Manag., 7, 96–105. 2019. |
| [10] | Bhowmik, Wang. Stock market volatility and return analysis: A systematic literature review. Entropy 2020, 22, 522; https://doi.org/10.3390/e22050522. |
| [12] | Tang Y, Whitelaw RF .Time-Varying Sharpe Ratios and Market Timing. QJ Finance01(03):465-493. 2011. https://doi.org/10.1142/S2010139211000122 |
[2, 3, 8, 9, 10, 12]
. Brownian motion, a type of stochastic process, is key to modeling seemingly random fluctuations in price movements. The Gaussian process, closely related to Brownian motion, describes these fluctuations under the assumption of normally distributed price changes. However, conventional Gaussian models fail to fully capture extreme price changes or market volatility, leading to inaccuracies in predicting long-term trends.
Fractal theory, introduced by Benoit Mandelbrot,
| [5] | Mandelbrot, B. B. The fractal geometry of nature. New York: Time Books; 1997. |
[5]
, provides an alternative to traditional models. Fractals exhibit self-similarity at different scales, meaning that patterns in price movements, when magnified, resemble those observed over different timeframes. This property aligns with the non-differentiability seen in Brownian motion, where certain financial processes display infinite lengths and unpredictable behavior. The heavy-tailed distributions found in fractal models suggest that extreme market events are more common than conventional Gaussian models would predict, providing a more robust framework for risk management and market analysis.
Fractal geometry has been successfully applied in diverse fields, including biology, urban planning, and finance. For example, Akthtar
et al. | [6] | Akthtar N, Rajput Y, Tharewal S, Kale K. V, Mansa R. Fractal for Complexity Analysis of Diabetic Retinopathy in Retina Vasculature Images. International Journal of Research in Engineering and Technology. 2014; https://doi.org/10.15623/ijret.2014.0303125 |
[6]
used fractal dimensions to measure complexity in blood vessel distribution in diabetic patients, while Chen
applied fractal analysis to urban morphology. Jahanmiri
et al gasve an overview analysis of fractal geometry in urban development and planning. In finance, fractal analysis reveals the complexity of market behavior and price changes over time. Verma
et al. | [11] | Verma S. K, Kumar S. Fractal dimension analysis of stock prices of selected resulting companies after mergers and acquisitions. European Physical Journal Special, 2023; vol. 232, pp1093-1103. |
[11]
investigated mergers and acquisitions using fractal interpolation, while Yue and Chen
introduced fractal derivatives into bond-pricing models, showing that these models more accurately predict price changes than classical methods.
The objective of this study is to explore the relationship between scaling principles, fractal theory, and price changes in financial markets. We aim to connect the geometric challenge of price changes to scaling principles, including Brownian motion and the Gaussian process, to develop a more accurate model for predicting price movements over time. Through the lens of fractal geometry, this research will shed light on the limitations of traditional models and propose a new, more reliable approach to forecasting price trends in financial markets.
Definitions:
1. Fractal Dimension: Unlike regular geometric shapes, fractals have non-integer dimensions, known as fractal dimensions. This dimension quantifies the complexity of the fractal pattern. In economic terms, the fractal dimension of a price series can help quantify market volatility and risk.
2. Scaling Laws: Fractal theory introduces the idea of scaling laws, which describe how certain properties of the fractal change with scale. In economics, scaling laws can describe how price volatility or trading volume changes across different time periods.
3. Logarithmic time scale: Is a nonlinear scale used to represent time intervals, where each unit increase on the scale corresponds to a multiplication of the actual time interval by a constant factor. In this scale, equal distances on the graph represent equal ratios of time, rather than equal differences. This is particularly useful for examining data that spans multiple orders of magnitude, allowing for the visualization of both short-term and long-term patterns on the same plot.
4. First Test of Stationary: Is the Augmented Dickey-Fuller (ADF) test use in checking if the properties such as mean and variance are constant over time.
5. Second Test of Stationary: Is the Phillips-Perron (PP) test which is a modified ADF test. The PP test is designed to handle serial correlation and heteroscedasticity in the error terms of the time series. It is a non-parametric method, meaning it does not require specifying the lag length for the test regression. The PP test adjusts the test statistics of the Dickey-Fuller test to account for any autocorrelation and heteroscedasticity in the residuals.
2. Methodology
We are leveraging on the self-similarity properties of fractals. A logarithm of scale allows these repeating patterns to be visualized more effectively. To define our fractal function.
Let a set of data points
| [11] | Verma S. K, Kumar S. Fractal dimension analysis of stock prices of selected resulting companies after mergers and acquisitions. European Physical Journal Special, 2023; vol. 232, pp1093-1103. |
[11]
(1)
We define set
Let be a contraction homeomorphism
(2)
Also, let consider which contraction are in the second coordinate.
such that
(3)
And satisfies the join- up conditions.
(4)
are the vertical scaling vector. Let
(5)
is an iterated function system with a unique attractor which is the graph of the continuous function satisfying the interpolation points given by
(6)
Which implies that
is the logarithm of the price at a specific time t. The difference represents the percentage change in price over the time period from t to t + d. We assume that has an infinite variance.
Let the price change be modeled as a Levy process with a characteristic function
(8)
Where is the drift, is the variance, is the Levy measure capturing the jump intensity and size.
Let H be (Hurst parameter), the similarity exponent that characterizes the fractal dimension of the price path.
Let , where scales the Levy process, ,
Therefor where is the drift parameter, is the fractal scaling, L(t) is the Levy process.
Experimentation: If price changes have an infinite variance, it suggests that prices can exhibit sudden and extreme changes, much more so than usual. This might happen in markets that are highly speculative or during times of financial crisis. It implies that the usual models for predicting price changes might not work well because the price behavior is too erratic. In our model, infinite variance is more acceptable because it preserves scaling. Scaling principle is combined with the stable Levy model- idea that successive price change is independent with vanishing expectation and further allows the variance changes to be infinite. The predictive value of the scaling principle of price change resides in the following finding.
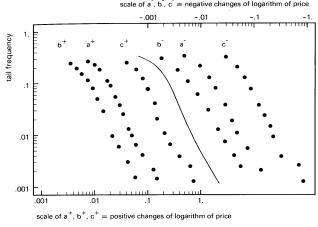
We combine doubly logarithmic graphs of positive and negative tails for the recorded changes in the logarithm of cocoa price, together with the cumulated density function of the symmetric stable distribution of exponent α = 1.7 which is slightly over estimated value of α. The ordinate gives the relative frequency of cases where the change of one quantity X defined below exceeds the change in x coordinate.
The following series of data are plotted, the positive and negative values of X being treated separately in both cases.
where Z is the daily closing price of cocoa at the Abuja Securities and Commodity Exchange Market ASCE
| [4] | Abuja Security and Commodity Exchange (ASCE) – Index on Commodity Pricing. |
[4]
. (data from ASCE 2009- 2013)
where Z is an index of daily closing price of cocoa.
| [4] | Abuja Security and Commodity Exchange (ASCE) – Index on Commodity Pricing. |
[4]
(data from ASCE 1999 - 2013)
where Z is the closing price of cocoa on the 15
th of each month at the Abuja Securities and Commodity Exchange Market ASCE.
| [4] | Abuja Security and Commodity Exchange (ASCE) – Index on Commodity Pricing. |
[4]
(data from ASCE 1982- 2012)
Figure 1. Series Plot of Different Cases.
3. Discussion
The study evaluates the distribution of daily price changes, daily index, and monthly averages using data collected over different time periods. The analysis employs the Gaussian process, Brownian motion, and the scaling principle to test the stationarity of price changes.
1. Daily Price Changes Distribution (5 years): The results show that, when extrapolated to monthly price changes, the distribution cuts through periods of economic downturns such as recessions and depressions. The process behind price changes for commodities like cocoa remains stationary, with no significant shifts over the long term, as indicated by the stability of the parameter (α). Despite fluctuations in currency values and other macroeconomic factors, the analytic form of the process remains unchanged.
2. Daily Index on Various Exchanges (14 years): The distribution of daily index values across exchanges indicates consistent scaling properties across different time frames. Upon review, the dataset reflects a 14-year period, as evidenced by the historical records.
3. Monthly Averages (60 years): The monthly average data extends over a 60-year period. The stationarity of this data over the long term confirms the negligible overall trends compared to fluctuations in daily price movements.
4. Stationarity Test Results
First Test of Stationarity: The parameter (α) (approximately 1.7) remains constant over time. This shows that the process ruling price changes does not evolve over the period studied, supporting the hypothesis of long-term stationarity.
Second Test of Stationarity: After correcting the error in reading the data for curves (a+) and (a-), the curves align almost perfectly with (b+) and (b-). The original discrepancy arose due to a misreading of the data, which exaggerated the appearance of non-stationarity.
The distribution of daily price changes over 5 years, the daily index data over 14 years and the monthly averages for 60 years.
Figure 1 illustrates the doubly logarithmic scaling of price changes, showing both the positive and negative curves for cocoa prices. These curves superimpose upon one another after correcting the error in curve (a+), aligning with the expected symmetric stable distribution. Though currency values and other economic factors have fluctuated, the stability of the parameter (α), estimated at approximately 1.7, was confirmed using the [statistical method], providing evidence that the process governing price changes is stationary.
Figure 1 supports the findings from the second test of stationarity. It shows that once the error in the reading of data behind curves (a+) and (a-) was corrected, the curves nearly overlap with (b+) and (b-), validating the stationarity of the process. The analysis combines logarithmic graphs of positive and negative fluctuations in cocoa prices with the cumulative density function of the symmetric stable distribution. The slight discrepancies between the empirical graphs and theoretical models suggest that the distribution may be slightly asymmetric, indicating the need for a skewed variant of the stable distribution.
5. Conclusion
The study explored the geometric challenge of price changes by examining the limitations of traditional Gaussian processes and Brownian motion, proposing instead the use of a stationary, non-Gaussian stable process. While Brownian motion is often used to approximate price changes in competitive markets, our analysis demonstrated that it fails to capture the discontinuous nature of price formation, particularly in times of market shocks or significant anticipation shifts.
Our findings confirmed that price changes, when scaled appropriately across various timeframes, exhibit patterns that deviate from the smooth, continuous sample paths of Brownian motion. The scaling principle suggests that no specific time lag (whether a day, week, or year) holds a distinct advantage in competitive markets. By applying this principle, we showed that the distribution of daily, weekly, and monthly price changes for cocoa prices remains stable, despite fluctuations in the market.
6. Key Findings
1. Gaussian Process vs. Stable Process: Our results demonstrate that a non-Gaussian stable process more accurately reflects the nature of price changes than the traditional Gaussian process, particularly in volatile market conditions.
2. Stationarity: The price formation process for cocoa remained stationary over the long term, as indicated by the consistent value of the scaling parameter (α) across different timeframes.
3. Scaling: The analysis of ASCE cocoa stock price data across different time scales (daily, weekly, and monthly) supports the conclusion that price changes can be better understood through the scaling principle, where self-similarity emerges at multiple timeframes.
7. Recommendations
Model Integration: Future research should incorporate the developed model into real-time trading strategies, especially in markets with high volatility. This could lead to more accurate predictions of price changes.
Practical Applications: Risk managers and investors should consider using fractal-based models to anticipate extreme market events, as the heavy tails in non-Gaussian distributions imply a higher likelihood of drastic price changes.
Further Analysis: It is recommended to expand this analysis to other commodities and indices, applying the scaling principle and stable process to different timeframes to validate the findings across broader financial datasets.
In conclusion, this research offers an alternative framework to traditional Gaussian models, highlighting the importance of stationarity and scaling in understanding price changes in competitive markets. By integrating this model with the ASCE cocoa stock price data, we demonstrated the practical value of applying fractal theory to market analysis, which can ultimately enhance decision-making for investors and financial analysts.
Abbreviations
ASCE | Abuja Stock and Commodity Exchange |
Author Contributions
Abimbola Latifat Adebisi: Conceptualization, methodology
Taiwo Mobolaji Adegoke: statistical analysis and data sourcing
Oladapo Muyiwa Oladoja: Experimentation and manuscript writing
Funding
This work is not supported by any form of funding both internal and external.
Data Availability Statement
The data is available from the corresponding author upon reasonable request.
Conflicts of Interest
The authors declare no conflicts of interest.
References
| [1] |
Antoine D, Sebestian P, Lionel P. The complexity of geometric scaling. Optimization and Control, 2023.
https://doi.org/10.1016/j.orl.2023.11.010
|
| [2] |
Sung M-C, McDonald DCJ, Johnson JEV, Tai C-C, Cheah E-T Improving prediction market forecasts by detecting and correcting possible over-reaction to price movements. Eur J Oper Res 272(1): 389-405. 2019.
https://doi.org/10.1016/j.ejor.2018.06.024
|
| [3] |
Mushunje L, Mashasha M, Chandiwana E. Estimating short-term returns with volatilities for high frequency stock trades in emerging economies using Gaussian processes (GPs). IntechOpen ebooks, 2021.
https://doi.org/10.5772/intechopen.96486
|
| [4] |
Abuja Security and Commodity Exchange (ASCE) – Index on Commodity Pricing.
|
| [5] |
Mandelbrot, B. B. The fractal geometry of nature. New York: Time Books; 1997.
|
| [6] |
Akthtar N, Rajput Y, Tharewal S, Kale K. V, Mansa R. Fractal for Complexity Analysis of Diabetic Retinopathy in Retina Vasculature Images. International Journal of Research in Engineering and Technology. 2014;
https://doi.org/10.15623/ijret.2014.0303125
|
| [7] |
Chen, Y. Fractal modelling and fractal dimension description of urban morphology. Entropy. 2020; 22(9), 961,
https://doi.org/10.3390/e22090961
|
| [8] |
Taylor SJ. Modeling stochastic volatility: A review and comparative study. Math Finance 4(2): 183-204.
https://doi.org/10.1111/j.1467-9965.1994.tb00057.x.1994
|
| [9] |
Hussain, Murthy, Singh. Stock market volatility: A review of the empirical literature. IUJ J. Manag., 7, 96–105. 2019.
|
| [10] |
Bhowmik, Wang. Stock market volatility and return analysis: A systematic literature review. Entropy 2020, 22, 522;
https://doi.org/10.3390/e22050522.
|
| [11] |
Verma S. K, Kumar S. Fractal dimension analysis of stock prices of selected resulting companies after mergers and acquisitions. European Physical Journal Special, 2023; vol. 232, pp1093-1103.
|
| [12] |
Tang Y, Whitelaw RF .Time-Varying Sharpe Ratios and Market Timing. QJ Finance01(03):465-493. 2011.
https://doi.org/10.1142/S2010139211000122
|
| [13] |
Yue C, Shen C. Lie symmetry Analysis for the fractal bond-pricing model of mathematical finance. Journal of Mathematical Finance. 2024;
https://doi.org/10.1155/2024/9926131
|
| [14] |
Wu, Y., Hernández-Lobato, J. M., Ghahramani, Z. Gaussian process volatility model. In: Abstracts of the Advances in Neural Information Processing Systems 2014, Montreal, Quebec, Canada, 8-13 December 2014.
|
| [15] |
Jahanmiri F, Parker D. C. An overview of fractal geometry applied to urban planning. Land 2022, 11, 475.
https://doi.org/10.3390/land11040475
|
Cite This Article
-
APA Style
Abimbola, L. A., Adegoke, T. M., Oladoja, O. M. (2024). Applying Fractal Theory: Solving the Geometric Challenge of Price Change and Scaling in Economics. American Journal of Theoretical and Applied Statistics, 13(5), 175-180. https://doi.org/10.11648/j.ajtas.20241305.16
 Copy
|
Copy
|
 Download
ACS Style
Abimbola, L. A.; Adegoke, T. M.; Oladoja, O. M. Applying Fractal Theory: Solving the Geometric Challenge of Price Change and Scaling in Economics. Am. J. Theor. Appl. Stat. 2024, 13(5), 175-180. doi: 10.11648/j.ajtas.20241305.16
Copy
|
Download
AMA Style
Abimbola LA, Adegoke TM, Oladoja OM. Applying Fractal Theory: Solving the Geometric Challenge of Price Change and Scaling in Economics. Am J Theor Appl Stat. 2024;13(5):175-180. doi: 10.11648/j.ajtas.20241305.16
Copy
|
Download
-
@article{10.11648/j.ajtas.20241305.16,
  author = {Latifat Adebisi Abimbola and Taiwo Mobolaji Adegoke and Oladapo Muyiwa Oladoja},
  title = {Applying Fractal Theory: Solving the Geometric Challenge of Price Change and Scaling in Economics},
  journal = {American Journal of Theoretical and Applied Statistics},
  volume = {13},
  number = {5},
  pages = {175-180},
  doi = {10.11648/j.ajtas.20241305.16},
  url = {https://doi.org/10.11648/j.ajtas.20241305.16},
  eprint = {https://article.sciencepublishinggroup.com/pdf/10.11648.j.ajtas.20241305.16},
  abstract = {Background: Price changes in economics present significant geometric challenges due to sharp discontinuities, which cannot be efficiently described by continuous processes like Brownian motion. Traditional models often rely on linear assumptions, yet financial data frequently exhibit irregular, complex patterns. Fractal theory, a mathematical framework, offers a more accurate way to describe these fluctuations by revealing the underlying self-similar structures in price changes and scaling phenomena. This study explores the use of fractal geometry to gain deeper insights into market behavior. Objective: The objective is to demonstrate that an alternative model, constructed based on geometric scaling assumptions, offers a more accurate description of price changes in competitive markets. Method: The study combined the scaling principle from fractal geometry with a stable Levy model to formulate an integrated model. The logarithmic transformation of the model was applied over successive price changes to observe the behavior of market prices. Result: The scaling principle asserts that no specific time interval (such as a day or a week) holds inherent significance in competitive markets. Instead, these time features are compensated or arbitrated away, supporting the idea that market behavior is self-similar across different time scales. Conclusion: The scaling principle provides a more reliable framework for modeling price changes and is recommended for consideration in economic analyses.},
 year = {2024}
}
Copy
|
Download
-
TY  - JOUR
T1  - Applying Fractal Theory: Solving the Geometric Challenge of Price Change and Scaling in Economics
AU  - Latifat Adebisi Abimbola
AU  - Taiwo Mobolaji Adegoke
AU  - Oladapo Muyiwa Oladoja
Y1  - 2024/10/31
PY  - 2024
N1  - https://doi.org/10.11648/j.ajtas.20241305.16
DO  - 10.11648/j.ajtas.20241305.16
T2  - American Journal of Theoretical and Applied Statistics
JF  - American Journal of Theoretical and Applied Statistics
JO  - American Journal of Theoretical and Applied Statistics
SP  - 175
EP  - 180
PB  - Science Publishing Group
SN  - 2326-9006
UR  - https://doi.org/10.11648/j.ajtas.20241305.16
AB  - Background: Price changes in economics present significant geometric challenges due to sharp discontinuities, which cannot be efficiently described by continuous processes like Brownian motion. Traditional models often rely on linear assumptions, yet financial data frequently exhibit irregular, complex patterns. Fractal theory, a mathematical framework, offers a more accurate way to describe these fluctuations by revealing the underlying self-similar structures in price changes and scaling phenomena. This study explores the use of fractal geometry to gain deeper insights into market behavior. Objective: The objective is to demonstrate that an alternative model, constructed based on geometric scaling assumptions, offers a more accurate description of price changes in competitive markets. Method: The study combined the scaling principle from fractal geometry with a stable Levy model to formulate an integrated model. The logarithmic transformation of the model was applied over successive price changes to observe the behavior of market prices. Result: The scaling principle asserts that no specific time interval (such as a day or a week) holds inherent significance in competitive markets. Instead, these time features are compensated or arbitrated away, supporting the idea that market behavior is self-similar across different time scales. Conclusion: The scaling principle provides a more reliable framework for modeling price changes and is recommended for consideration in economic analyses.
VL  - 13
IS  - 5
ER  -
Copy
|
Download