Research Article | | Peer-Reviewed

Change-Point Detection with ARIMA of Inflation Rate in Ghana

Received: 8 March 2026     Accepted: 30 March 2026     Published: 15 April 2026
Views:       Downloads:
Abstract

Change-point detection is the point or location in the series where the observations of that series are shifted to another point. Inflation is considered as one of the most important determinants of economic growth and also a key macroeconomic indicator which shows how prices of goods change from one period to another and this plays a critical role in economic stability and growth. The study therefore, aimed to determine structural change-point(s) of the inflation rate in Ghana, which will serve as an essential source of information to guide policy direction. Annual data on Ghana’s inflation rate were sourced from the World Bank website covering the years 1965-2025. To remove the effect of serial correlation since the inflation data was collected over time, an ARIMA model was considered and the errors which were independent and identically distributed, were extracted for multiple change point procedures. Change point methods considered were the Cumulative Sum (CUSUM) Test, the Binary Segmentation (BS) Method and the Pruned Exact Linear Time (PELT) Algorithm. We sought to determine change points in mean, variance (risk) and mean-variance jointly since they are the basic measured quantities for econometric analysis. Results show that the mean change point was detected at time (index) 12, which represents the year 1976, corresponding to Ghana’s mid-1970s macroeconomic instability. Variance (risk) change points were detected at time points 37 and 56, which represent the years 2001 and 2020, respectively corresponding to times of fiscal stress (Ghana joining the Heavily Indebted Poor Countries (HIPC)), electoral spending and COVID-19 shock. The mean-variance change points were also detected at time points 10 and 20, which represent the years 1974 and 1984, respectively aligning with the oil shock era and the economic recovery programme (ERP) regime. The study showed that Ghana’s inflation process has experienced multiple structural shifts associated with major economic shocks and policy transitions. It is highly recommended that credible macroeconomic management and fiscal discipline be adhered to during structural changes.

Published in American Journal of Theoretical and Applied Statistics (Volume 15, Issue 2)
DOI 10.11648/j.ajtas.20261502.13
Page(s) 47-58
Creative Commons

This is an Open Access article, distributed under the terms of the Creative Commons Attribution 4.0 International License (http://creativecommons.org/licenses/by/4.0/), which permits unrestricted use, distribution and reproduction in any medium or format, provided the original work is properly cited.

Copyright

Copyright © The Author(s), 2026. Published by Science Publishing Group

Keywords

Inflation, Change Point, CUSUM, Binary Segmentation, Pruned Exact Linear Time

1. Introduction
Change happens to every phenomenon of life. The dynamic nature of the world results in changes in all facets of life. Many practical areas in statistics require the detection of the number of jumps or change-points and where they are located . This brings us to the area in statistics known as change point detection.
A change-point is an area where observations follow a pattern of one distribution to the point of detection and then change to another, or the identification of a time point when a new model differentiates itself from the old model. Similarly, for several change-points detection, the researcher seeks for the evaluation of numerous change-points and the locations at which they occur. Therefore, the change-point location problem can be classified into two ways thus the detection of the change and secondly, where it occurs . Depending on the assumptions of the structure of the data, change point methods can be parametric, non-parametric and semi-parametric. Change point detection has many attractive application areas, such as in climate change detection, medical condition monitoring, image processing, speech recognition, finance, engineering sciences, etc .
Change-point detection is also a sub-area of statistical process control. In statistical process control, the techniques of control charts are now becoming an integral part of efficient monitoring of quality traits, which show how processes change from one point to another in an orderly manner. Modern statistical process control shows practicability and efficiency for solving quality problems. Basically, control charts are put into two broad types based on the way they are formulated, namely those with memory and those without-memory. The local or without-memory is where their statistical plots and the given verdict rules are based on their last observations, and an example of such a chart is the Shewhart chart. On the other hand, those with memory, examples of such charts are Exponentially Weighted Moving Average (EWMA) and Cumulative Sum (CUSUM) charts. Memory charts are uniquely made for their plots to use far and immediate observations, and for that matter, they are more attractive as compared to Shewhart charts and they have the capacity to detect small and intermediate differences .
Inflation is the change in the rate at which price levels of goods and services rise. It is an important economic indicator that shows the impact of a country’s economic stability and growth. Ghana, like many other economies, experiences fluctuations in its inflation rate over time. Inflation rate can affect all areas of the economy, from producers to consumer’s spending, businesses, investments, tax and non-tax payers. Many Ghanaian businesses have collapsed as a result of fluctuations in inflation rate of Ghana . Again, Ghana, like other developing countries, is struggling to find means of stabilising its inflation rate.
There are four main theories of inflation. These are the Monetarist’s theory of inflation, the Structuralist’s theory of inflation, the Classical theory of inflation and the Keynesian`s theory of inflation. Monetarists pinpoint that inflation is caused by money supply outgrowing economic output. Thus, from the approach of monetarists, the change of price levels of goods and services will only happen if there is a change in the amount of money in circulation in the economic system . From the structuralist’s point of view, inflation is considered to be the reaction from structural bottlenecks, sectoral imbalances and institutional weaknesses that limit supply while demand continues to rise. This type of theory was mainly formulated to explain persistent inflation in Africa and Latin America. From the classical point of view, inflation can be explained by the amount of money in circulation in the economic system. This means that the higher the money in circulation in the system, the higher the inflation . The Keynesians believe that inflation is mainly caused by excess aggregate demand in an economic system where the economy is operating close to full employment. It is the viewpoint of the Keynesians that when the total demand for goods and services exceeds the country’s productive capacity, prices begin to escalate.
Junttila used ARIMA model to determine structural breaks in Finnish inflation forecast. Adu and Marbuah studied the determinants of inflation in Ghana using both monetary and structural factors. Algidede conducted a regional analysis of inflation and found that inflation exhibits high persistence and structural variations across time. However, these studies did not center on multiple change-point estimation in the mean and variance of inflation.
Understanding the change-points of Ghana’s inflation rate history makes it appropriate for policymakers, investors and business ventures to make informed decisions and develop effective strategies. Change-point detection is an important as well as a pending problem in statistics and its related fields of study. Quality control research aims to detect the change in the given data of the distribution as fast as possible when the change has just occurred in order to reduce the false alarm rate.
There are limited studies using multiple change-point methods to detect structural changes of the inflation rate of Ghana. The change-point problem here is identifying the right methods and detecting changes in inflation rates of Ghana in terms of mean, variance and mean-variance jointly. In order to achieve this, there is a need to identify significant structural transitions in the inflation rate time series data. This study therefore, sought to detect key change-points of the inflation rate of Ghana in terms of mean, variance and mean-variance jointly over the past years using the Cumulative Sum (CUSUM) test, the Binary Segmentation (BS) method and the Pruned Exact Linear Time (PELT) method. By detecting these change-points, economists and policymakers can better understand the underlying drivers of the inflation rate of Ghana and make an informed decision to manage the economy effectively.
2. Materials and Methods
Change-point detection (CPD) is a field of study in statistics that is strongly in line with the statistical process control problem. In CPD, we are interested in estimating the change-point location of a given series of random variables. The sample size in CPD is typically predetermined. The maximum likelihood estimation approach is then used to estimate the change-point once it is assumed that the two associated distributions have some parametric shapes .
Annual data on Ghana’s inflation rate were sourced from the World Bank website, covering the years 1965-2025. Stationarity tests like Augmented Dickey-Fuller (ADF) and Kwiatkowski, Phillips, Schmidt and Shin (KPSS) were carried out to ensure that the series were stationary. The data was converted to errors through the ARIMA model in order to remove any effect of serial correlation since the observations were collected in time. The errors from the ARIMA model were diagnosed to ensure they are white noise.
2.1. Autoregressive Integrated Moving Average Model
Box-Jenkins Autoregressive Integrated Moving Average (p, d, q) or ARIMA (p, d, q) model includes the autoregressive process of order p, the differencing of order d, and the moving average process of order q. A difference stationary series is said to be integrated and is denoted as I (d), where d is the order of integration. This is modelled as ARIMA (p, d, q).
The ARIMA (p, d, q) model can be written as;
Φ(B)(1-B)dyt =θBԑt (1)
The Autoregressive and Moving operator are defined as follows,
Φ(B = 1- Φ(B) - Φ2B2--ΦpBp(2)
θB= 1+ θB+θ2B2++θqBq(3)
Where Φ(B) ≠ 0 for |ϕ| < 1, the process is stationary if = 0 in that case it reduces to an ARMA process.
θi are the parameters of the Autoregressive (AR) part of the model,
Φi are the parameters of the Moving Average (MA) process,
and ԑare the error terms.
2.2. Model Diagnostics
Model diagnostics are procedures used to check whether all the time series assumptions were met. The estimated model must be checked to verify if it adequately satisfies all the model assumptions. Diagnostic checks are performed on the residuals to see if they are random, normally distributed and free from autocorrelation.
The Ljung-Box Test assesses the presence of serial correlation in the residuals of a time series model. The test statistic (Q) is calculated based on the sample size (n), the number of lags (k) being tested and (h) is the sample autocorrelation function (ACF) at each lag.
The Ljung-Box test statistic (Q) is calculated using
Q=nn+2k=1 hρk2n-k(4)
where
n is the sample size,
h = the number of lags to be tested,
ρk = the sample autocorrelation function (ACF) at lag k.
Certainly, the Ljung-Box test evaluates if the serial correlation in a time series model’s residuals is statistically significant. If the calculated Q statistic surpasses the critical value from the Chi-square distribution of a chosen significance level, it indicates the presence of serial correlation in the residuals. This implies potential inadequacies in the model’s ability to capture all the data patterns, signalling the need for further scrutiny or model adjustments.
2.3. Change Point Model
Let {X1,X2,,Xn} be n a separate series of a variable. Then, {X1,X2,,Xr} have the same pdf f(x; θ0), and {Xr+1,Xr+2,,Xn} also have the same pdf f(x; θ) where 1rn-1 is an unknown integer. f(x,θ) and fx; θ0 are the parametric pdf with parameter θ and θ0 where are two distinct values of θ. Next, let r be the shift-position. The main concern of change point detection is to get the values of r using the observations {X1,X2,,Xn}.
If θ0 and θ1values are not known. These values are likewise calculated. If θ0 and θ1 represent the averages of f(x; θ0) and f(x; θ1), thus there is a mean shift from θ0 to θ1respectively then, the random variable {X1,X2,,Xn} can be explained by the model;
Xi=θ0+εi, if i=1,2,,rθ1+εi, if i=r+1,r+2,,n(5)
For which the series of independent identically distributed random variables {ε1,ε2,,εn} have common pdf f(x; 0).
The likelihood of the change point problem is given by
L(r,θ0,θ1, X1, X2,,Xn)=i=1rfXi;θ0+i=r+1nfXi;θ1(6)
Then the log-likelihood according inferential statistics is given by
log(L(r,θ0,θ1, X1,X2,,Xn)) =i=1rlogfXi; θ0+i=r+1nlogfXi; θ1  (7)
For instances when θ0 and θ1 are known, the maximum likelihood estimator (MLE) of the change point r is given by
r̂= argmax1rn-1log(L(r,θ0,θ1, X1,X2,,Xn))(8)
Given that the random variables have a normal distribution, where μ0 μ1 are two separate constants having a change point in their means at r and their variances being unaffected or constant, then the log likelihood function defined in (7) becomes
log(L(r,μ0,μ1,σ2,X1,X2,,Xn))=-nlog2πσ-12σ2i=1r(Xi-μ0)2+i=r+1n(Xi-μ1)2(9)
The log-likelihood function that is negative is now proportional to
Ŝ2=i=1r(Xi-μ0)2+i=r+1n(Xi-μ1)2(10)
Ŝ2=i=1r(Xi-μ0)2-Xi-μ12+i=1nXi-μ12(11)
As a result, the MLE of r is specified in (8) is now
r̂=argmin1rn-1Ŝr2= argmin1rn-1i=1r(Xi-μ0)2-Xi-μ12(12)
If μo and μ1 are unknown, their MLEs condition on r is given by
X̅r=1ri=1rXi,  X̅'=1ri=r+1nXi (13)
In that case, the MLE of can be evaluated by
r̂=argmin1rn-1Ŝr2= argmax1rn-1rn-r n (X̅r-X̅r')2(14)
where
Ŝr2=i=1r(Xi-X̅r)2+i=r+1n(Xi-X̅r')2(15)
Ŝr2=i=1n(Xi-X̅)2-rX̅r-X̅2+(n-r)(X̅r'-X̅)2(16)
Ŝr2=i=1n(Xi-X̅)2-nr(n-r)i=1r(Xi-X̅)2
Ŝr2=i=1n(Xi-X̅)2-nr(n-r)(X̅r-X̅r')2(17)
2.3.1. Binary Segmentation Method
The Binary Segmentation method is widely used in many fields, including change point detection. Binary segmentation is used in detecting a single change point and several change points (in mean, variance and mean-variance jointly) and their positions at which the change point can be located.
Supposing that X1, X2, …, Xn is a sequence of independent random variables (vectors) and the probability distribution functions are F1(θ1), F2θ2,, Fn(θn) respectively. The change point model is given as
Xi=θ1+εi, if irθ2+εi, if i>r(18)
where εi is error and is the change point.
Below are the steps for which Binary Segmentation method works;
Test;
H0: no change point (series is homogeneous)
H1: there is a change point (series is non-homogeneous).
Or equivalently
H0: θ1==θr=θr+1==θn
H1: θ1θrθr+1θn
where r is a location of change point in mean or variance.
If H0 is accepted then, stop, meaning there is no change point. If H0 is not accepted, then there is a change point and we move to step 2.
Test the two parts (segments) in stage 1 individually to see if there is a change point.
The process is repeated until no division has a change point.
The total change point locations found from steps 1 to 3 are given by {r̂1, r̂2,,r̂p}, and the total estimated number of change points is p.
The test statistics based on CUSUM is given as;
Cr=rn-rn (X̅1: r-X̅r+1: n)(19)
Binary segmentation optimises
r̂=arg maxrCr(20)
If the test statistics exceeds a threshold (cα) thus Cr> cα, then we declare a change point.
2.3.2. Pruned Exact Linear Time (PELT)
The Pruned Exact Linear Time (PELT) method was introduced by Killick and Eckley based on the dynamic programming method (algorithm). The PELT searches the global minimum by optimising a penalty component. This method is also used to detect multiple change points.
The PELT seeks to optimise;
minp: r1,,rpi=0pCXri+1: ri+1+βp(21)
where C. is the cost function for a segment
β is the penalty term
ri change point locations
p is the number of change points.
Below are the steps for which the Pruned Exact Linear Time (PELT) method works:
1. Define the cost function for mean change, variance change or mean and variance jointly.
2. The dynamic programming looks for the forward solution of
Fi=minr<i{Fr+Cr+1: i+β}
3. PELT eliminates potential change points that can never be optimal
IfFs+Cs+1: r+ βF(r)
then s is discarded.
This stage is the pruning stage/step which increase computational speed.
2.3.3. Model Comparison Measures
Model comparison metrics like -2loglikelihood and 2loglikelihood+penalty were used to evaluate and compare models. The model with the minimum -2loglikelihood and -2loglikelihood+penalty is the best.
All tests were controlled at 5% significance level.
3. Results and Discussion
3.1. Descriptive Statistics
This study focused on detecting mean, variance and mean-variance change points in the inflation rate in Ghana. The detection is necessary to map out the years in which there were inflationary trends. A total of 60 observations were used for the study. Table 1 shows the descriptive statistics of the yearly inflation rate. The mean inflation is 27.06, while the median is 17.86. The minimum inflation rate is -8.42, which occurred in the year 1967 and the maximum inflation rate is 122.87 which occurred in the year 1983.
While negative inflation decreases economic activities, low or moderate inflation tends to foster or increase the economic activities. The yearly inflation rate data has a positive skewness, indicating that the inflation values are shifted to the right as compared to the normal distribution and also a leptokurtic peak, indicating that the inflation is more peaked than the normal distribution, as shown in Table 1 below.
Table 1. Descriptive statistics of inflation rate of Ghana.

Statistic

Value

N

60

Mean

27.17

Median

18.04

Min

-8.42

Max

122.87

Std Dev

26.34

Skewness

2.12

Kurtosis

4.71

3.2. Stationary Tests
One of the assumption for time series analysis is that the data should be stationary. Stationary tests showed that inflation rate is not stationary as shown in Table 2 and Figure 1, hence inflation rate was differenced which became stationary as shown in Table 3 and Figure 2.
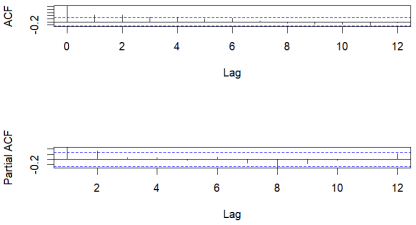
Figure 1. ACF and PACF plot of inflation rate.
Table 2. Stationarity test of inflation rate.

Test

Test statitic

p-value

Decision

ADF

-2.6057

0.33

Non- stationary

KPSS

0.3231

0.10

Stationary

Table 3. Stationarity test of first difference of inflation rate.

Test

Test statistic

p-value

Decision

ADF

-4.8454

0.01

Stationary

KPSS

0.048223

0.10

Stationary

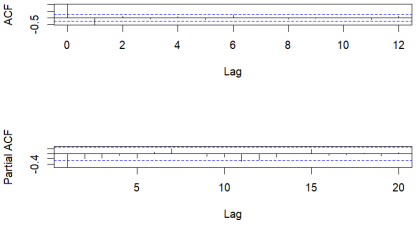
Figure 2. ACF and PACF plot of first difference of inflation rate.
3.3. ARIMA Modelling
The autocorrelation (ACF) and partial autocorrelation function (PACF) plots of the first difference of inflation rate will help in identifying the orders of the ARIMA model. The lag at where there is a spike for ACF shows the order for the MA process and while that of the PACF shows the lag for the AR process. The ACF plot of the differenced data indicate significant spike at lag 1, however the PACF plot shows no significant spike at any lag. Since we differenced the inflation rate once it is therefore appropriate to start with the model; ARIMA (0, 1, 1) and other combinations of the orders. Candidate ARIMA models were fitted and it came to light that ARIMA (0, 1, 2) has better comparison measures in most cases as shown in Table 4.
Table 4. Fitted ARIMA models.

model

AIC

AICc

BIC

log likelihood

ARIMA (0,1,1)

559.95

560.17

564.07

-277.97

ARIMA (0,1,2)

543.05

543.49

549.23

-268.52

ARIMA (1,1,1)

545.59

546.04

551.78

-269.80

ARIMA (1,1,2)

551.79

552.54

560.03

-271.89

ARIMA (2,1,1)

545.84

546.60

554.08

-268.92

ARIMA (2,1,2)

546.48

547.63

556.78

-268.24

BOLD means best model
3.4. Model Diagnostics
To ensure that the model is good for analysis, the following tests were carried out to make sure that the residuals are stationary and not serially correlated. Figure 3 shows that the model, ARIMA (0,1,2) has white noise since the standardised residuals appear to have a constant band and the ACF plot decays slowly.
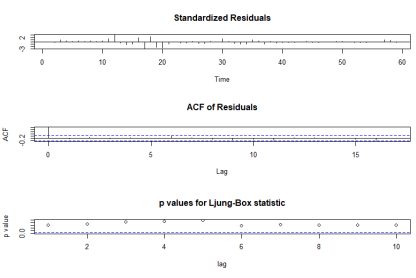
Figure 3. Model diagnosis of ARIMA (0, 1, 2).
Ljung- Box test is a statistical test used for checking the presence of serial correlation in time series data.
The hypothesis of interest is:
H0: The residuals are independent
H1: The residuals are not independent.
Table 5. Ljung-Box test on residuals of ARIMA (0, 1, 2).

Lag

Statistic(χ2)

Df

p-value

12

11.042

12

0.5253

24

18.029

24

0.8016

36

20.238

36

0.9841

The Ljung Box test at lag (12), lag (24) and lag (36) shows that the p-values were greater than 0.05 significant level, indicating the presence of no serial correlation, hence the model was adequate.
The errors were extracted for change point analysis.
3.5. Change Point Detection of Inflation rate of Ghana
3.5.1. Mean Change Detection
The mean change detection was carried out using CUSUM analysis of the errors extracted from ARIMA (0, 1, 2). The minimum Ŝ2 occurs at point (r̂=12) which is the change point corresponding to the year 1976, as shown in Table 6, Table 7 and the magenta colour in Figure 4.
Table 6. Mean change point detection.

Index

Residuals

Year

Ŝ2

1

-0.01320687

1965

32015.53

2

-4.29354509

1966

32010.31

3

21.7550011

1967

31888.66

4

11.9035086

1968

31750.44

5

4.47419253

1969

31725.37

6

10.5231692

1970

31597.09

7

7.06457307

1971

31523.77

8

11.4883496

1972

31364.51

9

6.4308659

1973

31296.52

10

14.0655877

1974

31069.34

11

30.994677

1975

30401.88

12

70.752934

1976

28181.17

13

-9.38544771

1977

28726.15

14

-28.057991

1978

29763.88

15

-23.5398904

1979

30456.93

16

47.6274934

1980

29230.91

17

-69.7493222

1981

30997.97

18

55.9577423

1982

29773.68

19

-54.1725452

1983

31010.06

20

-61.5940094

1984

31805.29

21

-22.0057488

1985

31943.48

22

1.45027606

1986

31935.66

23

-8.58315793

1987

31970.57

24

-11.7811193

1988

32002.15

25

4.3863553

1989

31991.13

26

-17.1676432

1990

32015.46

27

-18.0286912

1991

31999.82

28

4.18581495

1992

32008.18

29

1.99389509

1993

32011.39

30

34.757801

1994

31965.54

Table 7. Mean change point detection (Cont.).

Index

Residuals

Year

Ŝ2

31

6.2326934

1995

31937.31

32

-15.7456591

1996

31991.76

33

-22.7265114

1997

32014.98

34

-22.9702488

1998

31969.29

35

21.6010058

1999

32014.80

36

13.2120864

2000

32008.70

37

-24.6623142

2001

32001.27

38

5.75038018

2002

32011.21

39

-8.58841342

2003

31996.57

40

-7.71257973

2004

31974.27

41

-8.2701851

2005

31939.6

42

-5.72710595

2006

31908.27

43

2.41206491

2007

31921.65

44

4.09622117

2008

31943.12

45

-6.10527932

2009

31906.95

46

-5.48734308

2010

31865.32

47

-0.66976581

2011

31855.08

48

0.15616001

2012

31850.04

49

3.93799895

2013

31876.19

50

3.94575075

2014

31901.09

51

2.57563303

2015

31914.42

52

-3.56861224

2016

31874.56

53

-6.57419788

2017

31781.09

54

-4.39945451

2018

31675.87

55

0.26761792

2019

31615.24

56

0.32953637

2020

31514.23

57

21.3671721

2021

31884.98

58

19.085373

2022

32001.77

59

-4.23925233

2023

-

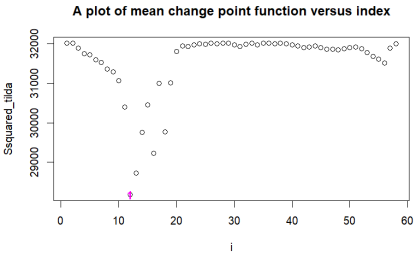
Figure 4. Mean Change Detection of Inflation Rate in Ghana.
3.5.2. Variance Change Point Detection
The variance change point is performed using the Binary Segmentation (BS) Method and the Prune Exact Linear Time (PELT) Algorithm.
The binary segmentation method detected the change point at locations 37 and 56, which represent the years 2001 and 2020, respectively. It has a log-likelihood of 492.90 and the likelihood penalty of 512.78 as shown the Table 8.
Table 8. Variance change point detection by binary segmentation.

Change point location (s)

Years

-2loglike lihood

-2loglike lihood +pen

37

2001

492.8971

512.7837

56

2020

The pictorial presentation of the Binary Segmentation results of the variance change is presented in Figure 5, where the (residuals) showing on the vertical axis were plotted against the index on the horizontal axis. The red lines in the graph show the variance change points which occurred at points 37 and 56 on the index axis, representing the years 2001 and 2020, respectively.
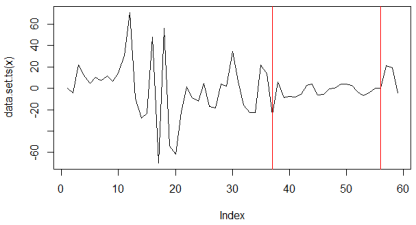
Figure 5. Variance change point detection by binary segmentation.
The Prune Exact Linear Time (PELT) method also detected variance changes at points 37 and 56 which present the years 2001 and 2020 respectively. The model has a log-likelihood of 492.90 and a likelihood penalty of 512.78, as shown in Table 9.
Table 9. Variance change point detection by PELT Method.

Change point location (s)

Years

-2loglike lihood

-2loglike lihood +pen

37

2001

492.8971

512.7837

56

2020

The pictorial presentation of the PELT method for variance change point is presented in Figure 6, where the vertical axis shows the residuals plotted against the index along the horizontal axis. The red lines on the graph show the variance change points positions which occurred at points 37 and 56 on the index axis, which presents the years 2001 and 2020, respectively.
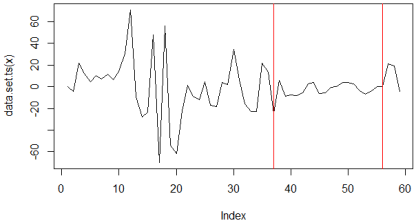
Figure 6. Variance change point detection by pelt algorithm.
3.5.3. Comparison of Methods for Variance Change Point Detection
The two methods (Binary Segmentation and Pruned Exact Linear Time) in detecting variance change(s) gave similar results. The methods gave variance (risk) change at time indices 37 and 56 which represent the years 2001 and 2020.
3.5.4. Mean-Variance Change Point Detection
For the sake of comparison, two methods, namely Binary Segmentation (BS) and Pruned Exact Linear Time (PELT) methods were used in detecting mean-variance change points.
The Binary Segmentation method for detecting mean-variance jointly change gave change point locations at points 10 and 37, which represent the years 1974 and 2001 respectively. The log-likelihood was 484.72 and the likelihood penalty was 509.72 as shown in Table 10 below.
Table 10. Mean-variance change point detection by Binary Segmentation.

Change point location (s)

Years

-2loglike lihood

-2loglike lihood +pen

10

1974

484.7160

509.7156

37

2001

The pictorial view of the Binary Segmentation results was also shown below, where the dataset (residual) on the vertical axis was plotted against Time (index) on the horizontal axis. From Figure 7, each step down or step up represents the mean-variance change point position(s). The mean- variance change occurred at points 10 and 37 which correspond to the years 1974 and 2001, respectively.
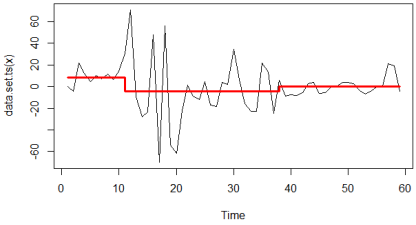
Figure 7. Mean-variance change point detection by Binary Segmentation.
The PELT method was also used to detect mean-variance change jointly. The change point locations were 10 and 20, which represent the corresponding years 1974 and 1984, respectively. The log-likelihood was 482.70 and the likelihood penalty was 507.28 as shown in Table 11.
Table 11. Mean-variance change points detection by PELT method.

Change point location (s)

Years

-2loglike lihood

-2loglike lihood +pen

10

1974

482.6993

507.2781

20

1984

The pictorial view of the PELT results was also below, where the dataset (residual) on the vertical axis was plotted against Time (index) on the horizontal axis. From Figure 8, each step down or step up represents the mean-variance change point position(s). The change points occurred at locations 10 and 20, corresponding to the years 1974 and 1984.
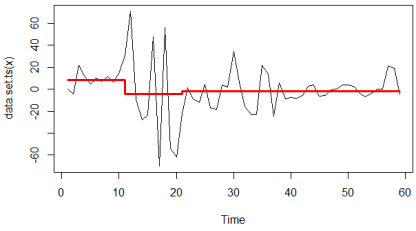
Figure 8. Mean-variance change points detection by PELT method.
3.5.5. Comparison of Techniques for Detecting Mean-Variance Change Points
The PELT method gives a lower log-likelihood of 426.6967 as compared with the Binary Segmentation method’s log-likelihood of 446.9403. The PELT method performs better with a mean-variance change point locations of 10 and 20 which represent the years 1974 and 1984.
4. Discussion
According to the results, the mean change point of inflation is detected in the year 1976 or around this year, which may be due to the balance of payment crisis, depletion of foreign reserves, Ghana’s entering into the IMF stabilisation discussion, which shows that the Ghanaian economy was under threat which could trigger increased inflation rates . The changes in government policies during the period of 1975 introduced significant economic reforms to monetary policies such as currency devaluation, implementing price controls and altering fiscal policies. These changes could have played a role in shaping the mean changes of the inflation rate of Ghana in 1976 .
Variance or risk change point detection occurred in the years 2001 and 2020. In 2001 or the years around it, Ghana faced fiscal deficit as a result of electoral and post-electoral spending. Also, there was severe currency depreciation and Ghana subscribed to the Heavily Indebted Poor Countries (HIPC) initiative . All these could have contributed to the variance or risk change in the inflation rate in the neighbourhood of 2001. In 2020 or the years around it, the world faced COVID-19, with lockdown and border closures resulting in revenue shortfalls and emergency fiscal spending exacerbated. Ghana encountered difficulties stemming from disruptions in supply chains, decreased economic outputs and heightened government expenditures aimed at alleviating pandemic impacts. These elements potentially contributed to an upsurge in the variability of the inflation rate of Ghana . There was also an oil price crash and heavy electoral spending in 2020 might have caused a variance or risk change in inflation rate .
The mean-variance change point occurred in the neighbourhood of the years 1974 and 1984. The year 1973 stands out as a crucial turning point, primarily because of the global economic upheavals like the oil crisis. The imposition of the oil embargo in 1973 resulted in a steep rise in oil prices globally, affecting the inflation rate of numerous countries and Ghana was no exception. The abrupt escalation in energy expenses probably fuelled the surge in inflation, prompting a shift in both the average and variability of the inflation rate of Ghana. Also, around 1973 and 1974, cocoa production declined as a result of smuggling and low producer prices. There was also overvaluation of the currency . All these economic activities could cause a shift in both the mean and the variability of the inflation rate of Ghana.
In the early 1980s, most of the developing nations including Ghana, faced economic hardships. Ghana underwent economic restructuring, the implementation of a structural adjustment program which was mandated by bodies such as the International Monetary Fund and the World Bank. These reforms are designed to stabilise the economy, often entailing measures such as currency devaluation and austerity, potentially impacting both the average and variability of the inflation rate of Ghana . There was a drought in 1981, causing low productivity; furthermore, wildfires also gutted many lands and farms. Again, about one million Ghanaians were deported from Nigeria which imposed an additional burden on the Ghanaian economy . For that matter, the years around 1984 were a pivotal moment in Ghana’s inflation trajectory, responding to a huge shift in the average and variance.
5. Conclusion
The primary objective of the study is to detect the change point(s) of the inflation rate of Ghana in terms of the mean, variance (risk) and mean-variance jointly. Secondary data on the annual inflation rate from the World Bank website spanning from 1965 to 2025 were utilised.
Statistical methods like Cumulative Sum, Binary Segmentation (BS) and Pruned Exact Linear Time (PELT) methods were used to detect change points in mean, variance and mean-variance jointly. Because the data is time series in nature, we sought to ensure that stationarity and white noise assumptions were met. The ARIMA (0, 1, 2) model was considered and the residuals extracted. Diagnostics tests of the residuals showed that they were adequate and free from serial correlation.
The mean change point is detected at time index 12, which represents the year 1976. Variance change point is detected at points 37 and 56 by the PELT method (algorithm), which represents the years 2001 and 2020, respectively. Binary Segmentation method (algorithm) was also used but the results appeared to be the same as the PELT method (algorithm) as it gave the same change points and log-likelihood.
Mean-variance change points were also detected at locations 10 and 20 which represent in the years 1974 and 1984 respectively by the PELT method (algorithm) and that of the Binary Segmentation (algorithm) detected changes at locations 10 and 37 which represent the years 1974 and 2001, respectively. The PELT method had a lower log-likelihood as compared to the Binary Segmentation method.
It is observed that uncertainties such as drought, electoral years, change in Government, Ghanaian’s deportation from Nigeria due to economic hardship, global oil crisis and COVID-19 pandemic have a great influence on the rate of inflation, hence the government and stakeholders should strategically put measures in place to curb future uncertainties.
It is therefore recommended that further studies should focus on the exploration of methods like wavelet analysis, Bayesian change point analysis and kernel change point detection of the inflation rate of Ghana.
Abbreviations

ARIMA

Autoregressive Integrated Moving Average Model

BS

Binary Segmentation (BS)

CUSUM

Cumulative Sum

CPD

Change-Point Detection

ERP

Economic Recovery Programme

EWMA

Exponentially Weighted Moving Average

HIPC

Heavily Indebted Poor Countries

PELT

Pruned Exact Linear Time

Author Contributions
Issah Zakaria: Conceptualization, Formal Analysis, Writing – original draft
Gideon Mensah Engmann: Conceptualization, Formal Analysis, Methodology, Supervision, Writing – original draft
Richard Puurbalanta: Formal Analysis, Data curation, Supervision
Angela Osei-Mainoo: Formal Analysis, Validation, Writing – original draft, Writing – review & editing
Data Availability Statement
The data used to support the findings of this study are available from the world bank website. The data can also be accessed from https://www.macrotrends.net/global-metrics/countries/gha/ghana/inflation-rate-cpi. The data is also available from the corresponding author upon request.
Conflicts of Interest
The authors declare no conflicts of interest.
References
[1] Moskvino, V., Zhigljavsky, A. An Algorithm base on Singular Spectrum Analysis for change point Detection. Communications in Statistics- Simulation and Computation. 2023, 32, 319-352.
[2] Chen, J., Gupta, A. K. Parametric Statistical Change Point Analysis: with Applications to Genetics, Medicine, and Finance. Birkhauser, Boston; (2012).
[3] Aminikhanghahi, S., Cook, D. J. A Survey of Methods for Time Series Change Point Detection. Knowledge and Information Systems. 2017, 51(2): 339-367.
[4] Alves, C. C. The Mixed CUSUM- EWMA (MCE) Control Chart. As A New Alternative in the Monitoring of a Manufacturing Process. Brazilian Journal of Operations and Production Management. 2017, 16, 1.
[5] Howard, M. Z. Inflation and performance of listed firms in Ghana. University of Cape Coast, Ghana. (2022).
[6] Mishkin, F. S. The Economics of Money, Banking and Financial markets. (7th ed.). Boston: Pearson/Addison-Wesley; 2004.
[7] Ackley, G. Macroeconomic Theory. New Delhi: Kalyani Publishers; 2008.
[8] Junttila, J. Structural Breaks, ARIMA Model and Finnish Inflation Forecasts. International Journal of Forecasting. 2001, 17, 2, 203-230.
[9] Adu, G., Marbuah, G. Determination of Inflation. An Empirical Investigation. South Africa Journal of Economics. 2011, 79, 3, 251-269.
[10] Alagidede, P., Coleman, S., Cuestas, J. C. Inflation persistence in Ghana: Evidence from Disaggregated Consumer Price Inflation. Economic Modelling. 2011, 36, 413–422.
[11] Czitrom, V. Introduction to Statistical Process Control. Statistical Case Studies for Industrial Process Improvement. 1997, 299-314.
[12] Killick, R., Eckley, I. A. Changepoint: An R Package for Changepoint Analysis. Journal of Statistical Software. 2014, 58, 1-19.
[13] Hutchful, E. Ghana’s Adjustment Experience: The Paradox of Reform. Oxford: James Currey. 2002.
[14] Devereux, M. B., Engel, C. Monetary Policy in the Open Economy Revisited: Price Setting and Exchange-Rate Flexibility. The Review of Economic Studies. 2017, 70, 765-783.
[15] IMF, World Bank. Poverty Reduction Strategy Papers-Progress in implementation. Washington DC. 2002.
[16] Osei, R. D., Quartey, P. Tax Reforms in Ghana (No. 2005/66). WIDER Research Paper. 2005.
[17] Ling, J. Economic Consequences of the COVID-19 Outbreak: The Need for Epidemic Preparedness. Frontiers in Public Health. 2020, 1-19.
[18] World Bank. Ghana Economic Update. Available from:
[19] Aryeetey, E., Harrigan, J., Nissanke, M. Economic Reforms in Ghana: The Miracle and the Mirage. Africa World Press. 2000.
[20] Davis, J. Institutional Impediment to Work Force Retrenchments and Restructuring in Ghana’s State Enterprises. World Development. 1991, 19(8), 987-1005.
[21] Andrews, D. W. K. Tests for Parameter Instability and Structural Change with Unknown Change Point. Econometrica. 1993, 61(4), 821.
Cite This Article
  • APA Style

    Zakaria, I., Engmann, G. M., Puurbalanta, R., Osei-Mainoo, A. (2026). Change-Point Detection with ARIMA of Inflation Rate in Ghana. American Journal of Theoretical and Applied Statistics, 15(2), 47-58. https://doi.org/10.11648/j.ajtas.20261502.13

    Copy | Download

    ACS Style

    Zakaria, I.; Engmann, G. M.; Puurbalanta, R.; Osei-Mainoo, A. Change-Point Detection with ARIMA of Inflation Rate in Ghana. Am. J. Theor. Appl. Stat. 2026, 15(2), 47-58. doi: 10.11648/j.ajtas.20261502.13

    Copy | Download

    AMA Style

    Zakaria I, Engmann GM, Puurbalanta R, Osei-Mainoo A. Change-Point Detection with ARIMA of Inflation Rate in Ghana. Am J Theor Appl Stat. 2026;15(2):47-58. doi: 10.11648/j.ajtas.20261502.13

    Copy | Download

  • @article{10.11648/j.ajtas.20261502.13,
      author = {Issah Zakaria and Gideon Mensah Engmann and Richard Puurbalanta and Angela Osei-Mainoo},
      title = {Change-Point Detection with ARIMA of Inflation Rate in Ghana},
      journal = {American Journal of Theoretical and Applied Statistics},
      volume = {15},
      number = {2},
      pages = {47-58},
      doi = {10.11648/j.ajtas.20261502.13},
      url = {https://doi.org/10.11648/j.ajtas.20261502.13},
      eprint = {https://article.sciencepublishinggroup.com/pdf/10.11648.j.ajtas.20261502.13},
      abstract = {Change-point detection is the point or location in the series where the observations of that series are shifted to another point. Inflation is considered as one of the most important determinants of economic growth and also a key macroeconomic indicator which shows how prices of goods change from one period to another and this plays a critical role in economic stability and growth. The study therefore, aimed to determine structural change-point(s) of the inflation rate in Ghana, which will serve as an essential source of information to guide policy direction. Annual data on Ghana’s inflation rate were sourced from the World Bank website covering the years 1965-2025. To remove the effect of serial correlation since the inflation data was collected over time, an ARIMA model was considered and the errors which were independent and identically distributed, were extracted for multiple change point procedures. Change point methods considered were the Cumulative Sum (CUSUM) Test, the Binary Segmentation (BS) Method and the Pruned Exact Linear Time (PELT) Algorithm. We sought to determine change points in mean, variance (risk) and mean-variance jointly since they are the basic measured quantities for econometric analysis. Results show that the mean change point was detected at time (index) 12, which represents the year 1976, corresponding to Ghana’s mid-1970s macroeconomic instability. Variance (risk) change points were detected at time points 37 and 56, which represent the years 2001 and 2020, respectively corresponding to times of fiscal stress (Ghana joining the Heavily Indebted Poor Countries (HIPC)), electoral spending and COVID-19 shock. The mean-variance change points were also detected at time points 10 and 20, which represent the years 1974 and 1984, respectively aligning with the oil shock era and the economic recovery programme (ERP) regime. The study showed that Ghana’s inflation process has experienced multiple structural shifts associated with major economic shocks and policy transitions. It is highly recommended that credible macroeconomic management and fiscal discipline be adhered to during structural changes.},
     year = {2026}
    }
    

    Copy | Download

  • TY  - JOUR
    T1  - Change-Point Detection with ARIMA of Inflation Rate in Ghana
    AU  - Issah Zakaria
    AU  - Gideon Mensah Engmann
    AU  - Richard Puurbalanta
    AU  - Angela Osei-Mainoo
    Y1  - 2026/04/15
    PY  - 2026
    N1  - https://doi.org/10.11648/j.ajtas.20261502.13
    DO  - 10.11648/j.ajtas.20261502.13
    T2  - American Journal of Theoretical and Applied Statistics
    JF  - American Journal of Theoretical and Applied Statistics
    JO  - American Journal of Theoretical and Applied Statistics
    SP  - 47
    EP  - 58
    PB  - Science Publishing Group
    SN  - 2326-9006
    UR  - https://doi.org/10.11648/j.ajtas.20261502.13
    AB  - Change-point detection is the point or location in the series where the observations of that series are shifted to another point. Inflation is considered as one of the most important determinants of economic growth and also a key macroeconomic indicator which shows how prices of goods change from one period to another and this plays a critical role in economic stability and growth. The study therefore, aimed to determine structural change-point(s) of the inflation rate in Ghana, which will serve as an essential source of information to guide policy direction. Annual data on Ghana’s inflation rate were sourced from the World Bank website covering the years 1965-2025. To remove the effect of serial correlation since the inflation data was collected over time, an ARIMA model was considered and the errors which were independent and identically distributed, were extracted for multiple change point procedures. Change point methods considered were the Cumulative Sum (CUSUM) Test, the Binary Segmentation (BS) Method and the Pruned Exact Linear Time (PELT) Algorithm. We sought to determine change points in mean, variance (risk) and mean-variance jointly since they are the basic measured quantities for econometric analysis. Results show that the mean change point was detected at time (index) 12, which represents the year 1976, corresponding to Ghana’s mid-1970s macroeconomic instability. Variance (risk) change points were detected at time points 37 and 56, which represent the years 2001 and 2020, respectively corresponding to times of fiscal stress (Ghana joining the Heavily Indebted Poor Countries (HIPC)), electoral spending and COVID-19 shock. The mean-variance change points were also detected at time points 10 and 20, which represent the years 1974 and 1984, respectively aligning with the oil shock era and the economic recovery programme (ERP) regime. The study showed that Ghana’s inflation process has experienced multiple structural shifts associated with major economic shocks and policy transitions. It is highly recommended that credible macroeconomic management and fiscal discipline be adhered to during structural changes.
    VL  - 15
    IS  - 2
    ER  - 

    Copy | Download

Author Information
  • Department of Statistics and Actuarial Science, University of Technology and Applied Sciences, Navrongo, Ghana

    Biography: Issah Zakaria is a Mathematics tutor at Ahafoman Senior High Technical School, Goaso, Ghana. He completed his Master of Philosophy degree in Statistics at the University of Technology and Applied Sciences, Navrongo, Ghana in 2024 and his first degree in Statistics at the University for Development Studies, Ghana in 2013. He is currently pursuing his PhD in Statistics at the University of Technology and Applied Sciences, Navrongo, Ghana.

  • Department of Biometry, University of Technology and Applied Sciences, Navrongo, Ghana

    Biography: Gideon Mensah Engmann obtained his Master’s degree in Statistics (Biostatistics) in 2009 from the Center for Statistics, University of Hasselt, Belgium. He earned his PhD in Statistics from the School of Mathematical Sciences, Shanghai Jiao Tong University, People’s Republic of China in 2021. He is a Senior Lecturer at the Department of Biometry, University of Technology and Applied Sciences, Navrongo, Ghana. His current research interest includes Statistical Process Control and its Applications.

  • Department of Statistics and Actuarial Science, University of Technology and Applied Sciences, Navrongo, Ghana

    Biography: Richard Puurbalanta earned his PhD in Statistics from the University for Development Studies, Ghana. He is a Senior Lecturer at the Department of Statistics and Actuarial Science, University of Technology and Applied Sciences, Navrongo, Ghana. His current research interest includes Spatial and Bayesian Statistics.

  • Department of Statistics and Actuarial Science, University of Technology and Applied Sciences, Navrongo, Ghana

    Biography: Angela Osei-Mainoo is an Assistant Lecturer at the Department of Statistics and Actuarial Science, University of Technology and Applied Sciences, Navrongo, Ghana. She completed her MPhil. in Applied Mathematics (Statistics) in 2013 and is currently a PhD candidate at Kwame Nkrumah University of Science and Technology, Ghana where she attained both her first and second degrees.