Research Article | | Peer-Reviewed

Estimating the Product Quantity and Particle Size of Char and Activated Carbon Derived from Palm Kernel Shells – A Practical Approach

Received: 29 October 2025     Accepted: 14 November 2025     Published: 8 December 2025
Views:       Downloads:
Abstract

In this study, activated carbons were prepared from palm kernel shells by physical activation. The methodology of experimental design was used to optimise the preparation conditions. While varying the particle size of the precursor palm kernel shells, carbonisation was done for about one hour to yield char. Activated carbon was prepared from the product char at a steam flow rate of 0.06 mol/h/g char and at a temperature of about 900°C for five hours. The empirical results were investigated to estimate the yield and particle size distribution of char and activated carbon produced from the palm kernel shells. Based on the yield and particle size analysis, a model was generated to predict product particle size and quantity in the production of activated carbon, thereby effectively utilising available raw materials and reducing preparation costs. In gold adsorption process, activated carbon of + 2.00 mm is mainly used to recover dissolved gold complexes from solutions. From data analysis and the model generated in this study, a relatively high composition of activated carbon with particle size + 2.00 mm was produced by utilising palm kernel shells precursor with particle size - 6.70 mm + 5.60 mm for carbonisation and char particle size –3.35 mm +2.80 mm for activation.

Published in Advances in Materials (Volume 14, Issue 4)
DOI 10.11648/j.am.20251404.15
Page(s) 117-126
Creative Commons

This is an Open Access article, distributed under the terms of the Creative Commons Attribution 4.0 International License (http://creativecommons.org/licenses/by/4.0/), which permits unrestricted use, distribution and reproduction in any medium or format, provided the original work is properly cited.

Copyright

Copyright © The Author(s), 2025. Published by Science Publishing Group

Keywords

Activated Carbon, Char, Palm Kernel Shells, Yield, Particle Size

1. Introduction
Activated carbon is available in various forms, including powders, granular chips, and extruded products, and is produced commercially from sources such as palm kernel shells (PKS), wood, lignite, and petroleum pitch . Activation of carbon is achieved by removing hydrogen-rich fractions and other volatile constituents from the carbonaceous raw material, producing a porous residue with a large internal surface area . Hence, activated carbons are complex products that are difficult to classify based on their behaviour, preparation methods, and surface characteristics. However, some broad classification is made for general purposes based on physical characteristics such as particle size. Particle size analysis in activated carbon production is crucial, as it aids in estimating the particle size composition and distribution in the product. This analysis has several applications in the minerals, building, chemical and pharmaceutical industries for the effective control and regulation of many technological processes .
The industrial production of activated carbon faces challenges related to raw material scarcity and high preparation costs; therefore, several studies have been conducted to explore innovative, inexpensive and renewable raw materials . Additionally, the effective utilisation of these raw materials is key, as this would reduce waste after production and the costs associated with producing that waste .
In the gold industry, activated carbon with a particle size of + 2.00 mm is primarily used to recover dissolved gold complexes from solutions . Consequently, it is important to predict the particle size and yield of activated carbon produced from a given particle size range of precursor. Hence, this study seeks to develop a model for estimating the quantity and particle size of product char and activated carbon from carbonising a given size range of PKS and subsequently activating the produced char.
2. Experimental Investigations
2.1. Preparation of Activated Carbon
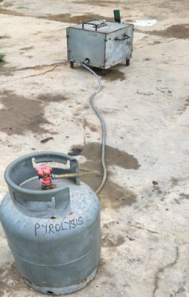
Figure 1. Pyrolysis Setup.
Palm kernel shells (PKS) used in this study were obtained from a palm kernel oil processing mill in Tarkwa, Western Region, Ghana. The PKS were washed with water, dried, crushed and sieved to obtain a particle size range of – 6.70 mm + 2.00 mm. A custom-made pyrolysis reactor was utilised ; the Pyrolysis setup is shown in Figure 1. A known mass of the PKS in the particle size range of – 6.70 mm + 2.00 mm was fed into the pyrolysis reactor and heated to a temperature of 900°C and held for one (1) hour. The carbonised shells (char) obtained after pyrolysis were sieved using various sieves, and a known mass of each sieve size was subjected to steam activation at 900°C in the same reactor in triplicate. During activation, de-ionised water was introduced through pipes at the bottom of the reactor to initiate the activation process. The flow rate of the water was maintained at 0.06 mol/h/g char for a duration of five (5) hours. The derived activated carbon was weighed and sieved for characterisation.
2.2. Yield of Char and Activated Carbon
The yield of char relative to a given quantity of the dry precursor and the yield of AC relative to a given quantity of dry carbonised precursor of each selected size range were calculated using Equations 1 and 2, respectively. Also, the yield of the required activated carbon was determined using Equation 3.
Yield of char, YC=McMs × 100%(1)
Yield of activated carbon, YA=MaMc × 100%(2)
Yield of required activated carbon, YR=MrMa × 100%(3)
Where: Ms = initial dry mass of precursor PKS
Mc = dry mass of char after carbonisation
Ma = dry mass of activated carbon after activation
Mr = dry mass of activated carbon after activation retained on 2 mm sieve
2.3. Particle Size Distribution of Char and Activated Carbon
Particle size analyses to determine the particle size distribution of char and activated carbon were carried out in test sieves arranged in series with decreasing sieve apertures. This was arranged such that consecutive sieves had a constant relationship. Particle size analyses in this study were performed dry with a constant classification scale module of √2, which corresponds to the American Tyler series. The approximate amount of the precursor or product was weighed, loaded onto the uppermost sieve, and covered. The set of sieves was placed on a vibrator and shaken for 30 minutes, followed by manually controlled screening until the quantity of material passing through a sieve was less than 1% per minute. The oversize of each nominal sieve was weighed. The percentage retained on each sieve was calculated using Equation 4. Subsequently, the cumulative percentage was calculated by summing the percentages retained for each nominal sieve.
Percent retained, X =Mass of material retainedInitial mass of material × 100%(4)
2.4. Characterisation of Derived Char and Activated Carbon for Gold Adsorption
The activated carbon produced was assessed for its adsorption properties and hardness. Assessment of the derived char and activated carbon for the adsorption of gold di-cyanide was carried out by balancing 1.00 g of the + 2.00 mm size of char and activated carbon into separate glass bottles with 1000.00 mL of 9.59 mg/L gold di-cyanide solution. The bottles were placed on a set of rollers, and 5 mL aliquots were sampled after 0, 15, 30, 45, 60, and 120 minutes for analysis of gold in each solution using the Shimadzu AA-7000 Atomic Absorption Spectrophotometer. The adsorption of gold onto the char and activated carbon was modelled using the Calgon method . The ball-pan hardness (BPH) test was performed correspondingly. This involved placing 100 mg of screened char and activated carbon samples in test pans with 30 stainless steel balls, then subjecting the samples to a combined rotating and tapping action for 30 minutes, followed by 10 minutes of sieving through a standard 1.00 mm test sieve. The BPH number was estimated as the weight percentage of the sample retained on the 1.00 mm test sieve.
3. Results and Discussion
3.1. Yield
The yield of char as a function of particle size of the precursor PKS is presented in Figure 2. For the varying particle size of the shells, the yield of char ranged between 28 – 32 wt% with a mean yield of 29.96 ± 0.34 wt% based on three replicate measurements. This indicates low variability or uncertainty across the replicates, suggesting that the carbonisation process has very high repeatability under similar experimental conditions. The yield of char is proportional to increasing particle size, but the influence of the varying particle size is relatively insignificant. This trend was expected as several researchers have achieved similar results in similar studies .
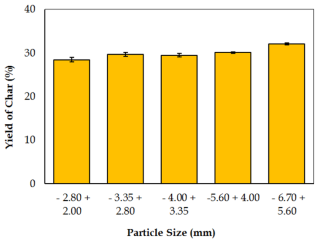
Figure 2. Yield of Char as a Function of Particle Size of Shells.
Figure 3 shows the effect of particle size of char on the yield of activated carbon. From Figure 3, the yield of activated carbon ranged between 58 wt% and 60 wt% of the dry char precursor, with an average weight percentage of 58.18 ± 0.97 wt%. The yield increased with increasing particle size; however, the increase was minimal. Figure 4 shows the yield of activated carbon retained on the 2 mm sieve, which is requisite for gold adsorption processes, as a function of particle size of char. Thus, 60.56 wt% ± 0.58, 58.32 wt% ± 0.42, 57.02 wt% ± 0.55, 55.34 wt% ± 1.51 and 39.59 wt% ± 0.37 represent + 2.00 mm activated carbon produced from activating char of initial particle size of - 6.70 + 5.60, - 5.60 + 4.00, - 4.00 + 3.35, - 3.35 + 2.80 and - 2.80 + 2.00 mm, respectively. The activated carbon produced from activating - 2.80 mm + 2.00 mm char was relatively low. Therefore, it is desirable to prepare the dry char to a particle size range of - 5.60 mm + 2.80 mm to obtain a good percentage of activated carbon with a particle size of + 2.00 mm.
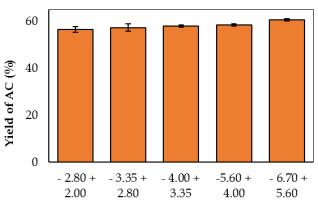
Figure 3. Yield of Activated Carbon as a Function of Particle Size of Char.
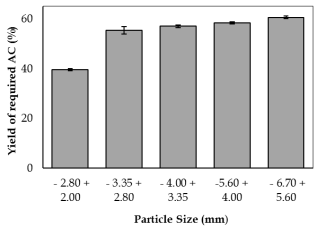
Figure 4. Yield of + 2.00 mm Activated Carbon as a Function of Particle Size of Char.
3.2. Particle Size Distribution
Figures 5 and 6, respectively, present the particle size distribution of product char and activated carbon derived from PKS with varying precursor particle size. The cumulative percentage of char and activated carbon retained on subsequent sieves decreased with increasing particle size, with a significant decrease noticed after the third and fourth consecutive sieves. Prior to the dip, an average cumulative retention of 99.46% and 99.78% was recorded for product char and activated carbon, respectively. From the particle size distributions, the percentage composition of any particle size ranging between 6.70 mm and 2.00 mm of char and activated carbon can be estimated. In Figure 5, PKS of particle size - 6.70 mm + 5.60 mm achieved 99.63% product char at the size range of - 3.35 mm + 2.80 mm and from Figure 6, 99.74% of activated carbon was retained at the size range of - 2.80 + 2.00 mm with 0.1 - 1% loss due to fines generated from screening and other mechanical activities. Thus, to produce a relatively high composition of activated carbon of particle size + 2.00 mm utilised in gold adsorption processes, PKS of particle size - 6.70 mm + 5.60 mm should be utilised. Considering a 0.1 - 1% loss due to fines generated by screening and other mechanical activities, this result is desirable. In addition, uncertainty analysis was performed using standard deviation values derived from replicate measurements of the particle size analysis. The standard deviation for the product char was ± 1.10%, and ± 0.95% for the product activated carbon. These values reflect the consistency of the experimental procedure.
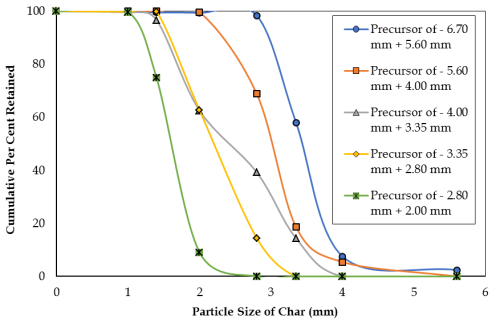
Figure 5. Cumulative Percent Retained as a Function of Particle Size of Product Char from PKS of Varying Particle Size.
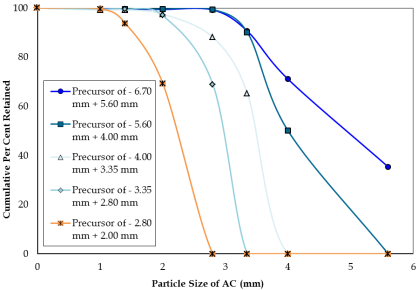
Figure 6. Cumulative Percent Retained as a Function of Particle Size of Product Activated Carbon from PKS of Varying Particle Size.
3.3. Characterisation of Derived Char and Activated Carbon for Gold Adsorption
Adsorption of gold from the gold di-cyanide solution by the derived char and activated carbon with respect to time is presented in Figure 8, from which the rate of gold adsorption was determined as demonstrated in Figure 9. The activated carbon had an R-value of 4.47 and exhibited gold adsorption characteristics, whereas the char had an R-value of 0.02. This was expected after activation as reported in other studies . Typically, effective gold adsorption requires a well-developed pore structure in the carbon material, with sufficient pore volume and high surface area that facilitate the adsorption (diffusion) and retention of gold-cyanide complexes. The textural characteristics, surface area and pore volume of the PKS char and activated carbon have been previously reported by Buah et al., where a similar setup and experimental conditions were used . Activation improves the surface area and micropore volume, which explains its high adsorption capacity for aurocyanide, as discussed by Buah et al. and Adams .
Results for the BPH test are presented in Figure 10. This accordingly reflects the percentage of activated carbon or char mass that remains intact after vigorous agitation with steel balls, simulating the mechanical stress encountered during industrial operations, particularly in gold mining processes such as carbon-in-pulp (CIP) and carbon-in-leach (CIL) . In this study, the char (BPH = 86%) was relatively harder than the activated carbon (BPH = 83%); this was likely due to the formation of new pores from the release of volatile matter and the broadening of existing pores as the char is activated to produce activated carbon . This increases the porosity of the activated carbon and reduces its hardness, relative to the char with low porosity. The produced char and activated carbon, therefore, had hardness values that correspond to the strong category and are consistent with commercial granular activated carbon standards (ranging between 70 and 100%). This mechanical stability is crucial for maintaining the integrity of activated carbon particles throughout the multiple gold adsorption-desorption cycles. In that, the activated carbon retains its granular form and is less likely to generate fines, which can interfere with slurry flow, clog the leaching tank filters, and reduce the effective surface area available for gold adsorption. Therefore, the high ball pan hardness values directly contribute to consistent adsorption performance, reduced operational downtime, and improved carbon recovery rates.
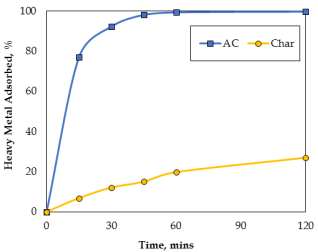
Figure 8. Percentage Gold Adsorption by the Activated Carbon and Char.
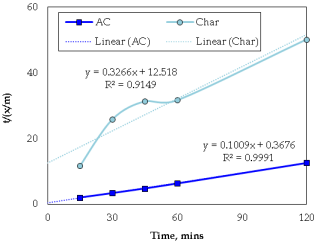
Figure 9. Rate of Gold Adsorption from the Gold Solution by the Activated Carbon and Char.
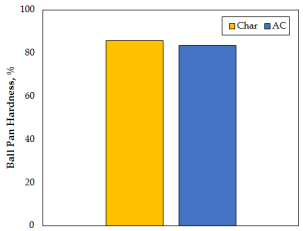
Figure 10. Relative Hardness of the Activated Carbon and Char.
4. Model Derivation
From yield results and particle size distributions, the quantity and particle size of char and activated carbon can be predicted from dry PKS.
4.1. Quantity of Product Char and Activated Carbon
The quantity of PKS (Ms) required to produce a given quantity of char (Mc) and activated carbon (Ma) was estimated to be proportional to the yield of char (YC) and activated carbon (YA) retained on a particular sieve size of cumulative percentage (XC) and XA.
From Equation 1, YC = McMs × 100%
Where: Ms = initial dry mass of precursor PKS
Mc = dry mass of char after carbonisation
From yield analysis, YC = 29.96% of the initial dry mass of PKS (Ms);
Ms=Mc29.96% × 100%
Ms=100% × Mb29.96%
Ms= 3.33778 × Mc(5)
And, yield of char retained on the sieve, Xc = MrcMc × 100%
Where: Mrc = dry mass of char retained on sieve required for subsequent use
Mc = dry mass of char after carbonisation
Considering an average of 99.46% retained on the subsequent reference sieve after particle distribution analysis of the dry mass of char produced after carbonisation;
Mc=Mrc99.46% × 100%
Mc=100% × Mc99.46%
Mc= 1.00543 × Mrc(6)
Substituting Mc from Equation 6 into Equation 5,
Ms=3.33778 × Mc
Ms= 3.33778 × (1.00543 * Mrc)
Ms= 3.3559 × Mrc(7)
From Equation 2, yield after activation of char YA = MaMc × 100%
Where: Mc = initial dry mass of precursor char
Ma = dry mass of activated carbon required after activation
From yield analysis, YA = 58.18% of the initial dry mass of char (Mc);
Mc=Ma58.18% × 100%
Mc=100% × Ma58.18%
Mc= 1.71880 × Ma(8)
And, yield of activated carbon retained on the sieve, XA = MraMa × 100%
Where: Mra = dry mass of activated carbon retained on sieve required for subsequent use
Ma = dry mass of activated carbon after activation
Since an average of 99.78% was retained on the subsequent sieve after particle distribution analysis of the dry mass of activated carbon produced after activation, hence;
Ma=Mra99.78% × 100%
Ma=100% × Mra99.78%
Ma= 1.00220 × Mra(9)
Substituting the expression for Ma (Equation 9) into Mc (Equation 8)
Mc= 1.71880 × Ma
Mc= 1.71880 × (1.00220 × Mra)
Mc= 1.7226 × Mra(10)
Therefore, the quantity of PKS (Ms) needed to produce the required quantity of activated carbon (Mra) is deduced from Equations 7 and 10.
Thus, comparing Equations 7 and 10;
Ms=[3.3559 × (1.7226 × Mra)]
Ms= 5.781 × Mra(11)
4.2. Particle Size of Product Char and Activated Carbon
From the experimental data, Table 2 presents the relationship between the particle size of the precursor PKS, the product char and activated carbon. Material which had passed through a sieve with aperture width d but remains on a sieve with aperture width n, where n < d, is described as (-d+n) and has been denoted (+ n). With this normality, the particle size range of (– 6.70 + 5.60) mm, for instance, is represented as (+ 5.60) mm.
Table 2. Particle size analysis of PKS, product char and activated carbon.

Minimum particle size (mm)

Relation between minimum particle size of precursor PKS, product char and activated carbon (AC)

PKS

Char

AC

PKS/Char

Char/AC

PKS/AC

+ 5.60

+ 2.80

+ 2.00

5.602.80 = 2

2.802.00 = 1.4

5.602.00 = 2.8

+ 4.00

+ 2.00

+ 1.40

4.002.00 = 2

2.001.40 ≈ 1.4

4.001.40 ≈ 2.8

+ 3.35

+ 1.70

+ 1.18

3.351.70 ≈ 2

1.701.18 ≈ 1.4

3.351.18 ≈ 2.8

+ 2.80

+ 1.40

+ 1.0

2.801.40 = 2

1.401.00 = 1.4

2.801.00 = 2.8

+ 2.00

+ 1.00

+ 0.71

2.001.00 = 2

1.000.71  1.4

2.000.71 ≈ 2.8

From Table 2 and Equations 7, 10 and 11, this model accordingly predicts that;
To produce char of particle size (+ X) mm and product quantity Mc g from PKS;
Particle size of precursor dry PKS required = [2.0 × (+ X)] mm,
Quantity of precursor PKS required = (3.3559 × Mc) g.
To produce activated carbon of particle size (+ Y) mm and product quantity Mra g from char;
Particle size of precursor char required = [1.4 × (+ Y)] m,
Quantity of precursor char required = (1.7226 × Mrc) g.
Ultimately, to produce activated carbon of particle size (+ Z) mm and product quantity Mra g from PKS;
Particle size of precursor dry PKS required, P = [2.8 × (+ Z)] mm,
Quantity of precursor PKS required, Q = (5.781 × Mra) g.
Consequently, regression models were developed in Minitab (Minitab® LLC, State College, Pennsylvania, United States, version 22) to quantify these relationships further, as shown in Table 3. The first model predicted the yield of activated carbon based on the yield of char derived from the experimental data. The resulting regression Equation (12) demonstrated a significant correlation and a strong fit with an R2 value of 0.957. The F-value was 66.18 with a p-value of 0.004, confirming the statistical significance of char yield as a predictor for the final yield or quantity of activated carbon. Similarly, for particle size, all the regression model Equations 13-15 showed strong correlations, with relatively high F-values (as shown in Table 3). The R2 and p-values were significant, validating the char particle size or PKS particle size as a reliable predictor of product particle size of activated carbon, under the range of experimental conditions employed in this study.
AC yield= 24.71 + 1.117 Char yield(12)
Char particle size = 0.0074 + 0.49933 PKS particle size (13)
AC particle size = -0.0132 + 0.7142 Char particle size (14)
AC particle size = -0.0085 + 0.35675 PKS particle size (15)
Table 3. Regression model summaries and analysis of variance (ANOVA).

Model equation

Std. Dev.

R2

F-value

p-value

12

0.3662

0.9566

66.18

0.004

13

0.0129

0.9997

11160.33

0.000

14

0.0192

0.9988

2550.82

0.000

15

0.0143

0.9993

4580.80

0.000

4.3. Validation of Model
To validate the model, triplicate samples of char and activated carbon were produced from PKS under the conditions detailed in the experimental section. Then, the model was similarly used to predict the product particle size and the quantities of char and activated carbon, as tested experimentally. Figures 11, 12, 13, and 14 show the predicted versus actual particle size of product char, predicted versus actual quantity of product char, predicted versus actual particle size of product activated carbon, and predicted versus actual quantity of product activated carbon, respectively. The required product mass was varied between 1000 – 1500 g for char and 100 - 500 g for activated carbon. Likewise, the product particle size was varied between 1.00 mm - 2.80 mm for char and 0.71 mm - 2.00 mm for activated carbon. The actual (experimental) results were compared with the respective predicted values from the model, as presented in Figures 11-14. The R2 values for the correlation between actual and predicted particle sizes were 0.9654 for char and 0.9896 for activated carbon. The R2 value was also 0.9751 for char and 0.9982 for activated carbon. The observed trend and the closeness of the R2 values to unity indicate a good correlation between the actual (experimental) and predicted values. The results clearly show that the model can predict the particle size and quantity of product char and activated carbon from PKS. It is, however, essential to note that the model’s applicability may be limited by the type of pyrolysis setup and the activation reagent used. These factors can significantly influence the rate and degree of burn-off and, in turn, affect porosity and surface area, which directly relate to the final product size and quantity . Hence, subsequent studies should aim to optimise this approach using a continuous or semi-batch system and test other environmentally sustainable activation agents.
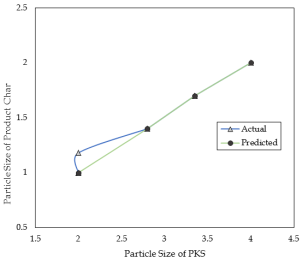
Figure 11. Predicted vs Actual Particle Size of Product Char.
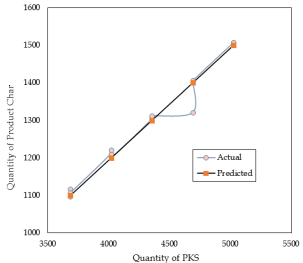
Figure 12. Predicted vs Actual Quantity of Product Char.
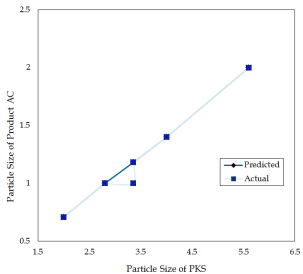
Figure 13. Predicted vs Actual Particle Size of Product Activated Carbon.
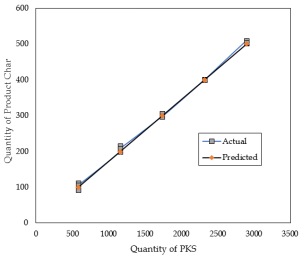
Figure 14. Predicted vs Actual Quantity of Product Activated Carbon.
5. Conclusions
This study demonstrates that the yield and product particle size of char and activated carbon are function of the precursor particle size. There is therefore a need to optimise the operating variables while considering the yield and particle size distribution of carbonisation and activation products to save cost and raw materials. In this study, it has been established that the quantity of PKS, Ms, required to produce a given quantity of activated carbon, Mra, is in the relation Ms = (5.781 × Mra) g. The final equation, in terms of particle size, for the PKS required to yield a desired particle size of activated carbon is presented as P = [2.8 × (+ Z)] mm. The model accurately predicted the quantity and particle size of product char and activated carbon when tested under the experimental conditions. The derived char performed relatively better in terms of hardness, while the activated carbon achieved higher gold di-cyanide adsorption properties.
Author Contributions
William Kwame Buah: Conceptualization, Formal Analysis, Methodology, Supervision, Writing – original draft, Writing – review & editing
Emmanuel Atta Mends: Data curation, Formal Analysis, Methodology, Writing – original draft, Writing – review & editing
Linda Bentuma Osei: Writing – review & editing
Conflicts of Interest
No funds, grants, or other support were received for conducting this study.
References
[1] Andas, J., Rahman, M. L. A., and Yahya, M. S. M., Preparation and Characterization of Activated Carbon from Palm Kernel Shell. IOP Conference Series: Materials Science and Engineering, 2017. 226(1): p. 012156.
[2] Buah, W. K., Kuma, J., Williams, T., and Ndur, S., Activated carbon prepared in a novel gas fired static bed pyrolysis-gasification reactor for gold di-cyanide adsorption. Ghana Mining Journal, 2015. 15(2): p. 58-64.
[3] Fosu, S., Sunkari, E. D., Anderson, P., Mensah, C., Cudjoe, C. A., and Ambushe, A. A., Comparative study of the abatement of elevated fluoride in groundwater from Vea catchment in the Upper East Region of Ghana using bone char and thermally activated bone char. Discover Water, 2025. 5(1): p. 56.
[4] Kove, E. A., Buah, W. K., Dankwa, O. K., and Mends, E. A., Attenuation of heavy metals from waste oil-based drilling mud using locally produced coconut shell-based activated carbon. Ghana Mining Journal, 2021. 21(2): p. 55-61.
[5] Deng, H., Zhang, G., Xu, X., Tao, G., and Dai, J., Optimisation of preparation of activated carbon from cotton stalk by microwave assisted phosphoric acid-chemical activation. Journal of Hazardous Materials, 2010. 182(1): p. 217-224.
[6] Issabayeva, G., Aroua, M. K., and Sulaiman, N. M., Electrodeposition of copper and lead on palm shell activated carbon in a flow-through electrolytic cell. Desalination, 2006. 194(1): p. 192-201.
[7] Rahman, I. A., Saad, B., Shaidan, S., and Sya Rizal, E. S., Adsorption characteristics of malachite green on activated carbon derived from rice husks produced by chemical-thermal process. Bioresource Technology, 2005. 96(14): p. 1578-1583.
[8] Kumar Mishra, R., Singh, B., and Acharya, B., A comprehensive review on activated carbon from pyrolysis of lignocellulosic biomass: An application for energy and the environment. Carbon Resources Conversion, 2024. 7(4): p. 100228.
[9] Soleimani, M. and Kaghazchi, T., Activated Hard Shell of Apricot Stones: A Promising Adsorbent in Gold Recovery. Chinese Journal of Chemical Engineering, 2008. 16(1): p. 112-118.
[10] Navarro, M. V., Seaton, N. A., Mastral, A. M., and Murillo, R., Analysis of the evolution of the pore size distribution and the pore network connectivity of a porous carbon during activation. Carbon, 2006. 44(11): p. 2281-2288.
[11] Yalcin, M. and Arol, A. I., Gold cyanide adsorption characteristics of activated carbon of non-coconut shell origin. Hydrometallurgy, 2002. 63(2): p. 201-206.
[12] Buah, W., Mends, E., and Quartey, A. Design of a Pyrolysis Reactor for Smokeless Biomass Carbonization. in Proceedings of the 7th UMaT Biennial International Mining and Mineral Conference. 2022. Tarkwa, Ghana.
[13] Urbanic, J. E., Jula, R. J., and Faulkner, W. D., Regeneration of activated carbon used for recovery of gold. Mining, Metallurgy & Exploration, 1985. 2(4): p. 193-198.
[14] Tsamba, A. J., Yang, W., and Blasiak, W., Pyrolysis characteristics and global kinetics of coconut and cashew nut shells. Fuel Processing Technology, 2006. 87(6): p. 523-530.
[15] Demirbas, A., Effects of temperature and particle size on bio-char yield from pyrolysis of agricultural residues. Journal of Analytical and Applied Pyrolysis, 2004. 72(2): p. 243-248.
[16] Tippayawong, N., Kinorn, J., and Thavornun, S., Yields and Gaseous Composition from Slow Pyrolysis of Refuse-derived Fuels. Energy Sources, Part A: Recovery, Utilisation, and Environmental Effects, 2008. 30(17): p. 1572-1580.
[17] Buah, W. K. and Williams, P. T., Granular activated carbons from palm nut shells for gold di-cyanide adsorption. International Journal of Minerals, Metallurgy, and Materials, 2013. 20(2): p. 172-179.
[18] Adams, M. Influence of the surface chemistry and structure of activated carbon on the adsorption of aurocyanide. in 18th International Mineral Processing Congress. 1993. Sydney: Mintek.
[19] Owusu, C., Mends, E. A., and Acquah, G., Enhancing the physical qualities of activated carbon produced from palm kernel shell via response surface methodology—process variable optimisation. Biomass Conversion and Biorefinery, 2024. 14(21): p. 27233-27247.
[20] Cevallos Toledo, R. B., Aragón-Tobar, C., Gámez, S., and De La Torre, E., Reactivation Process of Activated Carbons: Effect on the Mechanical and Adsorptive Properties. Molecules, 2020. 25: p. 1681.
[21] Abdullah, A. H., Kassim, A., Zainal, Z., Hussien, M. Z., Kuang, D., Ahmad, F., and Wooi, O. S., Preparation and characterisation of activated carbon from gelam wood bark (Melaleuca cajuputi). Malaysian Journal of Analytical Sciences, 2001. 7(1): p. 65-68.
Cite This Article
  • APA Style

    Buah, W. K., Mends, E. A., Osei, L. B. (2025). Estimating the Product Quantity and Particle Size of Char and Activated Carbon Derived from Palm Kernel Shells – A Practical Approach. Advances in Materials, 14(4), 117-126. https://doi.org/10.11648/j.am.20251404.15

    Copy | Download

    ACS Style

    Buah, W. K.; Mends, E. A.; Osei, L. B. Estimating the Product Quantity and Particle Size of Char and Activated Carbon Derived from Palm Kernel Shells – A Practical Approach. Adv. Mater. 2025, 14(4), 117-126. doi: 10.11648/j.am.20251404.15

    Copy | Download

    AMA Style

    Buah WK, Mends EA, Osei LB. Estimating the Product Quantity and Particle Size of Char and Activated Carbon Derived from Palm Kernel Shells – A Practical Approach. Adv Mater. 2025;14(4):117-126. doi: 10.11648/j.am.20251404.15

    Copy | Download

  • @article{10.11648/j.am.20251404.15,
      author = {William Kwame Buah and Emmanuel Atta Mends and Linda Bentuma Osei},
      title = {Estimating the Product Quantity and Particle Size of Char and Activated Carbon Derived from Palm Kernel Shells – A Practical Approach},
      journal = {Advances in Materials},
      volume = {14},
      number = {4},
      pages = {117-126},
      doi = {10.11648/j.am.20251404.15},
      url = {https://doi.org/10.11648/j.am.20251404.15},
      eprint = {https://article.sciencepublishinggroup.com/pdf/10.11648.j.am.20251404.15},
      abstract = {In this study, activated carbons were prepared from palm kernel shells by physical activation. The methodology of experimental design was used to optimise the preparation conditions. While varying the particle size of the precursor palm kernel shells, carbonisation was done for about one hour to yield char. Activated carbon was prepared from the product char at a steam flow rate of 0.06 mol/h/g char and at a temperature of about 900°C for five hours. The empirical results were investigated to estimate the yield and particle size distribution of char and activated carbon produced from the palm kernel shells. Based on the yield and particle size analysis, a model was generated to predict product particle size and quantity in the production of activated carbon, thereby effectively utilising available raw materials and reducing preparation costs. In gold adsorption process, activated carbon of + 2.00 mm is mainly used to recover dissolved gold complexes from solutions. From data analysis and the model generated in this study, a relatively high composition of activated carbon with particle size + 2.00 mm was produced by utilising palm kernel shells precursor with particle size - 6.70 mm + 5.60 mm for carbonisation and char particle size –3.35 mm +2.80 mm for activation.},
     year = {2025}
    }
    

    Copy | Download

  • TY  - JOUR
    T1  - Estimating the Product Quantity and Particle Size of Char and Activated Carbon Derived from Palm Kernel Shells – A Practical Approach
    AU  - William Kwame Buah
    AU  - Emmanuel Atta Mends
    AU  - Linda Bentuma Osei
    Y1  - 2025/12/08
    PY  - 2025
    N1  - https://doi.org/10.11648/j.am.20251404.15
    DO  - 10.11648/j.am.20251404.15
    T2  - Advances in Materials
    JF  - Advances in Materials
    JO  - Advances in Materials
    SP  - 117
    EP  - 126
    PB  - Science Publishing Group
    SN  - 2327-252X
    UR  - https://doi.org/10.11648/j.am.20251404.15
    AB  - In this study, activated carbons were prepared from palm kernel shells by physical activation. The methodology of experimental design was used to optimise the preparation conditions. While varying the particle size of the precursor palm kernel shells, carbonisation was done for about one hour to yield char. Activated carbon was prepared from the product char at a steam flow rate of 0.06 mol/h/g char and at a temperature of about 900°C for five hours. The empirical results were investigated to estimate the yield and particle size distribution of char and activated carbon produced from the palm kernel shells. Based on the yield and particle size analysis, a model was generated to predict product particle size and quantity in the production of activated carbon, thereby effectively utilising available raw materials and reducing preparation costs. In gold adsorption process, activated carbon of + 2.00 mm is mainly used to recover dissolved gold complexes from solutions. From data analysis and the model generated in this study, a relatively high composition of activated carbon with particle size + 2.00 mm was produced by utilising palm kernel shells precursor with particle size - 6.70 mm + 5.60 mm for carbonisation and char particle size –3.35 mm +2.80 mm for activation.
    VL  - 14
    IS  - 4
    ER  - 

    Copy | Download

Author Information
  • Abstract
  • Keywords
  • Document Sections

    1. 1. Introduction
    2. 2. Experimental Investigations
    3. 3. Results and Discussion
    4. 4. Model Derivation
    5. 5. Conclusions
    Show Full Outline
  • Author Contributions
  • Conflicts of Interest
  • References
  • Cite This Article
  • Author Information