Research Article | | Peer-Reviewed

Evaluation of Mutagenic Potential of Nitrosamines Using the Enhanced Ames Test with Hamster Liver S9 Activation

Received: 17 July 2026     Accepted: 30 July 2026     Published: 20 August 2026
Views:       Downloads:
Abstract

Nitrosamines (NAs) and Nitrosamine Drug Substance-Related Impurities (NDSRIs) have recently drawn significant attention because of their strong links to cancer and genetic damage. The standard Ames test, described in Organisation for Economic Co-operation and Development (OECD) Guideline 471, is widely used to assess mutagenicity, but it often struggles with certain nitrosamines, especially those requiring complex metabolic activation or producing weak signals at low doses. To address these limitations, regulators now recommend the Enhanced Ames Test (EAT) for improved sensitivity. In this study, we assessed three nitrosamines, N-nitrosodimethylamine (NDMA), 1?cyclopentyl?4?nitrosopiperazine (CPNP), and N-nitrosodiethylamine (NDEA), using the EAT. We began with cytotoxicity evaluations in Salmonella typhimurium (S. typhi.) strains TA100 and TA1535 to determine the highest non-toxic doses. Each compound was then preincubated with 30% liver S9 enzymes from rats and hamsters for 30 minutes to better replicate metabolic activation. Hamster S9 produced stronger mutagenic responses than rat S9. Among the tested strains, TA1535 showed the highest sensitivity. NDMA produced 2.3-2.7?fold higher mutagenicity in TA1535 compared with other strains. CPNP showed an even stronger effect, with a five?fold increase. NDEA was the most potent, generating nearly a five?fold stronger response with hamster S9 than with rat S9 (88.7?fold vs. 17.2?fold per dose). Overall, these findings highlight that the EAT, combined with optimized metabolic activation, is a robust approach for detecting mutagenic nitrosamines that may otherwise remain undetected.

Published in Biochemistry and Molecular Biology (Volume 11, Issue 3)
DOI 10.11648/j.bmb.20261103.11
Page(s) 42-58
Creative Commons

This is an Open Access article, distributed under the terms of the Creative Commons Attribution 4.0 International License (http://creativecommons.org/licenses/by/4.0/), which permits unrestricted use, distribution and reproduction in any medium or format, provided the original work is properly cited.

Copyright

Copyright © The Author(s), 2026. Published by Science Publishing Group

Keywords

Nitrosamines/NDSRIs, Enhanced Ames Test, Metabolic Activation, Mutagenicity

1. Introduction
Nitrosamines (NA) encompass a diverse array of compounds characterised by an O=N-NR2 core. Among these, there exists a specific group known as Nitrosamine Drug Substance-Related Impurities (NDSRIs), which represent the nitrosated variants of active pharmaceutical ingredients (API) . It may be carcinogenic and mutagenic, and in certain instances, it has been demonstrated to be more potent rodent carcinogens than non-NAs, according to nonclinical safety studies . Although the human body produces certain NAs endogenously, other NAs can be obtained from the surroundings (air, water, and soil), in food and drink, and from additional causes (cigarette usage, pesticides, nutraceuticals, and manufactured items) . More recently, several NAs were identified as trace impurities in pharmaceutical products, such as drugs and cosmetics .
NAs may be broadly classified into two groups: (a) big and complex NDSRIs, such as N-nitrosophenmetrazine and N-nitroso propranolol; and (b) tiny and simple molecular NAs, such as NDMA and NDEA . Numerous NAs are categorised as animal carcinogens. Out of the NAs examined, 81% were judged carcinogenic in animals. Because of their mutagenic mode of action, the majority of NAs are thought to be carcinogenic . Furthermore, 81% of the 381 NAs evaluated in Ames were shown to be mutagenic . The most probable explanation is that the majority of NAs, though not all of them, are carcinogenic because of their distinctive nitroso functional group (-NO) attached to an amine (-NH2), which is known to promote Deoxyribonucleic Acid (DNA) alkylation and mutagenesis. It has previously been demonstrated that not all NA compounds pose the same level of, if any, carcinogenic risk; potency varies widely and is dependent upon structural features present . Studies on the genotoxicity and carcinogenicity of NAs have significantly increased since the initial discovery of NDMA's tumorigenic potential in 1967 .
In recent years, regulatory authorities have expressed worry about the carcinogenic potential of a significant percentage of compounds that are members of the NA family. The reason for this is that in the past few years, several NAs chemical structures have been judged to be inconsistent with the Ames test accuracy of rodent carcinogenicity; namely, they pass the Ames test as negative, but the rodent cancer bioassay turned back positive, and issues were initially noticed in 1979 .
Therefore, the discovery of dangerous quantities of NAs in human medicinal products has sparked safety concerns, prompting medicine recalls. Because of their mutagenic and carcinogenic properties, NAs are categorised as a "cohort of concern" by the ICH M7(R2) guideline . Clinically, NDSRIs could present a risk due to their potential carcinogenicity; as a result, the European Medicines Agency (EMA) , US Food and Drug Administration (FDA) and Health Canada have issued guidelines emphasising the importance of estimating the carcinogenic potential and acceptable intake (AI) thresholds of NAs. The latest identification of NA impurities in medicinal compounds, which resulted in product recalls and the ensuing enforcement of risk assessment guidelines around the world, has increased the need for effective techniques to aid in searching for signs of mutagenic and thus carcinogenic potential . The test of choice for identifying mutagenic potential in vitro and the standard of excellence for predicting carcinogenicity in vivo is the Ames test.
The bacterial reverse mutation test, also referred to as the Ames test since it was invented by Bruce Ames at the beginning of the 1970s, is a widely utilised assay to evaluate chemically induced gene mutation . A variety of Salmonella typhimurium (S. typhi.) and Escherichia coli (E. Coli) bacterial strains are employed in this short-term test, which is especially focused on identifying a wide range of DNA reactive compounds that cause fixed gene mutation. To determine the mutagenic impact of novel chemical molecules, potent pharmaceutical compounds or suspected genotoxic contaminants in pharmaceutical goods . Assay sensitivity was examined in a few studies, which also found a strong relationship between carcinogenicity in the rodent cancer bioassay and mutagenicity in the Ames test. With strong convergence, a mutagenic reaction in the Ames test may forecast rodent carcinogenicity with a range of around 90% to 77% .
The constraints of the Ames test, such as the use of only 10% induced rat liver S9 to identify the mutational potential of NA, have drawn criticism from regulatory bodies, leading to requests for more sensitive assay scenarios, such as the use of 30% S9 from multiple species, pre-incubation, and NA-specific controls . To circumvent this, a lot of studies recommend undertaking range-finding or preliminary cytotoxicity testing (PCYT) with one or two highly sensitive tester strains. Due to its broad sensitivity to a wide range of carcinogenic compounds, the commonly employed set of S. typhi. strains TA98 and TA100 performs well in the Ames assay .
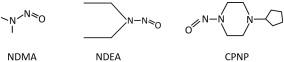
This study investigates the impact of experimental assay parameters on the EAT in detecting potential mutagenicity in NA. Using OECD TG 471 techniques, three compounds were chosen: NDMA, NDEA, and CPNP, as illustrated in Figure 1. Following PCYT outcomes, NA dosages were chosen for the pre-incubation procedure, which employed the EAT methodology to ascertain whether assay sensitivity was impacted by exposure to the test compounds in the test system (before adding agar). We compared the impact of rat and hamster-induced liver S9 on mutagenesis potency, as metabolic activation of NAs may vary by species. In a PCYT, TA100 and TA1535 were employed, and strains TA98, TA100, TA1535, TA1537, and E. Coli were selected due to new data showing their exceptional sensitivity in identifying the DNA alkylation-driven mutagenicity trait of NA under the EAT. The findings were computed using the fold increase and number of revertant colonies compared to different strains, NA, and liver S9 fractions.
Figure 1. Chemical structures of nitrosamine compounds tested.
Nitrosamines are chemical compounds that have an amine (R2N−N=O) attached to a nitroso group (NO−), where R generally represents an alkyl group. It can be mutagenic and pose health hazards. N-nitrosodimethylamine (NDMA), N-nitrosodiethylamine (NDEA), and 1-cyclopentyl-4-nitropiperazine (CPNP) are popular examples.
The results of these tests are presented, along with a combination of advanced qualitative and quantitative modelling tools used to examine the data and establish which improved EAT assay criteria were most accountable for the entire mutagenic potency. This research suggests a streamlined, resource-efficient approach for NA screening while assessing the strains' sensitivity and consistency under optimal test conditions in an effort to cut down on time, cost, and indirect rodent utilisation.
2. Materials and Methods
2.1. Preparation of Bacterial Culture
To prepare the bacterial cell suspension, 40 µl of frozen culture was transferred into 10 mL of Oxoid nutritional broth and incubated at 37°C, 120 rpm, in a shaking incubator for 16 hours, and the optical density was adjusted between 0.90-1.2 at 600 nm, which is within the desired cell count of 1-2×10⁹ CFU/mL.
2.2. Media Preparation
Before the experiment, the test facility will be prepared with minimal glucose agar plates containing a sterile 50X VB medium E salt solution and a 40% glucose solution. The overlay or top agar was formulated using Agar (6.0 g) (CAS #9002-18-0) obtained from HiMedia Laboratories Private Limited, NaCl (5.0 g) (CAS #7647-14-5) from SRL Sisco Research Laboratories Pvt. Ltd., L-histidine (96 mg) (Product No. #H10609) from NICE chemicals, and D-biotin (123.6 mg) (CAS #58-85-5) from Hyma Synthesis Pvt. Ltd. for one liter. The sterilisation process was conducted at 121°C for a duration of 15 minutes in an autoclave.
2.3. Bacterial Strains
S. typhi. tester strain TA98 (Batch #5945D), TA100 (Batch #5955D), TA1535 (Batch #5949D), TA1537 (Batch #5954D) and E. Coli WP2 trp uvrA pKM101 (Batch #5942D) were procured from MOLTOX, Molecular Toxicology, Inc. 157 Industrial Park Drive, Boone, NC 28607, U.S.A. Cryovials containing all strains were preserved in liquid nitrogen. Working cultures were preserved on suitable master plates kept in a refrigerator. The spectrum of mutation detection has been examined for each strain, as detailed in Table 1.
Table 1. Strain Specific Mutagenicity.

S. typhimurium and E. Coli WP2 uvrA (PKM101)

Strains

Genotype

Types of mutation indicated

Comments

TA98

his D 3052; rfa-; uvrB-; R-factor

Frame shift mutations

No Frame shift detection

TA100

his G 46; rfa-; uvrB-; R-factor

Base-pair substitutions

G→A transitions

TA1535

his G 46; rfa-; uvrB-

Base-pair substitutions

G→A transitions

TA1537

his C 3067; rfa-; uvrB-

Frame shift mutations

No Frame shift detection

E. Coli

trpE65 uvrA; pKM101

All possible transitions and transversions

Moderate Base-pair

2.4. Metabolic Activation System
Hamster (VBPL/S9/001/2023) and rat S9 fractions (VBPL/S9/002/2023) were prepared in Vipragen Biosciences Pvt. Ltd. These fractions served as an external metabolizing system. The 30% rat S9 mixture was enriched with Milli-Q water (1.35 mL), 100M Sodium phosphate buffer (pH 7.4) (5.00 mL) (CAS #7558-79-4) procured from SRL Sisco Research Laboratories Pvt. Ltd., 4mM NADP (0.40 mL) (CAS #53-84-9) from Loba Chemie Laboratory Reagents and Fine Chemicals, 8mM MgCl2 (0.20 mL) (CAS #7791-18-6) from Avra Synthesis Private Limited, 5mM D-Glucose-6-phosphate (0.05 mL) (CAS #3671-99-6) from SRL Sisco Research Laboratories Pvt. Ltd., and rat S9 fraction (3.00 mL) induced by Sodium Phenobarbitone (40 mg/kg BW) (Batch No. #GEM 23007) from Abbott, and B-naphthoflavone (100 mg/kg BW) (CAS #6051-87-2) from Tokyo Chemical Industry (India) Pvt. Ltd., for 10 mL. In the 30% hamster S9 mixture, all components remain unchanged; however, instead of the rat S9 fraction, the hamster S9 fraction have protein content 21.91 g/L is used .
2.5. Compounds and Solvent Vehicles
N-Nitrosodimethylamine (CAS #62-75-9), N-Nitrosodiethylamine (CAS #55-18-5) and 1-cyclopentyl-4-nitrosopiperazine (CAS #61379-66-6) were purchased from Dr. ChemLab (Unnao, India), Sigma-Aldrich, and Clearsynth Labs (Mumbai, India), respectively. Milli-Q water was obtained from an in-house Milli-Q system (Merck, Model IQ7005), and dimethyl sulfoxide (DMSO) (CAS #67-68-5) was purchased from HiMedia Laboratories. Positive controls, including 2-Nitrofluorene, 4-Nitroquinoline N-oxide (CAS #56-57-5), Acridine Mutagen (ICR191) (CAS #17070-45-0), and 2-Aminoanthracene (CAS #613-13-8), were sourced from Sigma-Aldrich, and Sodium Azide (CAS #26628-228) was acquired from Avra Synthesis Pvt. Ltd.
2.6. Solubility and Precipitation Test
To determine the suitable solvent and concentration of the test substance for the PCYT study, tests for solubility at 50 mg/mL and precipitation at 5000, 4000, 3000, 2000, 1000, 500, 250, and 125 µg/plate were conducted using Milli-Q water and DMSO.
2.7. Preliminary Cytotoxicity Test
A preliminary cytotoxicity test was conducted for NDMA, CPNP, and NDEA utilising tester strains TA100 and TA1535, both with (30% rat and hamster) and without a metabolic activation system, employing the pre-incubation method. Eight different concentrations (5000, 4000, 3000, 2000, 1000, 500, 250, and 125 µg/plate) were evaluated to assess toxicity in NDMA and NDEA. Whereas, four concentrations (500, 150, 50 and 15 µg/plate) were tested to check mutagenicity in CPNP, as the highest stock concentration available from the vendor was 5 mg/mL. Following solidification, the plates were placed in an inverted position and incubated at 37°C.
From the preliminary results, no cytotoxicity results were observed at the highest concentrations across NDMA and NDEA in TA100 and TA1535 of bacterial lawn and revertant colonies (data not included). Given the high expenses, considerable waste, and the complexity involved, we selected an intermediate concentration of NDMA and NDEA for this research, omitting 5000 µg/plate in both NDMA and NDEA.
2.8. Dose Selection for the Definitive Study
According to the findings of the preliminary study, concentrations of 2000, 600, 200 µg/plate for NDMA, 500, 150, 50 µg/plate for CPNP, and 1000, 300, 100 µg/plate for NDEA were chosen for the definitive study, spaced approximately by a half-log factor, both with and without the metabolic activation system for the tester strains TA98, TA100, TA1535, TA1537, and E. Coli.
2.9. Experimentation
The EAT was performed following OECD 471 and ICH S2(R1) test guidelines, incorporating slight modifications suggested for the testing of NA . 0.1 mL of a 50 mg/mL NDMA solution, 0.5 mL of a 30% v/v S9 mix, and 0.1 mL of each tester strain were added to the sterile tube. The tubes were placed in a shaking incubator set at 120 rpm and maintained at a temperature of 37°C for a duration of 30 minutes. After the incubation period, 2 mL of top agar (12 mg Agar, 10mg NaCl, 0.129 mg L-Histidine, 0.247 mg D-Biotin) was supplemented with either a 0.5 mM histidine-biotin solution (designated for S. typhi. strains) or a 0.5 mM tryptophan solution (intended for the E. Coli strain). The compositions were mixed and applied onto the surface of minimal glucose agar plates. Once the upper layer had solidified, the plates were turned upside down and incubated at a temperature of 37 ± 1°C for a duration of 51 hours and 30 minutes. Revertant colonies were counted manually. Furthermore, the bacterial background lawn was analysed microscopically at a magnification of 10X to identify any indications of cytotoxicity. The increase in fold per microgram of NA serves as a measure to evaluate the mutagenic potency of each NA. In the meantime, the evaluation of strains, the metabolic activation system, and the mutagenicity of NA is represented as the logarithm of the fold increase per microgram/plate concentration.
2.10. Statistical Analysis
Statistical analyses were performed with GraphPad Prism (version 10.6.1). Descriptive statistics were calculated for each observation. Tukey's multiple comparison test was used to determine data normality.
3. Results
3.1. Solubility and Precipitation Test
NDMA and NDEA were discovered to be soluble in Milli-Q water at a concentration of 50.00 mg/mL, which was chosen as the solvent. Consequently, a concentration of 5000 µg/plate was chosen as the highest concentration for the PCYT for both NDMA and NDEA. CPNP was determined to be soluble in DMSO (14% in the reaction mixture before adding top agar in the pre-incubation method) at a concentration of 5.0 mg/mL, and 500 µg/plate was selected as the highest concentration for the PCYT.
3.2. Preliminary Cytotoxicity
NDMA and NDEA were found to be soluble in Milli-Q water, which served as a solvent, and there was no precipitation at the measured concentration. Equally, CPNP was shown to be soluble in DMSO, which was used as the solvent, and no precipitation occurred at the studied concentration. No cytotoxicity was observed in TA100 and TA1535 to both bacterial lawn and revertant colonies at and up to the concentration of 5000 µg/plate in both NDMA and NDEA. Similarly, no cytotoxicity was observed in TA100 and TA1535 to both bacterial lawn and revertant colonies at and up to the concentration of 500 µg/plate in CPNP.
3.3. Definitive Study
3.3.1. Differential S9-mediated Mutagenicity
In the EAT, S. typhi. strains (TA98, TA100, TA1535, TA1537) and E. Coli were utilised to evaluate the mutagenicity of NDMA, CPNP, and NDEA, employing 30% hamster S9 and rat S9. Mutagenicity was assessed based on the fold increases in mean value and the number of revertant colonies (Table 2 to Table 4). However, in the tester strain TA1535 with a 30% hamster metabolic activation system, CPNP displayed the highest mutagenic reaction in the form of a fold increase value. In contrast to this, TA98 observed negligible variations in the fold increase of both hamster S9 and rat S9 when exposed to NDMA, CPNP, and NDEA.
TA98
At 2000 μg/plate of NDMA, 500 μg/plate of CPNP, and 1000 μg/plate of NDEA in the hamster S9 fraction, TA98 showed 1.2, 1.1, and 1.2-fold increases in mean, respectively. Similarly, rat S9 did not exhibit any significant results (fold increase mean: 0.9, 1.0, and 1.1) at the above concentrations of NDMA, CPNP, and NDEA. Therefore, in hamster S9 and rat S9, NDMA, CPNP, and NDEA did not result in any fold increase or mutagenesis effects.
TA100
In TA100, with hamster S9, NDMA and NDEA produced substantial mutagenic reactions (fold increases mean: 3.6 for 2000 μg/plate and 3.8 for 1000 μg/plate), while neither NDMA nor NDEA caused mutagenic responses in rat S9. Similarly, 1.4- and 1.1-fold increases in mean were observed at 500 μg/plate of CPNP in hamster S9 and rat S9, respectively, which did not exhibit mutagenic effects.
TA1535
In hamster S9 of NDMA (2000 μg/plate), there was a 5.4-fold increase in the mean, which was double that of rat S9. NDEA (1000 μg/plate) led to significant mutagenesis results, showing more than a two-fold increase in the mean from hamster S9 (5.5) to rat S9 (2.7).
In a similar vein, CPNP at 500 μg/plate exhibited the highest mutagenicity with hamster S9 (fold increase mean: 87.8) compared to rat S9 (fold increase mean: 17.2), which was observed as more than 5-fold increase. Consequently, among all strains, TA1535 excelled by achieving over a 2-fold increase, resulting in the highest mutagenesis output across all NDMA, CPNP, and NDEA.
TA1537
NDMA (2000 μg/plate) and CPNP (500 μg/plate) exhibited no significant fold increase in mean values in the hamster S9 fraction (1.2 and 0.9), when compared to the rat S9 fraction (0.9 and 0.8). However, in the NDEA (1000 μg/plate) concentration, the hamster S9 (1.8) showed a more than two-fold increase compared to the rat S9 (0.8). Like TA98, hamster S9 and rat S9 showed no fold increase or mutagenic impacts to NDMA and CPNP.
E. Coli
When exposed to NDMA (2000 μg/plate), hamster S9 (3.2) displayed around three times the mutagenic impact as rat S9 (1.2). Once more, hamster S9 (3.0) faced nearly three times the mutagenesis effect compared to rat S9 (1.1) when subjected to NDEA (1000 μg/plate). Furthermore, hamster S9 exhibited nearly twice the mutagenesis effect compared to rat S9 when subjected to CPNP (500 μg/plate).
3.3.2. Strain Sensitivity to Nitrosamines
NDMA
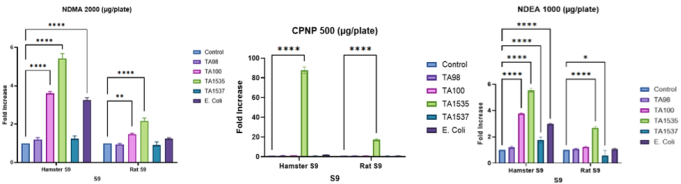
Tukey's multiple comparisons test was used to statistically evaluate the strain-specific sensitivity of NDMA to hamster S9 (30%) using normalised mutagenic potency (fold increase µg/plate). When hamster S9 was present, TA1535 was far more mutagenic than both TA100 (p 0.0001) and E. Coli (p 0.0001). This study's data demonstrated that utilising preincubation protocols with TA100, TA1535, and E. Coli effectively predicts the mutagenicity of NA in hamster S9. Among these, TA1535 exhibited the highest sensitivity, yielding the most significant mutagenic response. In addition, TA98 and TA1537 did not differ from one another (p >0.9999). TA1535 continued to be more sensitive than TA100 with rat S9 (p = 0.0013), whereas TA98, TA1537, and E. Coli showed no change, as represented in Figure 2 and Table 2.
Table 2. Mutagenic activity of N-nitrosodimethylamine (NDMA) at various concentrations in S. typhi and E. Coli strains in the presence of hamster and rat S9 by using No. of revertant colonies (R.C.) Standard deviation (SD) and fold increase (F.I.).

NDMA

Conc. (µg/plate)

Metabolic activation system

TA98

TA100

TA1535

TA1537

E. Coli

No. of R.C.

SD

F.I.

No. of R.C.

SD

F.I.

No. of R.C.

SD

F.I.

No. of R.C.

SD

F.I.

No. of R.C.

SD

F.I.

2000

Hamster S9

42.33

2.52

1.20

606.67

14.05

3.60

85.33

4.51

5.40

14.33

1.53

1.20

436.00

14.42

3.20

Rat S9

34.00

2.00

0.90

234.67

14.05

1.50

33.00

2.00

2.20

11.67

2.08

0.90

158.67

6.11

1.20

-S9

34.67

3.51

1.00

168.00

8.00

1.10

14.67

2.08

1.00

11.33

1.53

1.20

145.00

4.00

1.10

600

Hamster S9

34.00

2.65

1.00

544.00

12.00

3.20

44.00

3.61

2.80

11.33

1.15

1.00

313.33

8.33

2.30

Rat S9

33.00

2.00

0.90

206.67

10.07

1.30

24.33

2.52

1.60

11.67

1.53

0.90

152.00

3.00

1.20

-S9

31.67

1.53

1.00

157.33

6.11

1.00

14.33

2.08

1.00

10.00

2.00

0.90

152.00

3.61

1.20

200

Hamster S9

35.00

3.61

1.00

309.33

16.65

1.80

39.67

2.52

2.50

11.00

2.00

0.90

206.67

6.11

1.50

Rat S9

32.00

2.00

0.90

194.67

8.33

1.20

19.67

1.53

1.30

10.00

1.00

0.80

155.67

3.97

1.20

-S9

35.67

1.53

1.00

166.67

6.11

1.10

12.67

1.53

1.00

10.33

1.53

1.00

142.67

4.04

1.10

Vehicle control

Hamster S9

35.67

2.08

1.00

168.00

8.00

1.00

15.67

2.08

1.00

11.67

2.08

1.00

134.33

5.51

1.00

Rat S9

36.67

2.08

1.00

161.33

8.33

1.00

15.33

2.08

1.00

13.33

1.53

1.00

130.33

5.31

1.00

-S9

35.00

2.65

1.00

156.00

4.00

1.00

14.33

3.21

1.00

10.67

1.53

1.00

132.00

6.24

1.00

Positive control

Hamster S9

658.67

12.22

18.50

916.00

8.00

5.50

606.67

10.07

38.70

546.67

16.17

46.90

905.33

10.07

6.70

Rat S9

652.00

12.00

17.80

922.67

12.22

5.70

601.33

12.22

39.20

538.67

14.05

40.40

849.67

12.22

6.90

-S9

598.67

10.07

17.10

830.67

14.05

5.30

518.67

18.04

36.20

498.67

8.33

46.80

922.67

14.05

7.00

Note: Positive control of -S9 for TA98: 2-NF, TA100 and TA1535: SA, TA1537: ICR, E. Coli: 4-NQO, Positive control of Hamster S9 and Rat S9 for all strains is 2-AA.
Figure 2. Strain sensitivity of NDMA, CPNP, and NDEA across multiple tester strains within hamster and rat S9 metabolic activation: Comparative mutagenicity of NDMA (2000 µg/mL), CPNP (500 µg/mL), and NDEA (1000 µg/mL) in S. typhi (TA98, TA100, TA1535, TA1537) and E. Coli tester strains within hamster and rat S9 mix. Bars represent fold increase in revertant colonies relative to controls. Hamster S9 generated stronger responses for NDMA and NDEA (notably in TA100 and TA1535), whereas CPNP yielded substantial activity only in TA1535. Data are presented as mean ± SEM. Statistical significance: **** p <0.0001, *** p <0.001, ** p <0.01, * p <0.05.
CPNP
In EAT, only TA1535 demonstrated mutagenicity in both hamster S9 (p <0.0001) and rat S9 (p <0.0001). Whereas, in hamster S9, differences between TA98 (p >0.9999), TA100 (p =0.9962), TA1537 (p >0.9999), and E. Coli (p =0.8788) were not statistically significant. Similarly, in rat S9, differences between TA98 (p >0.9999), TA100 (p >0.9999), TA1537 (p =0.9997) and E. Coli (p >0.9999) were not statistically significant (Figure 2 and Table 3).
Table 3. Mutagenic activity of 1-Cyclopentyl-4-nitrosopiperazine (CPNP) at various concentrations in S. typhi and E. Coli strains in the presence of hamster and rat S9 by using No. of revertant colonies (R.C.), Standard deviation (SD) and fold increase (F.I.).

CPNP

Conc. (µg/plate)

Metabolic activation system

TA98

TA100

TA1535

TA1537

E. Coli

No. of R.C.

SD

F.I.

No. of R.C.

SD

F.I.

No. of R.C.

SD

F.I.

No. of R.C.

SD

F.I.

No. of R.C.

SD

F.I.

500

Hamster S9

39.00

6.24

1.10

247.33

6.03

1.40

1462.67

56.05

87.80

10.00

2.00

0.90

267.67

12.50

1.90

Rat S9

39.33

3.51

1.00

185.33

9.02

1.00

286.67

15.01

17.20

9.00

2.00

0.80

139.33

7.09

1.00

-S9

36.67

3.51

0.90

206.00

8.72

1.20

124.00

8.19

7.30

9.33

2.25

0.80

130.33

5.13

1.00

150

Hamster S9

36.33

3.51

1.00

215.67

8.74

1.20

1288.00

48.00

77.30

8.00

2.65

0.80

212.00

12.00

1.50

Rat S9

36.00

3.00

0.90

179.67

9.07

1.00

239.67

14.57

14.40

9.00

2.65

0.80

134.00

7.55

0.90

-S9

38.67

3.06

1.00

198.00

15.87

1.10

54.00

5.57

3.20

9.33

1.53

0.80

132.33

5.13

1.00

50

Hamster S9

37.00

2.00

1.00

226.33

12.50

1.30

550.67

30.02

33.00

8.67

1.53

0.80

143.33

7.02

1.00

Rat S9

40.33

2.25

1.00

194.00

9.17

1.00

226.33

11.24

13.60

9.33

1.53

0.80

136.67

6.51

1.00

-S9

35.33

3.51

0.90

187.33

8.02

1.10

32.33

4.51

1.90

8.33

3.21

0.70

133.67

6.51

1.00

Vehicle control

Hamster S9

35.67

3.06

1.00

177.67

5.51

1.00

16.67

1.53

1.00

10.67

2.08

1.00

142.00

4.58

1.00

Rat S9

39.67

1.53

1.00

181.67

6.51

1.00

16.67

2.08

1.00

11.67

1.53

1.00

142.33

7.02

1.00

-S9

39.67

3.51

1.00

172.67

5.03

1.00

17.00

1.00

1.00

12.00

2.00

1.00

136.67

5.69

1.00

Positive control

Hamster S9

742.67

24.11

20.80

970.00

14.00

5.50

617.33

16.65

37.00

518.56

18.90

48.60

978.67

14.05

6.90

Rat S9

746.67

32.33

18.80

966.67

26.03

5.30

652.00

20.00

39.10

514.67

20.53

44.10

957.33

24.44

6.70

Hamster -S9

661.33

22.74

16.70

816.00

24.00

4.70

581.33

14.05

34.20

648.00

16.00

54.00

920.00

12.00

6.70

Note: Positive control of -S9 for TA98, TA100 and TA1535: SA, TA1537: ICR, E. Coli: 4-NQO, Positive control of Hamster S9 and Rat S9 for all strains is 2-AA.
NDEA
In the presence of hamster S9, TA1535 exhibited significantly higher mutagenicity than TA100 (p <0.0001), TA1537 (p <0.0001) and E. Coli (p <0.0001). With rat S9, TA1535 remained more sensitive than TA1537 (p = 0.0175). While TA98 (p =0.9934) did not show any difference in hamster S9, TA98 (p =0.9934), TA100 (p =0.4165), and E. Coli (p =0.9934) did not show any difference in rat S9, as mentioned in Figure 2 and Table 4. These results confirm that TA1535 showed the highest mutagenicity as compared to other tested strains.
Table 4. Mutagenic activity of N-nitrosodiethylamine (NDEA) at various concentrations in Salmonella typhimurium and E. Coli strains in presence of hamster and rat S9 by using No. of revertant colonies (R.C.), Standard deviation (SD) and fold increase (F.I.).

NDEA

Conc. (µg/plate)

Metabolic activation system

TA98

TA100

TA1535

TA1537

E. Coli

Mean No. of R.C.

SD

F.I.

Mean No. of R.C.

SD

F.I.

Mean No. of R.C.

SD

F.I.

Mean No. of R.C.

SD

F.I.

Mean No. of R.C.

SD

F.I.

1000

Hamster S9

45.33

2.52

1.20

597.33

10.07

3.80

72.00

2.00

5.50

19.67

2.08

1.80

438.67

10.07

3.00

Rat S9

37.33

2.08

1.10

205.33

12.22

1.20

41.33

1.53

2.70

10.67

1.15

0.80

161.33

6.11

1.10

-S9

33.00

2.65

0.90

158.67

6.11

1.10

15.33

1.53

1.10

10.33

1.53

0.80

147.00

5.00

1.00

300

Hamster S9

41.33

2.52

1.10

433.33

6.11

2.70

51.33

1.53

3.90

14.33

1.53

1.30

321.33

14.05

2.20

Rat S9

35.33

2.08

1.00

182.67

6.11

1.10

22.67

1.53

1.50

10.67

1.53

0.80

158.00

6.00

1.10

-S9

34.00

1.00

1.00

156.00

8.00

1.00

13.00

2.00

1.00

10.00

1.00

0.80

149.33

6.11

1.00

100

Hamster S9

33.67

2.08

0.90

325.33

10.07

2.10

34.33

2.08

2.60

12.33

1.51

1.10

213.33

10.07

1.40

Rat S9

32.67

2.08

1.00

170.67

8.33

1.00

17.00

2.00

1.10

9.00

1.00

0.70

152.67

4.16

1.00

-S9

31.67

1.53

0.90

161.33

6.11

1.10

12.33

1.53

0.90

12.00

1.00

0.90

155.67

4.04

1.00

Vehicle control

Hamster S9

37.67

2.52

1.00

158.67

6.11

1.00

13.00

2.00

1.00

11.00

1.00

1.00

148.00

3.00

1.00

Rat S9

34.33

1.53

1.00

166.67

6.11

1.00

15.33

1.53

1.00

13.33

0.58

1.00

150.33

4.51

1.00

-S9

35.33

1.53

1.00

149.33

6.11

1.00

13.67

2.08

1.00

1.53

1.53

1.00

149.33

6.11

1.00

Positive control

Hamster S9

652.00

12.00

17.30

914.67

10.07

5.80

62.67

12.22

47.90

562.67

10.07

51.20

924.00

14.42

6.20

Rat S9

660.00

12.00

19.20

918.67

10.07

5.50

609.33

14.05

39.70

540.00

8.00

40.50

902.67

8.33

6.00

-S9

617.33

22.74

17.50

864.00

14.42

5.80

512.00

18.33

37.50

520.00

20.00

41.10

917.33

14.05

6.10

Note: Positive control of -S9 for TA98: 2-NF, TA100 and TA1535: SA, TA1537: ICR, E. Coli: 4-NQO
Positive control of Hamster S9 and Rat S9 for all strains is 2-AA.
3.3.3. Effect of S9 on Mutagenic Potency
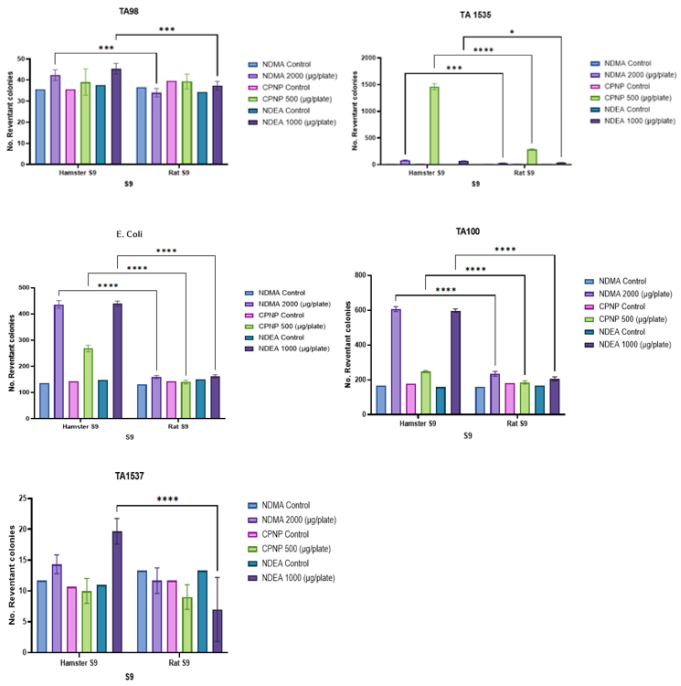
The metabolic activation efficiency of hamster and rat S9 was compared using normalised mutagenic potency (number of revertant colonies), statistically analysed using Tukey’s multiple comparisons test. Hamster S9 consistently yielded significantly higher potency in NDMA, CPNP and NDEA as indicated below.
NDMA (2000 μg/plate)
Across all tester strains, hamster S9 had considerably greater mutagenesis activity than rat S9. In the TA98 strain, the hamster system had a significantly larger mean revertant colony count (42.33) than the rat system (34.00), with p =0.0003. Moreover, a greater statistical deviation (SD) value has been noted in hamsters (2.52) when compared to rats (2.00). In a similar vein, hamster S9 showed a substantially larger response (606.67) for TA100 than rat S9 (234.67), with a very significant p-value (p < 0.0001), although the SD difference was negligible.
A comparable trend was observed in the TA1535 strain, where the hamster-derived response (85.33) was much bigger than the rat-derived response (33.00) (p <0.0001) with SD values of 4.51 for hamsters and 2.00 for rats. In TA1537, the difference between hamster (14.33) and rat (11.67) revertant colony count was less but still statistically significant (p = 0.0314) accompanied by SD values for hamster (1.53) and rat (2.08). For the E. Coli strain, the hamster system again showed a substantially elevated mutagenic response (436.00) relative to the rat system (158.67), with high statistical significance (p < 0.0001), and the SD value doubled in hamster (14.42) compared to rat (6.11) illustrated in Figure 3 and Table 2.
CPNP (500 μg/plate)
Hamster (39.00) and rat S9 (36.00) revertant colony numbers for TA98 were similar, and the difference was not statistically significant (p =0.9007). Additionally, a value of twice the SD was noted in hamsters (6.24) in contrast to rats (3.51). This suggests that both metabolic systems produce comparable amounts of mutagenic chemicals for frameshift mutations identified by TA98. Conversely, when hamster S9 (247.33) was present, TA100 displayed far more revertant numbers than rat S9 (206.00) (p <0.0001), yet the SD in hamsters was less than that observed in rats, as shown in Figure 3 and Table 3. This implies that base-pair substitution mutations result from hamster S9 producing more or more potent mutagenic intermediates.
TA1535 showed a very noticeable difference, with hamster S9 (1462.67) having a much higher revertant frequency than rat S9 (123.33) (p <0.0001). Additionally, SD was also five times more pronounced in the hamster (56.05) relative to the rat (15.01). Hamster S9 is significantly more effective in transforming the test chemical into mutagenic forms that this strain can detect, indicating a high species-specific metabolic activation impact. Identical to TA98, there was no discernible difference between hamster (10.00) and rat S9 (9.00) in revertant colonies and SD for TA1537 (p =0.5119), indicating equivalent activation effectiveness for the frameshift events this strain evaluated.
Lastly, E. Coli WP2 showed considerably greater revertant counts and SD with hamster S9 (267.67) (12.50) than with rat S9 (139.33) (7.09) (p < 0.0001), suggesting that hamster S9 had increased metabolic activation for the mutagenic lesions this strain reported.
NDEA (1000 μg/plate)
The revertant colony count was constant and statistically significant (p <0.0001), suggesting that hamster liver enzymes greatly accelerated the test compound's metabolic processing into mutagenic metabolites. Hamster S9 generated 45.33 revertant colony count and an SD of 2.52 for TA98, a strain susceptible to frame-shift mutations, more than the 37.33 revertant count and 2.08 SD with rat S9. This impact indicates a steady increase in mutagenic stimulation in enzymes obtained from hamsters, despite a minor absolute divergence.
The change was more obvious in TA100, which found base-pair substitution alterations. Rat S9 produced 205.33 revertant colonies and 12.22 SD, whereas hamster S9 produced 597.33 revertant colonies and 10.07 SD, almost triple as many, with p <0.0001. This significant rise suggests that the NDEA may be primarily converted into potent DNA-modifying mutagens by hamster metabolic enzymes.
Similarly, hamster S9 generated 72.00 and 19.67 revertant colonies, respectively, for TA1535 and TA1537, allowing both to detect certain frameshift and base-pair alterations, far more than the 41.33 and 10.67 found with rat S9, and both had p <0.0001. These results support hamster S9's greater ability to bioactivate NDEA. The pattern continued in E. Coli, where hamster S9 produced 438.67 revertant counts and 10.07 SD as opposed to rat S9's 161.33 and 6.11, continuing with a significant p-value of <0.0001. This suggests that the increased mutagenic activity affects a variety of genetic markers.
All of the findings point to the hamster S9 fraction's greater capacity than the rat S9 system to metabolically activate NDMA, CPNP, and NDEA into mutagenic entities. The gap is likely due to species-specific differences, notably in cytochrome P450 isoforms, which result in higher mutagenesis reactions in TA98, TA100, TA1535, TA1537, and E. Coli. All these data are summarised in Figure 3 and Table 4.
3.3.4. Comparative Mutagenic Potency
In the present comparative assessment, the mutagenic responses of NDMA vs. CPNP, CPNP vs NDEA, and NDMA vs. NDEA were evaluated across multiple tester strains by using the fold increase in mean value.
NDMA vs. CPNP
In TA98, no statistically significant variation was observed between the mutagenic impacts caused by NDMA (1.2) and CPNP (1.1) (p =0.5513). This suggests that in this strain, both substances exhibit comparable, low-level frameshift genetic mutations. The mutagenic effect generated by NDMA (3.6) was much greater than that of CPNP (1.4), and the difference was highly significant (p <0.0001). This implies that base-pair substitution mutations in TA100 are significantly more effectively induced by NDMA. When in comparison with NDMA (5.4), CPNP (87.8) had a significantly stronger mutagenic influence; this difference reached substantial statistical significance (p <0.0001) in TA1535. This suggests that this particular base-pair substitution-sensitive strain, CPNP, is more mutagenic than NDMA (Figure 4).
NDMA (1.2) and CPNP (0.9) did not significantly vary in TA1537 (p =0.2180), suggesting that this strain has comparable and modest levels of frameshift mutagenicity. In E. Coli, NDMA (3.2) considerably increased the mutagenic response compared to CPNP (1.9) (p <0.0001), indicating that NDMA is more potent in this strain that is susceptible to base-pair replacements.
With rat S9, NDMA was more potent in TA100 (p <0.0001) and E. Coli (p =0.0010), but CPNP induced greater mutagenicity in TA1535 (p <0.0001).
CPNP vs. NDEA
For TA98, both compounds produced comparable responses, with no statistically significant difference (1.1 vs. 1.2; p =0.5513), indicating similar mutagenic potential in this frame-shift strain. On the other hand, for TA100, NDEA showed much more mutation rate than CPNP (3.8 vs. 1.4), a highly significant disparity (p <0.0001), indicating that NDEA had more base-pair substitution mutations. In TA1535, the pattern was inverted, with CPNP causing considerably higher mutagenicity than NDEA (87.8 vs. 5.5; p <0.0001). This suggests that CPNP, which is sensitive to particular base-pair substitution events, has a significant impact on this strain, as mentioned in Figure 4.
Figure 3. Effect of S9 fraction (between Hamster and Rat) on NDMA, CPNP, and NDEA in various bacterial strains: Revertant colony induction by NDMA, NDEA, and CPNP in TA98, TA100, TA1535, TA1537, and E. Coli between hamster and rat S9 metabolic activation. Data represent mean ± SD (n = 3) for control and NA compounds at the indicated doses. NDMA (2000 µg/plate) and NDEA (1000 µg/plate) produced robust, S9-dependent mutagenicity in TA100, TA1535, and E. coli, with hamster S9 yielding substantially higher responses than rat S9. CPNP (500 µg/plate) exhibited mutagenicity exclusively in TA1535, again with stronger activation by hamster S9. No notable mutagenic activity was observed in TA98 or TA1537 across test conditions. Statistical differences among treatments or S9 sources are indicated (*p <0.05; **p <0.01; ***p <0.001; ***p <0.0001).
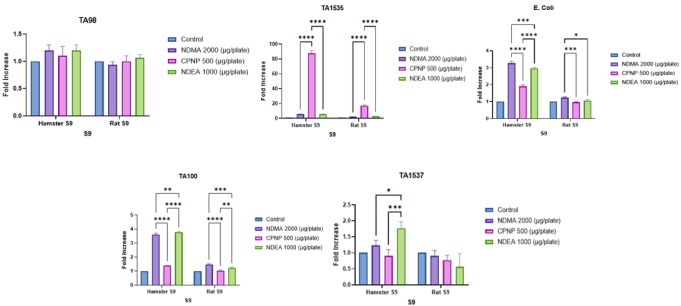
NDEA once again demonstrated notably greater activity than CPNP for TA1537 (1.8 vs. 0.9; p =0.0004), indicating strain-specific variation in the two compounds' mutagenic potential. Lastly, NDEA again showed far greater mutagenic activity than CPNP in the E. Coli tester system (3.0 vs. 1.9; p <0.0001), confirming the compound's increased mutagenicity in specific genetic settings.
With rat S9, CPNP was more potent in TA1535 (p <0.0001), but NDEA induced greater mutagenicity in TA100 (p =0.0017). However, TA98, TA1537 and E. Coli did not show any difference.
NDMA vs. NDEA
The majority of tester strains responded similarly to the comparative mutagenicity patterns of NDMA and NDEA, with just slight but statistically significant variations in a selection of the tests. NDMA and NDEA exhibited very equivalent amounts of fold increase in the mean value of TA98 and TA1535, without any significant differences found (p >0.9999 and p =0.9996, respectively), indicating similar efficacy in identifying base-pair substitution and frameshift mutations in both strains. TA100, on the other hand, showed a minor but substantial rise in fold increase in mean value for NDEA (3.8) compared to NDMA (3.6) (p =0.0080), suggesting a slightly higher mutagenic response in this strain. In a similar vein, TA1537 demonstrated a modest but noticeable boost in mutagenicity for NDEA (1.8) (p =0.0234), suggesting that some frameshift events were more strongly induced in comparison to NDMA (1.2).
NDMA (3.2) had somewhat greater activity than NDEA (3.0) in the E. Coli strain, which showed a minor but substantive difference between the compounds (p = 0.0003). Overall, our findings imply that while NDMA and NDEA have mutagenic potencies that are generally similar, NDEA may cause more severe responses in certain bacterial strains that are susceptible to particular mutation types. With rat S9, only NDMA was more potent in TA100 (p =0.0004), while TA98, TA1535, TA1537 and E. Coli did not show any difference.
Hamster S9 routinely outperformed rat S9 in activating NDMA, CPNP, and NDEA throughout a variety of bacterial strains. CPNP demonstrated the largest fold rise among all, as seen by the multiple comparisons. Furthermore, NDMA exhibited a significantly higher mutagenic efficacy in E. Coli, whereas CPNP in TA1535 and NDEA in TA100 and TA1537, particularly with hamster S9, demonstrated its strong activation and mutagenic behaviour.
A comparison of strain, metabolic activation system (hamster and rat) and compounds (NDMA, CPNP and NDEA) that cause mutagenicity is summarised in Figure 4.
Figure 4. Comparative Mutagenicity of NDMA, CPNP, and NDEA Across Enhanced Ames Strains within Hamster and Rat S9 Fractions: Mutagenicity profiles of NDMA, CPNP, and NDEA in the Enhanced Ames test using high-dose treatments within hamster and rat S9 fractions. Data are presented as fold-increase in revertant colonies relative to control for strains TA98, TA100, TA1535, TA1537, and E. Coli. Enhanced mutagenic activity was observed primarily in TA100, TA1535, and E. Coli, particularly after metabolic activation by hamster S9. CPNP induced the strongest response in TA1535, whereas NDMA generated robust activity across strains sensitive to base-pair substitutions. Values represent mean ± SEM; significance levels are shown (*p <0.05; **p <0.01; ***p <0.001; ****p <0.0001).
3.3.5. Dose-Dependent Effects
The three NA compounds are interpreted here, with an emphasis on whether or not each response exhibits dose-dependent mutagenicity.
Hamster S9
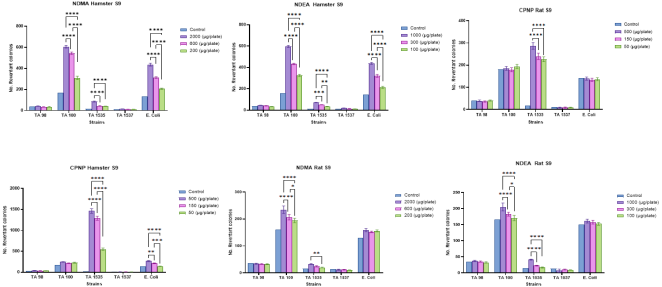
In NDMA, TA100 exhibited a dose-dependent rise in revertant colonies, with the highest dose (2000 µg/plate) giving the largest response and the lowest (200 µg/plate) producing a modest but enhanced response compared to the control. With very little increase at higher dosages, TA98 and TA1537 appeared to have little to mild dose-dependent effects. Higher dosages of TA1535 decreased revertants in comparison to lower doses, indicating a non-monotonic or non-dose-dependent pattern. The E. Coli strain clearly stratified by concentration and showed a robust dose-dependent response, illustrated in Figure 5 and Tables 2 to 4. In conclusion, NDMA demonstrates strain-specific dose dependency, strongly present in TA100 and E. Coli, weak or absent in TA98/TA1537, and theoretically inverted in TA1535.
In CPNP, TA1535 showed a strong dose-dependent rise that was easily discernible across dosages and dramatically increased with increasing concentration. E. Coli demonstrated dose dependence, exhibiting a stepwise pattern at all levels greater than the control. TA100 had a mild to moderate dose-dependent trend, with increases that were apparent but did not differ significantly between doses. With values remaining near control, TA98 and TA1537 seemed to have no discernible dose-dependent impact. In conclusion, CPNP displays selective dose-dependent mutagenicity, most evident in TA1535 and E. coli, but not in TA98 or TA1537. In NDEA, TA100 exhibited a robust and steady dose-dependent pattern, growing gradually as the dosage increased. Although the pattern is not as sharp as that of TA100, TA1535 demonstrated a modest dose-dependent rise. TA98 and TA1537 maintained near-baseline levels with little to no dose-dependent impact. E. Coli showed a distinct dose-dependent response, with more mutagenicity occurring at higher doses. NDEA exhibits pronounced dose dependency in TA100 and E. Coli, moderate dependency in TA1535, and minimal dependency in TA98/TA1537.
Rat S9
In NDMA, the number of revertant colonies in TA100 increased as concentrations climbed, indicating a definite dose-dependent response. TA98 and TA1537 revealed very little variation across dosages; the pattern didn't seem to be dose-dependent. TA1535 exhibited a poor or uneven dose-response, with an increase at mid-dose but no steady trend (Figure 5 and Tables 2 to 4). E. Coli Small, non-dose-dependent changes did not exhibit a monotonic trend. In conclusion, only TA100 shows a theoretically strong dose-dependent increase. In CPNP, as concentrations increased, TA1535 showed a noticeable increase in revertant colonies, indicating a potent dose-dependent impact. TA98 and TA1537 showed non-dose-dependent behaviour after just minor fluctuations with no discernible pattern. TA100 values were not dose-dependent, but they were comparatively constant throughout concentrations. Minor exhibited non-dose-dependent changes in E. Coli with no monotonic trend. Overall, TA1535 exhibits a theoretically dose-dependent effect; other strains do not. A dose-dependent behaviour was supported by TA100's gradual rise in revertants with higher dosages. TA1535 shows a broad dose-related pattern while having elevated counts at higher dosages that are not quite linear. TA98 and TA1537 showed non-dose-dependent changes after small modifications without dosage escalation. E. Coli was not dose-dependent and is comparatively stable at different dosages. In summary, TA100 and (to a lesser degree) TA1535 show theoretical dose-responsiveness.
Figure 5. Dose-Responsive Mutagenic Profiles of Three Nitrosamines in Enhanced Ames Bacterial Strains: Dose-dependent mutagenicity of NDMA, CPNP, and NDEA across strains in the presence of hamster and rat S9. Increasing compound concentrations produced corresponding increases in the number of revertant colonies in TA100, TA1535, and E. coli, demonstrating clear dose-response behavior. Hamster S9 generated stronger dose-related responses than rat S9 across all active strains. Only minimal dose effects were observed in TA98 and TA1537. Bars represent mean ± SEM, and statistically significant increases relative to control are indicated (*p < 0.05; **p < 0.01; ***p < 0.001; ****p < 0.0001).
3.3.6. Positive Control Effects
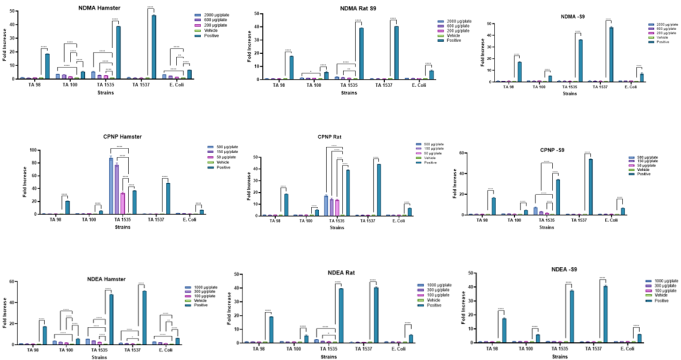
Across all tester strains (TA98, TA100, TA1535, TA1537, and E. coli) and metabolic conditions, the positive control consistently produced the highest revertant responses, showing **highly significant increases (**p <0.0001) when compared with both vehicle control and all NDMA concentrations, thereby confirming assay validity.
NDMA
NDMA tested at 2000, 600, and 200 µg/plate induced responses that were significantly lower than the positive control at all concentrations and in all strains (****p <0.0001), shown in Figure 6 and Table 2. In the presence of metabolic activation (hamster and rat S9), NDMA showed concentration-related increases primarily in base-pair substitution strains TA100 and TA1535, with the 2000 µg/plate concentration reaching statistical significance versus vehicle control (ranging from *p <0.05 to ****p <0.0001, strain- and S9-dependent). The 600 µg/plate dose produced reduced or marginal significance, while the 200 µg/plate dose was generally comparable to vehicle control. In the absence of metabolic activation (−S9), none of the NDMA concentrations (2000, 600, or 200 µg/plate) produced statistically significant increases over vehicle control in any strain, whereas the positive control remained highly significant (****p <0.0001).
CPNP
For CPNP, statistically significant, concentration-dependent effects were observed primarily in TA1535. In the presence of hamster S9, CPNP at 500, 150, and 50 µg/plate induced highly significant increases (****p <0.0001 vs. vehicle), with the 500 µg/plate concentration producing the greatest response (Figure 6 and Table 3). All CPNP concentrations, however, remained significantly lower than the positive control (****p <0.0001). Under rat S9 conditions, CPNP again produced significant increases in TA1535 at 500, 150, and 50 µg/plate (****p <0.0001 vs. vehicle), with a reduced magnitude relative to hamster S9 and consistent statistical inferiority to the positive control (****p <0.0001).
In the absence of metabolic activation (−S9), CPNP at 500, 150, and 50 µg/plate continued to show statistically significant increases in TA1535 (****p <0.0001 vs. vehicle), while all concentrations remained significantly lower than the positive control (****p <0.0001). No other strain showed statistically meaningful concentration-related effects.
NDEA
NDEA tested at 1000, 300, and 100 µg/plate induced concentration-dependent responses that were consistently lower than the positive control (****p <0.0001), illustrated in Figure 6 and Table 4. In hamster S9, statistically significant increases versus vehicle control were observed in TA100 and TA1535, with the 1000 µg/plate dose producing the strongest response (****p <0.0001), 300 µg/plate showing moderate significance, and 100 µg/plate showing weaker but still significant effects. Other strains (TA98, TA1537, and E. coli) exhibited minimal or nonsignificant responses at all concentrations. Under rat S9, NDEA showed weaker but statistically significant effects in TA1535 at 1000 µg/plate (*p < 0.05 to ****p <0.0001), while 300 and 100 µg/plate generally remained comparable to vehicle control.
In the absence of metabolic activation, NDEA at all concentrations failed to induce statistically significant increases over vehicle control in any strain, whereas the positive control remained highly significant (****p <0.0001).
Figure 6. Influence of Metabolic Activation on the Mutagenic Potential of NDMA, CPNP, and NDEA Across Bacterial Tester Strains in Comparison with positive control: Mutagenic responses of NDMA, CPNP, and NDEA evaluated in the bacterial reverse mutation (Ames) assay using S. typhi strains TA98, TA100, TA1535, TA1537, and E. coli in the presence of hamster S9, rat S9, and in the absence of metabolic activation (-S9). Test compounds were evaluated at multiple concentrations, alongside vehicle and positive controls. Results are expressed as fold increase in revertant colonies relative to vehicle control. Data represent mean ± SEM. Statistical significance between groups was determined using multiple comparison tests; p < 0.05, p < 0.01, ****p < 0.0001.

4. Discussion
The results described below are for the definitive study conclusions after the preliminary results.
4.1. Strain Sensitivity
Utilising hamster and rat S9 for metabolic activation, the mutagenic potential of NDMA, CPNP, and NDEA was evaluated among bacterial strains. The mutagenicity of NDMA (2000 µg/plate) with hamster S9, TA1535, was much higher than that of TA100 and E. Coli, which were statistically comparable . The disparity between TA98 and TA1537 was not very noticeable in either hamster S9 or rat S9, but TA1535 again beat TA100 and greatly exceeded TA100 with rat S9. These data aligned with previous investigations using BMD-derived sensitivity ratings; the mix of hamster S9 in TA1535 shows the highest sensitivity for NDMA. This is followed by dose-response data gathered under various experimental circumstances .
For CPNP (500 µg/plate) with hamster S9, TA1535 had the greatest mutagenicity. Identical results were reported for CPNP with rat S9, where TA1535 continued to be the most mutagenic. However, in hamster S9 and rat S9, there were no statistically significant variations between TA98, TA100, TA1537, and E. Coli. Our results are consistent with earlier studies, indicating TA1535's significantly higher sensitivity in comparison to other strains corresponds with the most common mutation types caused by CPNP, which explains the strain-dependent difference in fold increases .
For NDEA, in the presence of hamster S9, TA1535 exhibited significantly higher mutagenicity than TA100, and E. Coli showed a slightly lower response than TA100, but slightly greater mutagenicity than TA1537. Taken together, these findings reveal that hamster S9 exhibits the most prominent spike of mutagenicity, while TA1535 continuously exhibits elevated mutagenic sensitivity. In both hamster S9 and rat S9, TA98 was not significant. NDEA was demonstrated to be mutagenic in TA1535 with hamster S9 but not with rat S9, and another experiment confirms that hamster S9 was shown to substantially activate various NAs, whereas rat S9 occasionally failed .
The five bacterial strains TA98, TA100, TA1535, TA1537, and E. Coli have different mutagenic behaviours due to their unique DNA repair and mutation recognition patterns, which closely match the kinds of mutations caused by NDMA, CPNP, and NDEA. Alkylating drugs, including NDMA, CPNP, and NDEA, generally cause GC-to-AT transition mutations by generating O6-alkylguanine DNA adducts . Bacterial strains that are specialised for base substitution mutations can effectively identify this sort of mutation, which is a traditional indicator of NA contact. A missense mutation in the hisG gene enables proline to be expressed rather than leucine in TA1535. A GC-to-AC alteration in the DNA is the root of this .
The strain's specificity for identifying the primary mutations brought on by NDMA, CPNP, and NDEA is seen in the significantly larger fold increases and typical mutagenic potency seen in TA1535, particularly during hamster S9 activation. Rat S9's lessened metabolic activation capability is reflected in its significantly lower activity, highlighting the relevance of choosing a suitable S9 source for precise mutagenicity testing. In our latest review article on the EAT for evaluating the mutagenicity of NA, we integrated the data from six important studies and discovered that TA1535 was the most sensitive strain and produced the greatest-fold activation, especially when pre-incubation protocols with 30% v/v hamster S9 were used . Hence, TA1535 was a better strain to employ as the first cultivar because its mutagenic reactions were more consistent and sensitive for direct alkylation processes.
Frameshift mutation seems to be present close to the location of a continuous -C-C-C- region in strain TA1537, which has the hisC3076 mutation and whereby frameshift mutagens that are difficult for the hisD3052 indicator to identify return to the wild-type frequency . The least mutagenic effects observed with NDMA, CPNP, and NDEA are explained by TA98's wider sensitivity. Therefore, in comparison to the induced DNA damage, it has a smaller concentrated mutation detection profile. The E. Coli strain lacks nucleotide excision repair (NER) and harbours the pKM101 plasmid, which promotes error-prone genome healing processes . This strain is particularly vulnerable to massive damage and DNA adducts.
Collectively, these results highlight how important mutation sensitivity is for strain sensitivities. The strain-dependent difference in fold increases is explained by the much higher sensitivity of TA1535 relative to all strains, which is consistent with the major mutation types caused by NDMA, CPNP, and NDEA.
4.2. Impact of S9 Type on NA Mutagenicity
NAs, including NDMA, CPNP, and NDEA, have mutagenic potential that is significantly influenced by the S9 metabolic activation system. All five bacterial strains in this investigation showed noticeably greater mutagenic reactions to all NAs when extracted from hamster S9 as opposed to rat S9.
Remarkably, compared to rat S9, NDEA most significantly doubles the capacity for metabolic activation in hamster S9. In comparison to rat S9, TA1535 shows a nearly 5-fold increase in mutagenicity under hamster S9 (88.7 vs. 17.2 per unit of dosage), suggesting that hamster S9 offers a more effective enzymatic activation for CPNP-induced mutagenesis. When exposed to NDEA with hamster S9 as opposed to rat S9, TA100 and TA1537 likewise show much greater mutagenesis effects. E. Coli exhibits significantly elevated mutagenesis reactions when subjected to NDMA in the presence of hamster S9 and rat S9.
Under hamster S9, NDMA exhibits weak but discernible mutagenicity in TA100; under rat S9, it exhibits reduced activation, which was identified as base-pair substitution mutations. NDMA-induced mutagenicity is more pronounced in TA1535 than in TA100, suggesting that TA1535 is more sensitive to NDMA’s specific mutational signature. NDMA also causes AT-site mutations, but again responds more strongly under hamster S9 in E. Coli. Compared to rat S9, hamster S9 consistently activates NDMA to more mutagenic metabolites (about 2.3-2.7 times greater across TA100, TA1535, and E. Coli). However, due to its high sensitivity to G→A transition mutations, TA1535 is the strain most susceptible to NDMA. Poorer mutagenic indicators are produced by rat S9, which could suggest species differences in CYP450 function, improved detoxification in rat liver enzymes, and less production of methylating metabolites.
Both hamster and rat S9 showed comparable sensitivities to CPNP in TA98 and TA1537. Rat S9 has the least activation ability per unit of mutagen, indicating that hamster S9 is necessary for the most favourable activation of CPNP. This highlights the crucial function the liver source plays in regulating the mutagenic strength of NA. These results are in line with other research showing that the genotoxic effects of NA may be overlooked when using rat S9 unless CYP2E1 is properly activated or alternative bioactivation methods are used . Despite regulatory trends favouring stronger human-relevant systems, hamster S9 is still used in genotoxicity screening techniques due to its increased sensitivity, especially in identifying weakly mutagenic or structure-dependent NA. The necessity for metabolically competent systems that are adapted to the chemical structure and metabolic activation demands of test substances is crucially highlighted by regulatory frameworks like the ICH M7(R2) guideline. The incorporation of more strongly reactive S9 sources, such as hamster S9, is essential for NA, whose mutagenicity frequently largely depends on CYP2E1-mediated activation, to prevent misleading findings and guarantee appropriate risk profiling . In summary, the more active state of the majority of NA-activating CYPs in hamster S9 in comparison to rat S9, as well as higher levels of CYP2E1 and CYP2A6-like enzymes, probably leads to the larger mutagenic reactions shown in NA testing .
5. Conclusion
Our findings support the notion that the choice of bacterial strains and the source of the metabolic activation system are important factors in defining the existence of mutagenic efficacy in EAT. The best reaction to NA mutagenicity was often produced by the hamster S9 in conjunction with the E. Coli, TA100, and TA1535 strains. Dose regularisation enhances risk assessment, comparability, and solubility even more. These findings highlight the need to incorporate optimal testing environments into screening plans in order to guarantee accurate detection of mutagenic NA contaminants. By putting these strategies into practice, safety evaluations will be improved, regulatory choices will be informed, and humanity will finally be protected. In situations where the test chemical is scarce, these findings provide compelling evidence in favour of a simplified method of NA impurity testing. For the first screening, we advise using the TA100, TA1535, and E. Coli strains with 30% v/v hamster S9 and a 30-minute preincubation period. This strategy maintains excellent sensitivity for NA analysis while optimising the utilisation of resources by cutting down on time, expense, and animal S9 production. Additional analysis using a more comprehensive set can be performed when the results of the initial screening are negative or if the QSAR evaluation indicates alarms concerning extra strains. This innovative approach provides an effective way to evaluate NA-driven mutagenicity promptly, enabling quick detection and management of these important contaminants.
Abbreviations

NA

Nitrosamines

NDSRI

Nitrosamine Drug Substance-related Impurities

NDMA

N-nitrosodimethylamine

NDEA

N-nitrosodiethylamine

CPNP

1-Cyclopentyl-4-nitrosopiperazine

DNA

Deoxyribonucleic Acid

EMA

European Medicines Agency

FDA

Food and Drug Administration

PCYT

Preliminary Cytotoxicity Testing

EAT

Enhanced Ames Test

OECD

Organisation for Economic Co-operation and Development

ICH

International Council for Harmonisation

S. Typhi

Salmonella typhimurium

E. Coli

Escherichia coli

Acknowledgments
The authors acknowledge the support of Vipragen Biosciences Private Limited, Hootagalli, Mysore, Karnataka, for providing resources.
Author Contributions
Samit Kadam: Conceptualization, Data curation, Formal Analysis, Investigation, Methodology, Supervision, Validation, Visualization, Writing – original draft, Writing – review & editing
Aditya Dipakrao Hajare: Data curation, Formal Analysis, Validation, Visualization, Writing – original draft, Writing – review & editing
Conflicts of Interest
The authors declare no conflicts of interest.
References
[1] FDA. Information about Nitrosamine Impurities in Medications. [April 2024]; Available from:
[2] Nudelman, R., et al., The nitrosamine “saga”: lessons learned from five years of scrutiny. Organic Process Research & Development, 2023. 27(10): p. 1719-1735.
[3] Gushgari, A. J. and R. U. Halden, Critical review of major sources of human exposure to N-nitrosamines. Chemosphere, 2018. 210: p. 1124-1136.
[4] Thresher, A., et al., Are all nitrosamines concerning? A review of mutagenicity and carcinogenicity data. Regulatory Toxicology and Pharmacology, 2020. 116: p.
[5] FDA. Control of Nitrosamine Impurities in Human Drugs. [September 2024]; Available from:
[6] Lijinsky, W., Carcinogenicity and mutagenicity of N-nitroso compounds. Molecular toxicology, 1987. 1(1): p. 107-119.
[7] Thomas, R., et al., What makes a potent nitrosamine? Statistical validation of expert-derived structure-activity relationships. Chemical research in toxicology, 2022. 35(11): p. 1997-2013.
[8] Rao, T., Structural basis for mutagenic activity of N-nitrosamines in the Salmonella histidine reversion assay, in Genotoxicology of N-nitroso compounds. 1984, Springer. p. 45-58.
[9] Rao, T. K., et al., Mutagenicity of aliphatic nitrosamines in Salmonella typhimurium. Mutation Research/Genetic Toxicology, 1979. 66(1): p. 1-7.
[10] FDA. M7 (R2) Assessment and Control of DNA Reactive (Mutagenic) Impurities in Pharmaceuticals To Limit Potential Carcinogenic Risk. 2023 [cited July 2023]; Available from:
[11] (EMA), E. M. A. European Medicines Agency. Scientific review on the risk of nitrosamine impurities in human medicines. June 2020 [cited June 2020]; Available from:
[12] (FDA), F. a. D. A. Recommended Acceptable Intake Limits for Nitrosamine Drug Substance-Related Impurities. August 2023 [cited 2023]; Available from:
[13] Canada, H. Guidance on nitrosamine impurities in medications. 2025 [cited August 2025]; Available from:
[14] (ANVISA), N. H. S. A. Guide on the Control of Nitrosamines in Active Pharmaceutical Ingredients and Medicines. 2023 [cited JUNE 2023]; Available from:
[15] Ames, B. N., The detection of chemical mutagens with enteric bacteria, in Chemical Mutagens: Principles and Methods for Their Detection Volume 1. 1971, Springer. p. 267-282.
[16] Marnett, L. J., Adventures with Bruce Ames and the Ames test. Mutation Research/Genetic Toxicology and Environmental Mutagenesis, 2019. 846: p.
[17] Guideline, I. H. T. Guidance on genotoxicity testing and data interpretation for pharmaceuticals intended for human use S2 (R1). in International Conference on Harmonisation of Technical Requirements for Registration of Pharmaceuticals for Human Use, Rockville, Maryland, US. 2011.
[18] Guideline, I. Assessment and control of dna reactive (mutagenic) impurities in pharmaceuticals to limit potential carcinogenic risk M7. in International conference on harmonization of technical requirements for registration of pharmaceuticals for human use (ICH): Geneva. 2014.
[19] Thomas, D. N., et al., Ames test study designs for nitrosamine mutagenicity testing: qualitative and quantitative analysis of key assay parameters. Mutagenesis, 2024. 39(2): p. 78-95.
[20] McCann, J., et al., Detection of carcinogens as mutagens in the Salmonella/microsome test: assay of 300 chemicals. Proceedings of the National Academy of Sciences, 1975. 72(12): p. 5135-5139.
[21] Zeiger, E., Identification of rodent carcinogens and noncarcinogens using genetic toxicity tests: premises, promises, and performance. Regulatory Toxicology and Pharmacology, 1998. 28(2): p. 85-95.
[22] (FDA), F. a. D. A. CDER Nitrosamine Impurity Acceptable Intake Limits. 2025 [cited August 2025]; Available from:
[23] (EMA), E. M. A. Appendix 3 to Questions and answers for marketing authorisation holders/applicants on the CHMP Opinion for the Article 5(3) of Regulation (EC) No 726/2004 referral on nitrosamine impurities in human medicinal products. 2024 [cited March 2024]; Available from:
[24] Cross, K. P. and D. M. DeMarini, Analysis of chemical structures and mutations detected by Salmonella TA98 and TA100. Mutation Research/Fundamental and Molecular Mechanisms of Mutagenesis, 2023. 827: p. 111838.
[25] Dieckhoff, J., F. Bringezu, and S. Simon, Metabolic activation of short-chain alkyl N-nitrosamines using Aroclor 1254 or phenobarbital/beta-naphthoflavone-induced rat or hamster S9-A comparative analysis. Toxicology Reports, 2024. 12: p. 215-223.
[26] Bringezu, F. and S. Simon, Salmonella typhimurium TA100 and TA1535 and E. coli WP2 uvrA are highly sensitive to detect the mutagenicity of short Alkyl-N-Nitrosamines in the Bacterial Reverse Mutation Test. Toxicology Reports, 2022. 9: p. 250-255.
[27] Tennant, R. E., D. J. Ponting, and A. Thresher, A deep dive into historical Ames study data for N-nitrosamine compounds. Regulatory Toxicology and Pharmacology, 2023. 143: p.
[28] Lijinsky, W. and A. Andrews, The superiority of hamster liver microsomal fraction for activating nitrosamines to mutagens in Salmonella typhimurium. Mutation Research/Fundamental and Molecular Mechanisms of Mutagenesis, 1983. 111(2): p. 135-144.
[29] Bartsch, H. and R. Montesano, Relevance of nitrosamines to human cancer. Carcinogenesis, 1984. 5(11): p.
[30] Aishwarya, D., et al., Nitrosamine Drug Substance-Related Impurities (NDSRIs) in Pharmaceuticals: Formation, Mitigation Strategies, and Emphasis on Mutagenicity Risks. Pharmaceutical Research, 2025: p. 1-32.
[31] Haworth, S., Bacterial Reverse and Forward Mutation Assays, in Carcinogenesis and Mutagenesis Testing. 1984, Springer. p. 185-197.
[32] Kadam, S. B., et al., Mutagenicity of nitrosamines in enhanced Ames tests: a review of strain, metabolism, and solvent effects. Mutation Research-Genetic Toxicology and Environmental Mutagenesis, 2025.
[33] Mortelmans, K. and E. Zeiger, The Ames Salmonella/microsome mutagenicity assay. Mutation research/fundamental and molecular mechanisms of mutagenesis, 2000. 455(1-2): p. 29-60.
[34] Wozniak, K. J. and L. A. Simmons, Bacterial DNA excision repair pathways. Nature Reviews Microbiology, 2022. 20(8): p. 465-477.
[35] Evans, K., et al., A comparative analysis of select P450 enzymes in uninduced and PB/BNF-induced hamster and rat liver S9. Mutation Research-Genetic Toxicology and Environmental Mutagenesis, 2025. 902.
Cite This Article
  • APA Style

    Kadam, S., Hajare, A. D. (2026). Evaluation of Mutagenic Potential of Nitrosamines Using the Enhanced Ames Test with Hamster Liver S9 Activation. Biochemistry and Molecular Biology, 11(3), 42-58. https://doi.org/10.11648/j.bmb.20261103.11

    Copy | Download

    ACS Style

    Kadam, S.; Hajare, A. D. Evaluation of Mutagenic Potential of Nitrosamines Using the Enhanced Ames Test with Hamster Liver S9 Activation. Biochem. Mol. Biol. 2026, 11(3), 42-58. doi: 10.11648/j.bmb.20261103.11

    Copy | Download

    AMA Style

    Kadam S, Hajare AD. Evaluation of Mutagenic Potential of Nitrosamines Using the Enhanced Ames Test with Hamster Liver S9 Activation. Biochem Mol Biol. 2026;11(3):42-58. doi: 10.11648/j.bmb.20261103.11

    Copy | Download

  • @article{10.11648/j.bmb.20261103.11,
      author = {Samit Kadam and Aditya Dipakrao Hajare},
      title = {Evaluation of Mutagenic Potential of Nitrosamines Using the Enhanced Ames Test with Hamster Liver S9 Activation},
      journal = {Biochemistry and Molecular Biology},
      volume = {11},
      number = {3},
      pages = {42-58},
      doi = {10.11648/j.bmb.20261103.11},
      url = {https://doi.org/10.11648/j.bmb.20261103.11},
      eprint = {https://article.sciencepublishinggroup.com/pdf/10.11648.j.bmb.20261103.11},
      abstract = {Nitrosamines (NAs) and Nitrosamine Drug Substance-Related Impurities (NDSRIs) have recently drawn significant attention because of their strong links to cancer and genetic damage. The standard Ames test, described in Organisation for Economic Co-operation and Development (OECD) Guideline 471, is widely used to assess mutagenicity, but it often struggles with certain nitrosamines, especially those requiring complex metabolic activation or producing weak signals at low doses. To address these limitations, regulators now recommend the Enhanced Ames Test (EAT) for improved sensitivity. In this study, we assessed three nitrosamines, N-nitrosodimethylamine (NDMA), 1?cyclopentyl?4?nitrosopiperazine (CPNP), and N-nitrosodiethylamine (NDEA), using the EAT. We began with cytotoxicity evaluations in Salmonella typhimurium (S. typhi.) strains TA100 and TA1535 to determine the highest non-toxic doses. Each compound was then preincubated with 30% liver S9 enzymes from rats and hamsters for 30 minutes to better replicate metabolic activation. Hamster S9 produced stronger mutagenic responses than rat S9. Among the tested strains, TA1535 showed the highest sensitivity. NDMA produced 2.3-2.7?fold higher mutagenicity in TA1535 compared with other strains. CPNP showed an even stronger effect, with a five?fold increase. NDEA was the most potent, generating nearly a five?fold stronger response with hamster S9 than with rat S9 (88.7?fold vs. 17.2?fold per dose). Overall, these findings highlight that the EAT, combined with optimized metabolic activation, is a robust approach for detecting mutagenic nitrosamines that may otherwise remain undetected.},
     year = {2026}
    }
    

    Copy | Download

  • TY  - JOUR
    T1  - Evaluation of Mutagenic Potential of Nitrosamines Using the Enhanced Ames Test with Hamster Liver S9 Activation
    AU  - Samit Kadam
    AU  - Aditya Dipakrao Hajare
    Y1  - 2026/08/20
    PY  - 2026
    N1  - https://doi.org/10.11648/j.bmb.20261103.11
    DO  - 10.11648/j.bmb.20261103.11
    T2  - Biochemistry and Molecular Biology
    JF  - Biochemistry and Molecular Biology
    JO  - Biochemistry and Molecular Biology
    SP  - 42
    EP  - 58
    PB  - Science Publishing Group
    SN  - 2575-5048
    UR  - https://doi.org/10.11648/j.bmb.20261103.11
    AB  - Nitrosamines (NAs) and Nitrosamine Drug Substance-Related Impurities (NDSRIs) have recently drawn significant attention because of their strong links to cancer and genetic damage. The standard Ames test, described in Organisation for Economic Co-operation and Development (OECD) Guideline 471, is widely used to assess mutagenicity, but it often struggles with certain nitrosamines, especially those requiring complex metabolic activation or producing weak signals at low doses. To address these limitations, regulators now recommend the Enhanced Ames Test (EAT) for improved sensitivity. In this study, we assessed three nitrosamines, N-nitrosodimethylamine (NDMA), 1?cyclopentyl?4?nitrosopiperazine (CPNP), and N-nitrosodiethylamine (NDEA), using the EAT. We began with cytotoxicity evaluations in Salmonella typhimurium (S. typhi.) strains TA100 and TA1535 to determine the highest non-toxic doses. Each compound was then preincubated with 30% liver S9 enzymes from rats and hamsters for 30 minutes to better replicate metabolic activation. Hamster S9 produced stronger mutagenic responses than rat S9. Among the tested strains, TA1535 showed the highest sensitivity. NDMA produced 2.3-2.7?fold higher mutagenicity in TA1535 compared with other strains. CPNP showed an even stronger effect, with a five?fold increase. NDEA was the most potent, generating nearly a five?fold stronger response with hamster S9 than with rat S9 (88.7?fold vs. 17.2?fold per dose). Overall, these findings highlight that the EAT, combined with optimized metabolic activation, is a robust approach for detecting mutagenic nitrosamines that may otherwise remain undetected.
    VL  - 11
    IS  - 3
    ER  - 

    Copy | Download

Author Information
  • Abstract
  • Keywords
  • Document Sections

    1. 1. Introduction
    2. 2. Materials and Methods
    3. 3. Results
    4. 4. Discussion
    5. 5. Conclusion
    Show Full Outline
  • Abbreviations
  • Acknowledgments
  • Author Contributions
  • Conflicts of Interest
  • References
  • Cite This Article
  • Author Information