Abstract
Background: Malaria remains an important cause of morbidity and mortality among children younger than five years in Kenya. Although machine-learning models can capture complex relationships in population-based data, bias–variance trade-offs and limited geographical transportability may constrain their performance. This study developed and evaluated a bagging-initialised residual gradient-boosting (BIRGB) framework to predict microscopy-confirmed malaria infection in children under five years in Kenya. Methods: Data were obtained from 3,749 children with microscopy results in the 2020 Kenya Malaria Indicator Survey. The proposed BIRGB framework used leakage-safe, out-of-fold random-forest probabilities, transformed into log-odds, to initialise XGBoost, which fitted regularised additive trees to correct residual prediction errors. Performance was compared with standalone random forest and XGBoost models using held-out test data and leave-one-county-out geographical validation. Sequential forward floating selection identified the optimal predictor subset, and SHapley Additive exPlanations quantified the magnitude and direction of predictor contributions to malaria predictions. Results: BIRGB achieved the best mean internal-test F1 score (88.4%), followed by random forest (68.5%) and XGBoost (56.8%). This advantage was also observed in the leave-one-county-out validation, where BIRGB had a mean F1 score of 90.5% compared to 68.3% for random forest and 55.5% for XGBoost. SHAP analysis identified altitude, household-member age, haemoglobin level, household wealth, mobile-phone ownership, household size, number of children ever born, and number of daughters living elsewhere as influential predictors. Higher altitude, haemoglobin, and wealth generally shifted predictions toward malaria negativity, whereas higher age and household size generally shifted predictions toward malaria positivity. Conclusions: Sequentially initialising XGBoost with random-forest probability estimates improved malaria classification in both internal testing and geographical validation.
|
Published in
|
Biomedical Statistics and Informatics (Volume 11, Issue 4)
|
|
DOI
|
10.11648/j.bsi.20261104.12
|
|
Page(s)
|
99-112 |
|
Creative Commons
|

This is an Open Access article, distributed under the terms of the Creative Commons Attribution 4.0 International License (http://creativecommons.org/licenses/by/4.0/), which permits unrestricted use, distribution and reproduction in any medium or format, provided the original work is properly cited.
|
|
Copyright
|
Copyright © The Author(s), 2026. Published by Science Publishing Group
|
Keywords
Malaria, Children Under Five, Machine Learning, Hybrid Ensemble Learning, Random Forest, XGBoost,
Geographical Validation, SHAP, Kenya
1. Introduction
Malaria remains a major global health challenge despite being preventable and treatable. In 2024, an estimated 282 million cases and 610,000 deaths occurred globally, representing increases of approximately 9 million cases and 12,000 deaths compared with 2023. The WHO African Region accounted for approximately 95% of both cases and deaths, while children younger than five years comprised about three-quarters of malaria deaths in the
region. Kenya continues to experience a substantial and unevenly distributed burden. In 2024, WHO estimated 4.2 million malaria cases and 11,700 deaths in the country, with approximately 82% of the population living in areas classified as having high transmission
.
Considerable investment has been directed towards insecticide-treated nets, indoor residual spraying, preventive chemotherapy, prompt parasitological diagnosis, artemisinin-based combination therapy, surveillance and, more recently, malaria vaccination. These interventions have averted an estimated 2.3 billion cases and 14 million deaths globally since 2000
. The WHO Global Technical Strategy aims to reduce malaria incidence and mortality by at least 90% by 2030 relative to 2015 levels
. Consistent with these targets, the Kenya Malaria Strategy 2023–2027 seeks to reduce malaria incidence by 80% and mortality by 90% by 2027/28 and to interrupt indigenous transmission in four targeted counties
. Kenya has achieved important gains, including a reduction in the severe malaria case-fatality rate from 6.8% in 2018 to 0.7% in 2022
.
Nevertheless, progress remains fragile. Malaria incidence in Kenya increased from 96 to 105 cases per 1,000 population between 2019 and 2023, with an average of 4.9 million outpatient cases reported annually
. Control efforts are constrained by several factors, including insecticide and antimalarial drug resistance, changing vector composition and behaviour, climate variability, inconsistent use of long-lasting insecticidal nets, gaps in preventive treatment, health-worker non-adherence to case-management guidelines, supply-chain weaknesses, inequitable access to health services, and inadequate financing. Kenya’s malaria strategy estimated a financing gap of KES 44.5 billion for 2023–2027
. These challenges are compounded by pronounced geographical heterogeneity: malaria prevalence ranges from less than 1% in low-risk areas to approximately 19% in the lake-endemic region, while county-level incidence ranges from minimal transmission to more than 700 cases per 1,000 population in very high-burden counties
.
Malaria risk reflects interactions among ecological, demographic, socioeconomic, behavioural and health-system factors. Rainfall, temperature, altitude and proximity to mosquito-breeding habitats influence vector survival and parasite development, whereas age, anaemia, household poverty, housing quality, geographical location, malaria-related knowledge and access to preventive interventions are important correlates of childhood infection
| [6] | D. Chilot et al., ‘Pooled prevalence and risk factors of malaria among children aged 6–59 months in 13 sub-Saharan African countries: A multilevel analysis using recent malaria indicator surveys’, PLOS ONE, vol. 18, no. 5, p. e0285265, 2023, https://doi.org/10.1371/journal.pone.0285265 |
| [7] | J. O. Sarfo et al., ‘Malaria amongst children under five in sub-Saharan Africa: a scoping review of prevalence, risk factors and preventive interventions’, Eur J Med Res, vol. 28, no. 1, p. 80, 2023, https://doi.org/10.1186/s40001-023-01046-1 |
| [8] | L. S. Tusting et al., ‘Housing Improvements and Malaria Risk in Sub-Saharan Africa: A Multi-Country Analysis of Survey Data’, PLOS Medicine, vol. 14, no. 2, p. e1002234, 2017, https://doi.org/10.1371/journal.pmed.1002234 |
[6-8]
. The associations between these factors and malaria are unlikely to be uniform across counties because vector ecology, intervention coverage, healthcare accessibility and transmission intensity vary geographically. Consequently, national estimates may obscure important subnational differences in both malaria burden and the factors associated with infection.
Conventional modelling approaches, including logistic regression, generalised linear and additive models, Bayesian geostatistical models and spatiotemporal regression, have contributed substantially to identifying malaria-associated factors, estimating prevalence and mapping transmission risk. These methods offer transparent parameter estimates and have supported national stratification and intervention planning
| [9] | J. N. Odhiambo, C. Kalinda, P. M. Macharia, R. W. Snow, and B. Sartorius, ‘Spatial and spatio-temporal methods for mapping malaria risk: a systematic review’, BMJ Glob Health, vol. 5, no. 10, p. e002919, 2020,
https://doi.org/10.1136/bmjgh-2020-002919 |
[9]
. However, complex predictor relationships may limit their application to high-dimensional population-based survey data. Machine-learning methods offer a complementary approach by learning non-linearities and higher-order interactions with fewer prespecified structural assumptions
. Random forest, support-vector machines, gradient boosting, elastic net, and neural networks have consequently been applied to malaria diagnosis, prevalence estimation, outbreak forecasting, and risk mapping, often achieving strong predictive performance
| [11] | B. J. Brown et al., ‘Data-driven malaria prevalence prediction in large densely populated urban holoendemic sub-Saharan West Africa’, Sci Rep, vol. 10, p. 15918, 2020,
https://doi.org/10.1038/s41598-020-72575-6 |
| [12] | O. Khan, J. O. Ajadi, and M. P. Hossain, ‘Predicting malaria outbreak in The Gambia using machine learning techniques’, PLOS ONE, vol. 19, no. 5, p. e0299386, 2024,
https://doi.org/10.1371/journal.pone.0299386 |
| [13] | I. Z. Sadiq et al., ‘Machine learning models for predicting residual malaria infections using environmental factors: A case study of the Jazan region, Kingdom of Saudi Arabia’, Decoding Infection and Transmission, vol. 2, p. 100022, 2024, https://doi.org/10.1016/j.dcit.2024.100022 |
[11-13]
.
However, the predictive performance of an individual machine-learning algorithm depends on its bias–variance error characteristics and the structure of the data. Bagging methods, such as random forest, reduce variance by averaging decorrelated decision trees fitted to bootstrap samples but may leave systematic residual structure unexplained. Boosting methods, such as XGBoost, sequentially correct preceding prediction errors and can reduce bias, but their flexibility may increase susceptibility to overfitting, particularly in small, high-dimensional or imbalanced datasets. These limitations are especially impacting population-based malaria data, in which infected children often constitute a small minority and predictor distributions may vary substantially between geographical settings.
Hybrid ensemble methods attempt to improve performance by combining complementary learners. Common approaches integrate fitted models through majority voting, probability averaging, weighted voting, or stacking
| [14] | O. Sagi and L. Rokach, ‘Ensemble learning: A survey’, Wiley Interdisciplinary Reviews: Data Mining and Knowledge Discovery, vol. 8, no. 4, p. e1249, 2018,
https://doi.org/10.1002/widm.1249 |
| [15] | T. G. Dietterich, ‘Ensemble Methods in Machine Learning’, in Multiple Classifier Systems, Berlin, Heidelberg: Springer, 2000, pp. 1–15, https://doi.org/10.1007/3-540-45014-9_1 |
| [16] | Z.-H. Zhou, Ensemble Methods: Foundations and Algorithms. New York: Chapman and Hall/CRC, 2012.
https://doi.org/10.1201/b12207 |
| [17] | D. H. Wolpert, ‘Stacked generalization’, Neural Networks, vol. 5, no. 2, pp. 241–259, 1992,
https://doi.org/10.1016/S0893-6080(05)80023-1 |
[14-17]
. Although these approaches can improve prediction, integration generally occurs after the constituent models have been fitted. Voting and averaging therefore do not allow one learner’s predictive structure to influence the optimisation of another, while stacking does not inherently use predictions from a bagging model as initial margins in a boosting algorithm. Evidence remains limited on whether a sequential architecture, whereby boosting begins from and directly refines an observation-specific risk surface learned through bagging, can improve malaria-risk prediction.
These methodological and validation limitations create an important evidence gap. An approach that allows boosting to refine the observation-specific risk structure learned through bagging may improve predictive performance by combining variance reduction with sequential residual correction. However, the additional flexibility could also amplify geographically specific patterns and reduce performance in populations not represented during model development. Evaluating such an architecture using both internal and geographical validation is therefore necessary to determine whether any predictive gains are robust and transferable across Kenya’s heterogeneous malaria-transmission settings.
Therefore, this study aimed to develop a bagging-initialised residual gradient-boosting (BIRGB) model for predicting microscopy-confirmed malaria infection in children younger than five years in Kenya.
2. Methods
2.1. Data
2.1.1. Data Source
This study used secondary data from the 2020 Kenya Malaria Indicator Survey (KMIS), a nationally representative cross-sectional household survey conducted by the Kenya National Bureau of Statistics and the National Malaria Control Programme of the Ministry of Health, with technical support from the Demographic and Health Surveys Program
. The survey collected information on malaria prevalence, prevention and treatment practices, and relevant demographic and socioeconomic characteristics. A two-stage stratified cluster-sampling design was used to obtain nationally and regionally representative estimates. Eligible participants included women aged 15 to 49 years and children younger than five years in selected households; the children underwent malaria testing using rapid diagnostic tests and microscopy
.
2.1.2. Data Processing
In this study, individual datasets were merged with household data and then resampled using individual sample weights to account for non-coverage, non-response, and population-level adjustments, restricting the analysis to participants with non-missing microscopy-confirmed malaria outcomes, resulting in 9,884 observations and 2,557 variables (
Table 5). First, 729 variables with more than 30% missing values were excluded. Non-informative features were subsequently removed, including constant variables (those with only one unique value) and exact duplicate columns. To minimise the influence of low-variability noise, a variance threshold of 0.01 was applied, resulting in the exclusion of 62 variables. Nominal and ordinal variables were encoded using one-hot and ordinal encoding, respectively, according to the coding information provided in the survey documentation
. To address multicollinearity, variables exhibiting high pairwise correlations (absolute correlation coefficient > 0.8) were identified and removed (82), resulting in 222 final variables retained with 9884 observations from all 47 counties.
Multiple imputations with chained equations (MICE)
| [20] | S. van Buuren and K. Groothuis-Oudshoorn, ‘mice: Multivariate Imputation by Chained Equations in R’, Journal of Statistical Software, vol. 45, pp. 1–67, 2011,
https://doi.org/10.18637/jss.v045.i03 |
[20]
were utilised to impute the missing values in each of these categories. Finally, data were harmonised and scaled by standardising to ensure fair penalisation of the scheme applied to all regressors.
A supervised machine learning framework was implemented as a binary classification task, where individuals with malaria positivity constituted the positive class, and those without formed the negative class. Counties with substantial prevalence of malaria were selected from the 47 counties in Kenya and then randomly partitioned into training (80%) and test (20%) subsets, maintaining proportional representation of the outcome classes. A leave-one-county-out cross-validation approach (a separate left-out sample, not used during model training or tuning, was reserved for external validation) was used to assess the models’ capacity to generalise across geographical areas. The procedure was iteratively applied across all counties, whereby data from one county were excluded during model training and reserved exclusively for testing.
2.2. Development of the BIRGB Model
The proposed bagging-initialised residual gradient-boosting model integrated random forest and XGBoost sequentially rather than combining their final predictions through voting or probability averaging.
First, the random forest was fitted to the development data to learn an initial representation of malaria risk. Leakage-safe out-of-fold probabilities were generated using stratified cross-validation. Each development observation therefore received a random-forest probability from a model that had not been trained on that observation.
The out-of-fold probabilities were bounded away from zero and one to avoid undefined values and were transformed into log-odds, which become the corresponding initial prediction margin.
These observation-specific margins were supplied to XGBoost as the starting predictions. XGBoost then fitted a sequence of regularised corrective trees to the residual classification errors, conditional on the risk structure learned by the random forest. Consequently, the boosting component refined the random-forest risk surface instead of beginning from a single constant prediction.
For internal tests or geographically excluded observations, probabilities were first generated using the random-forest model fitted exclusively to the corresponding development data. These probabilities were transformed into log-odds and passed to the fitted XGBoost correction layer. Thus, observations in the validation datasets did not contribute to either component of the hybrid model.
2.2.1. Hyperparameter Optimisation
Hyperparameters for random forest, standalone XGBoost and the XGBoost correction component of BIRGB were optimised using randomised search with five-fold stratified cross-validation. The cross-validated F1 score was used as the optimisation criterion because the outcome was highly imbalanced and the analysis required a balance between identifying malaria-positive children and limiting false-positive classifications.
For BIRGB, random-forest out-of-fold probabilities were regenerated during the development process before optimising the XGBoost correction layer. This preserved the sequential dependency between the two learners while preventing in-sample random-forest predictions from producing overly optimistic initial margins.
The final model configuration was refitted to the complete development dataset using the selected predictors and optimal hyperparameters. Random seeds were fixed for data partitioning, synthetic oversampling, cross-validation, and model fitting to improve computational reproducibility.
2.2.2. Classification-threshold Selection
Predicted probabilities were converted into binary classifications using a data-derived threshold rather than automatically applying a cut-off of 0.50. The threshold was selected from the development data using out-of-fold predictions. Youden’s index was used to identify the classification threshold that maximised the sum of sensitivity and specificity, thereby giving equal weight to the correct classification of both malaria-positive and malaria-negative observations
| [21] | W. J. Youden, ‘Index for rating diagnostic tests’, Cancer, vol. 3, no. 1, pp. 32–35, 1950,
https://doi.org/10.1002/1097-0142(1950)3:1%3C32:aid-cncr2820030106%3E3.0.co;2-3 |
| [22] | R. Fluss, D. Faraggi, and B. Reiser, ‘Estimation of the Youden Index and its associated cutoff point’, Biom J, vol. 47, no. 4, pp. 458–472, 2005, https://doi.org/10.1002/bimj.200410135 |
[21, 22]
.
The selected threshold was fixed before evaluation and then applied unchanged to the corresponding test or LOCO dataset. Validation outcomes were not used to revise the classification threshold. This procedure prevented optimistic performance estimates arising from threshold selection on the evaluation data.
2.2.3. Model Performance Evaluation
The F1 score was specified as the primary performance measure, as it summarises the balance between precision and recall and is more informative than overall accuracy when the outcome is uncommon
| [23] | C. Goutte and E. Gaussier, ‘A Probabilistic Interpretation of Precision, Recall and F-Score, with Implication for Evaluation’, in Advances in Information Retrieval, D. E. Losada and J. M. Fernández-Luna, Eds, Berlin, Heidelberg: Springer, 2005, pp. 345–359, https://doi.org/10.1007/978-3-540-31865-1_25 |
[23]
. Secondary measures included sensitivity, specificity, precision, receiver operating characteristic area under the curve, precision–recall area under the curve and the Brier score. Confusion matrices were also examined to characterise true-positive, false-positive, true-negative and false-negative classifications.
Performance was evaluated separately in the training, internal test and LOCO datasets. County-specific estimates were reported for each model, together with means and standard deviations across counties. Absolute improvement was calculated by subtracting the comparator-model F1 score from the BIRGB F1 score. Positive differences indicated superior BIRGB performance, whereas negative differences indicated poorer performance than the comparator.
Internal test performance quantified discrimination among observations drawn from the same broad data-generating setting as the development sample. In contrast, LOCO performance was interpreted as evidence of geographical transportability.
2.3. Feature Selection and Model Interpretation
Sequential forward floating selection (SFFS) was used to identify an informative and parsimonious predictor subset
. The procedure began with an empty feature set and sequentially added the predictor that produced the largest improvement in the cross-validated F1 score. Following each forward step, conditional backward elimination was permitted: previously selected predictors could be removed when their exclusion improved performance.
This floating mechanism allowed earlier selection decisions to be reconsidered as the composition of the predictor set changed, reducing the dependence of the final subset on a strictly irreversible forward-selection sequence. The final feature set was selected according to cross-validated predictive performance, supported by examination of the feature-selection trajectory and the balance between model performance and complexity.
SHapley Additive exPlanations were also used to examine the contributions of the selected predictors to BIRGB predictions. SHAP decomposes each prediction into a baseline model output and feature-specific contributions.
Global predictor importance was quantified using the mean absolute SHAP value across observations. Predictors with larger mean absolute values were interpreted as having greater influence on model predictions. A SHAP bar plot was used to rank global importance, while a summary plot was used to display the distribution, magnitude, and direction of feature contributions.
Positive SHAP values indicated that a predictor shifted the model output towards a higher predicted probability of malaria, while negative values shifted it towards a lower predicted probability. Because the data were cross-sectional and the model was developed for prediction, SHAP values were interpreted as explanations of the model’s predictions rather than causal effects or epidemiological effect estimates.
3. Results
3.1. Geographical Distribution of Malaria Prevalence
Malaria prevalence varied widely across Kenya’s counties, ranging from 0.00% in several counties to 21.83% in Busia (
Table 1). The overall prevalence of malaria positivity was 2.95%. The ten counties with the highest estimated prevalence were Busia (21.83%), Siaya (15.04%), Migori (13.55%), Bungoma (13.40%), Baringo (11.87%), Kisumu (10.51%), Vihiga (5.97%), Kilifi (5.78%), Kakamega (5.11%) and Turkana (1.51%). We then selected these counties for model development and evaluation.
Table 1. County-specific malaria prevalence in Kenya.
Region | Prevalence (%) | Region | Prevalence (%) | Region | Prevalence (%) |
Overall (national) | 2.95 | Kisii | 0.00 | Nandi | 0.88 |
Baringo | 11.87 | Kisumu | 10.51 | Narok | 0.00 |
Bomet | 0.00 | Kitui | 0.00 | Nyamira | 3.11 |
Bungoma | 13.40 | Kwale | 0.78 | Nyandarua | 0.00 |
Busia | 21.83 | Laikipia | 0.00 | Nyeri | 0.00 |
Elgeyo-Marakwet | 0.00 | Lamu | 0.00 | Samburu | 0.00 |
Embu | 0.00 | Machakos | 0.00 | Siaya | 15.04 |
Garissa | 0.00 | Makueni | 0.00 | Taita-Taveta | 0.00 |
Homa Bay | 1.88 | Mandera | 0.00 | Tana River | 0.00 |
Isiolo | 0.00 | Marsabit | 0.75 | Tharaka-Nithi | 0.00 |
Kajiado | 0.00 | Meru | 0.00 | Trans-Nzoia | 0.00 |
Kakamega | 5.11 | Migori | 13.55 | Turkana | 1.51 |
Kericho | 0.00 | Mombasa | 1.22 | Uasin Gishu | 0.00 |
Kiambu | 0.00 | Murang’a | 0.00 | Vihiga | 5.97 |
Kilifi | 5.78 | Nairobi | 0.00 | Wajir | 0.00 |
Kirinyaga | 0.00 | Nakuru | 0.00 | West Pokot | 0.57 |
3.2. Overall Model Performance
Model performance was similar across the training, internal test, and leave-one-county-out (LOCO) validation datasets (
Table 2;
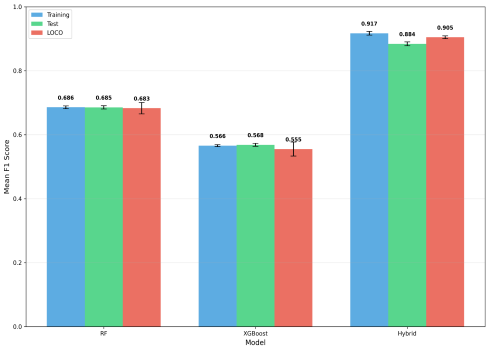
Figure 1). BIRGB achieved the best average F1 score on all three datasets. Its mean F1 score was 0.917 in training, 0.884 in internal testing, and 0.905 in LOCO validation. The equivalent scores were 0.686, 0.685, and 0.683 for random forest and 0.566, 0.568, and 0.555 for XGBoost.
Specifically, BIRGB yielded an absolute improvement of 0.231, 0.199, and 0.222 in F1-score for training, internal testing, and LOCO validation, respectively, compared to random forest. The comparable gains over XGBoost were 0.351, 0.316, and 0.350, respectively. The BIRGB mean F1 score declined by 0.033 from training to internal testing but remained high in geographical validation. Its LOCO performance was 0.021 better than its internal-test performance, with low between-county variability (SD 0.005).
Table 2. Mean F1 scores and absolute BIRGB improvement across training, internal test, and leave-one-county-out validation datasets.
Dataset | RF Mean F1 (SD) | XGB Mean F1 (SD) | BIRGB Mean F1 (SD) | Absolute BIRGB improvement |
| | | | versus RF | versus XGB |
Training | 0.686 (0.005) | 0.566 (0.003) | 0.917 (0.006) | +0.231 | +0.351 |
Internal test | 0.685 (0.005) | 0.568 (0.005) | 0.884 (0.006) | +0.199 | +0.316 |
LOCO | 0.683 (0.019) | 0.555 (0.023) | 0.905 (0.005) | +0.222 | +0.350 |
Figure 1. Mean F1 scores and hybrid-model improvement across training, test, and leave-one-out datasets.
3.3. County-specific Training, Internal Tests and Geographical Validation Performance
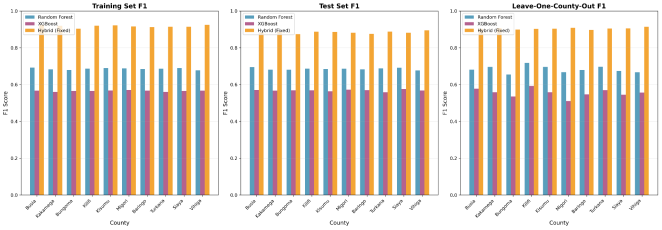
BIRGB performed better than the other two methods with the best F1 score throughout the training, internal-test, and LOCO validation datasets in each county (
Tables 3 and 4;
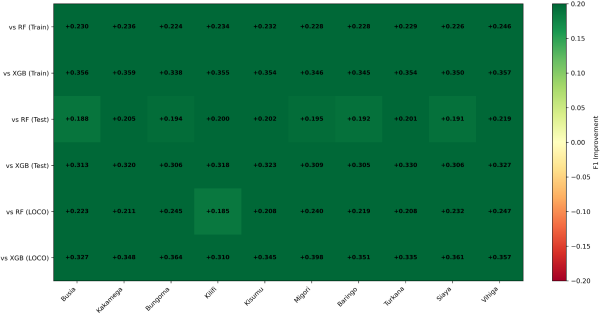
Figures 2 and 3). Training F1 scores ranged from 0.904 in Bungoma to 0.924 in Vihiga, compared to 0.678–0.693 for random forest and 0.560–0.571 for XGBoost. BIRGB resulted in an absolute improvement of 0.224-0.246 compared to random forest and 0.338-0.359 compared to XGBoost.
Internal testing showed BIRGB outperformed alternatives with county-specific F1 scores ranging from 0.875 in Bungoma and Baringo to 0.895 in Vihiga. The respective ranges were 0.677–0.695 for the random forest and 0.559–0.576 for XGBoost. The absolute improvement relative to random forest ranged from 0.188 in Busia to 0.219 in Vihiga, while relative to XGBoost, it ranged from 0.305 in Baringo to 0.330 in Turkana.
The geographical validation also preserved the performance advantage of BIRGB. County-specific LOCO F1 scores were 0.898 in Baringo and 0.914 in Vihiga, compared to 0.654–0.718 for random forest and 0.510–0.593 for XGBoost. BIRGB outperformed random forest by 0.185-0.247 and XGBoost by 0.310-0.398. The biggest improvement of LOCO over random forest was in Vihiga (+0.247), and the largest improvement of LOCO over XGBoost was in Migori (+0.398).
The disparity between the classes was large but rather consistent across the counties, with majority-to-minority ratios ranging from 18.44:1 in Busia to 18.92:1 in Turkana and Vihiga (
Table 4). Optimised classification thresholds ranged from 0.593 in Busia to 0.630 in Bungoma. While thresholds and class distributions varied, BIRGB generally had higher county-specific F1 scores and relatively little geographic variation in performance (
Tables 6 and 7).
Table 3. County-specific F1 scores for random forest, XGBoost and BIRGB across training, internal test and leave-one-county-out validation datasets.
County | Training F1 score | Internal test F1 score | LOCO F1 score |
RF | XGB | BIRGB | RF | XGB | BIRGB | RF | XGB | BIRGB |
Busia | 0.693 | 0.567 | 0.923 | 0.695 | 0.570 | 0.883 | 0.681 | 0.578 | 0.904 |
Kakamega | 0.684 | 0.561 | 0.920 | 0.681 | 0.567 | 0.887 | 0.696 | 0.559 | 0.907 |
Bungoma | 0.679 | 0.566 | 0.904 | 0.680 | 0.569 | 0.875 | 0.654 | 0.535 | 0.899 |
Kilifi | 0.687 | 0.566 | 0.921 | 0.687 | 0.569 | 0.887 | 0.718 | 0.593 | 0.903 |
Kisumu | 0.690 | 0.568 | 0.922 | 0.685 | 0.564 | 0.886 | 0.696 | 0.558 | 0.904 |
Migori | 0.688 | 0.571 | 0.916 | 0.687 | 0.572 | 0.882 | 0.668 | 0.510 | 0.908 |
Baringo | 0.684 | 0.567 | 0.912 | 0.683 | 0.570 | 0.875 | 0.679 | 0.547 | 0.898 |
Turkana | 0.686 | 0.560 | 0.915 | 0.688 | 0.559 | 0.888 | 0.697 | 0.570 | 0.905 |
Siaya | 0.689 | 0.565 | 0.915 | 0.691 | 0.576 | 0.882 | 0.674 | 0.545 | 0.906 |
Vihiga | 0.678 | 0.567 | 0.924 | 0.677 | 0.568 | 0.895 | 0.667 | 0.557 | 0.914 |
Table 4. Classification thresholds, class imbalance, and absolute F1-score differences between BIRGB and the comparator models.
County | Threshold | Imbalance ratio | Training improvement | Internal test improvement | LOCO improvement |
versus RF | versus XGB | versus RF | versus XGB | versus RF | versus XGB |
Busia | 0.593 | 18.44:1 | +0.230 | +0.356 | +0.188 | +0.313 | +0.223 | +0.327 |
Kakamega | 0.622 | 18.87:1 | +0.236 | +0.359 | +0.205 | +0.320 | +0.211 | +0.348 |
Bungoma | 0.630 | 18.64:1 | +0.224 | +0.338 | +0.194 | +0.306 | +0.245 | +0.364 |
Kilifi | 0.627 | 18.85:1 | +0.234 | +0.355 | +0.200 | +0.318 | +0.185 | +0.310 |
Kisumu | 0.603 | 18.77:1 | +0.232 | +0.354 | +0.202 | +0.323 | +0.208 | +0.345 |
Migori | 0.627 | 18.64:1 | +0.228 | +0.346 | +0.195 | +0.309 | +0.240 | +0.398 |
Baringo | 0.601 | 18.87:1 | +0.228 | +0.345 | +0.192 | +0.305 | +0.219 | +0.351 |
Turkana | 0.609 | 18.92:1 | +0.229 | +0.354 | +0.201 | +0.330 | +0.208 | +0.335 |
Siaya | 0.617 | 18.56:1 | +0.226 | +0.350 | +0.191 | +0.306 | +0.232 | +0.361 |
Vihiga | 0.595 | 18.92:1 | +0.246 | +0.357 | +0.219 | +0.327 | +0.247 | +0.357 |
Figure 2. County-specific F1 scores for random forest, XGBoost, and the hybrid model across training, testing, and leave-one-county-out validation.
Figure 3. County-specific absolute differences in F1 score between BIRGB and the standalone models (greener cells indicate greater improvement in BIRGB performance, whereas darker red cells indicate poorer performance relative to the comparator model).
3.4. Variable Selection and Predictive Performance
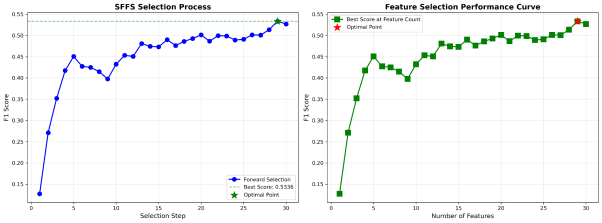
The SFFS identified a final subset of 30 predictors for the BIRGB model (
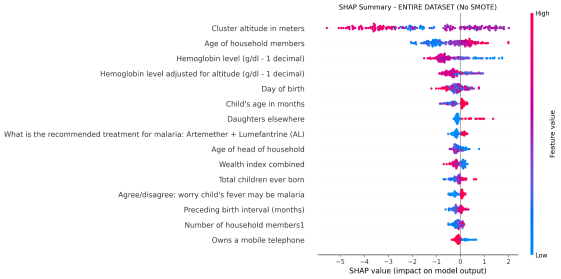
Figure 4). The SHAP summary plot showed variation in the magnitude and direction of predictor contributions (
Figure 5). Positive SHAP values shifted predictions towards malaria positivity, while negative values shifted predictions towards malaria negativity. Red and blue points indicate high and low predictor values, respectively, rather than malaria outcomes.
Altitude had the greatest influence on model output. Higher altitude values shifted predictions towards malaria negativity, while lower values produced more heterogeneous contributions. Higher household member and child ages generally contributed to malaria positivity. In contrast, higher measured and altitude-adjusted haemoglobin levels shifted predictions towards malaria negativity, while lower levels contributed to malaria positivity.
Higher wealth-index values and mobile-phone ownership shifted predictions towards malaria negativity. Larger numbers of daughters living elsewhere, children ever born, and household members generally contributed towards malaria positivity, although their contributions were smaller. Malaria-treatment knowledge, concern that childhood fever could represent malaria, preceding birth interval, and day of birth produced comparatively modest or heterogeneous contributions.
Figure 4. Sequential forward floating selection of important features.
Figure 5. SHAP summary plots for malaria status predictors.
4. Discussion
This study built and validated a bagging-initialised residual gradient-boosting (BIRGB) model to predict microscopy-confirmed malaria infections among children under 5 years of age in Kenya. Two major findings were identified. First, BIRGB consistently outperformed the standalone random forest and XGBoost models on both training and internal testing in all 10 counties. Second, BIRGB demonstrated robustness in leave-one-county-out geographical validation, achieving the highest F1 score in each excluded county and outperforming the comparator models. The average BIRGB F1 score was 0.917 in training, 0.884 in internal testing, and 0.905 in LOCO validation. This contrasted with 0.683 for random forest and 0.555 for XGBoost in LOCO validation. These results indicate that sequentially initialising XGBoost with random-forest-derived risk estimates from a random forest improves both internal prediction performance and geographic transportability.
4.1. Predictive Performance and Geographical Transportability
BIRGB surpassed both individual models by a wide margin. In internal testing, it increased the mean F1 score by 0.199 in comparison to random forest and by 0.316 in comparison to XGBoost. The advantage was observed in every county, confirming the proposed sequential architecture, in which random forest estimates observation-specific malaria risk, followed by XGBoost learning a corrective residual structure. The findings are consistent with evidence that tree-based machine-learning algorithms may identify complicated non-linear correlations among environmental, demographic, socioeconomic, and household factors in population-based malaria data
| [25] | S. M. Mthethwa and S. F. Melesse, ‘A Machine Learning Approach to the Prediction of Malaria in Under-five Children: Analysis of the 2021 Nigerian Malaria Indicator Survey’, https://doi.org/10.2174/0118749445396163250604103305 |
| [26] | J. O. Ashaolu, T. S. Akanji, V. I. Ayansola, O. O. Olawale-Succes, A. J. Sunday, and S. Y. M. Some, ‘From risk factors to predictive modelling: applying machine learning to childhood malaria surveillance in resource-limited settings’, BMC Infect Dis, vol. 25, p. 1693, 2025,
https://doi.org/10.1186/s12879-025-12116-6 |
[25, 26]
.
Importantly, the predictive superiority of BIRGB was maintained across regional validation. The mean LOCO F1 score was 0.905 compared to 0.683 for random forest and 0.555 with XGBoost, with absolute improvements of 0.222 and 0.350, respectively. BIRGB obtained the best LOCO F1 score among all the methods for each omitted county, ranging from 0.898 to 0.914. Its average LOCO performance was likewise 0.021 greater than its internal-test performance, showing no degradation in performance when applied to counties not used in model development.
This high regional heterogeneity of malaria transmission in Kenya is important to consider. Altitude, rainfall, land-surface temperature, proximity to permanent water bodies, night-time light intensity, and use of insecticide-treated nets have been identified in previous studies of the Kenya Malaria Indicator Surveys as geographically varying predictors of children's parasitaemia
| [27] | B. O. Nyawanda et al., ‘The influence of malaria control interventions and climate variability on changes in the geographical distribution of parasite prevalence in Kenya between 2015 and 2020’, Int J Health Geogr, vol. 23, p. 22, 2024,
https://doi.org/10.1186/s12942-024-00381-8 |
| [28] | C. Kioko and J. Blanford, ‘Malaria survey data and geospatial suitability mapping for understanding spatial and temporal variations of risk across Kenya’, Parasite Epidemiol Control, vol. 28, p. e00399, 2024,
https://doi.org/10.1016/j.parepi.2024.e00399 |
[27, 28]
. Similarly, research on surveillance has revealed disparities in the link between rainfall and temperature and malaria incidence in western and coastal Kenya
| [29] | A. Tariq et al., ‘Modelling the effects of precipitation and temperature on malaria incidence in coastal and western Kenya’, Malar J, vol. 24, no. 1, p. 208, 2025,
https://doi.org/10.1186/s12936-025-05428-0 |
[29]
. Such differences may lead to variances in the prevalence of outcomes, predictor distributions, and predictor–outcome connections and so reduce the effectiveness of models shared between counties. The present results indicate that the sequential BIRGB architecture captured predictive structure that was consistent throughout the geographic locations examined.
LOCO validation provides a more conservative measure of geographic transportability than a random train-test split because each model is validated in a county that contributed no observations to model construction. The results represent promising evidence of geographical robustness. Further assessment using later malaria indicator surveys and independent routine surveillance data that maintain the natural occurrence of malaria and evaluate discrimination, calibration, public health value, and performance in clinically and geographically relevant subgroups, comparable with current prediction-model validation
| [30] | H. Yuan, ‘Toward real‐world deployment of machine learning for health care: External validation, continual monitoring, and randomized clinical trials’, Health Care Science, vol. 3, no. 5, pp. 360–364, 2024, https://doi.org/10.1002/hcs2.114 |
| [31] | G. S. Collins et al., ‘TRIPOD+AI statement: updated guidance for reporting clinical prediction models that use regression or machine learning methods’, BMJ, vol. 385, p. e078378, 2024, https://doi.org/10.1136/bmj-2023-078378 |
| [32] | ‘PROBAST+AI’, Latitudes Network. Accessed: Oct. 10, 2026. [Online]. Available:
https://www.latitudes-network.org/tool/probastai/ |
[30-32]
.
4.2. Predictor Contributions
SFFS identified 30 predictors for the final BIRGB model, with SHAP analysis demonstrating substantial heterogeneity in their contribution to malaria classification. Altitude was the most influential predictor, with higher elevations generally shifting predictions towards malaria negativity. This finding is consistent with recent Kenyan evidence identifying altitude, rainfall, temperature, and proximity to water bodies as important spatial determinants of malaria transmission
| [27] | B. O. Nyawanda et al., ‘The influence of malaria control interventions and climate variability on changes in the geographical distribution of parasite prevalence in Kenya between 2015 and 2020’, Int J Health Geogr, vol. 23, p. 22, 2024,
https://doi.org/10.1186/s12942-024-00381-8 |
| [28] | C. Kioko and J. Blanford, ‘Malaria survey data and geospatial suitability mapping for understanding spatial and temporal variations of risk across Kenya’, Parasite Epidemiol Control, vol. 28, p. e00399, 2024,
https://doi.org/10.1016/j.parepi.2024.e00399 |
| [29] | A. Tariq et al., ‘Modelling the effects of precipitation and temperature on malaria incidence in coastal and western Kenya’, Malar J, vol. 24, no. 1, p. 208, 2025,
https://doi.org/10.1186/s12936-025-05428-0 |
[27-29]
. Higher elevations typically have lower temperatures, which may constrain mosquito survival and parasite development.
Higher measured and altitude-adjusted haemoglobin levels, as well as higher household member and child ages, generally shifted predictions towards malaria positivity. Age-related increases in childhood malaria risk have also been reported in recent analyses of malaria indicator surveys
| [26] | J. O. Ashaolu, T. S. Akanji, V. I. Ayansola, O. O. Olawale-Succes, A. J. Sunday, and S. Y. M. Some, ‘From risk factors to predictive modelling: applying machine learning to childhood malaria surveillance in resource-limited settings’, BMC Infect Dis, vol. 25, p. 1693, 2025,
https://doi.org/10.1186/s12879-025-12116-6 |
| [33] | T. Mhelembe, S. Ramroop, and F. Habyarimana, ‘Determining the risk factors of malaria and anemia in children between 6 and 59 months using the joint generalized linear mixed model on the 2021 Nigeria Malaria Indicator Survey dataset’, Front Public Health, vol. 12, p. 1503884, 2025,
https://doi.org/10.3389/fpubh.2024.1503884 |
[26, 33]
. This pattern may reflect increased mobility and exposure to mosquito bites as children grow older, although the association varies with transmission intensity and the acquisition of immunity. The household-member age variable may additionally capture household composition and should therefore not be interpreted solely as the biological effect of the child’s age.
Higher measured and altitude-adjusted haemoglobin levels shifted predictions towards malaria negativity, while lower values contributed to malaria positivity. This agrees with a recent systematic review reporting significantly lower haemoglobin concentrations among children with malaria
| [34] | U. F. Zuberi, S. Aqeel, F. Hashmi, and W. Khan, ‘Altered haematological parameters in children with malaria infection, a systematic review and meta-analysis’, Diagn Microbiol Infect Dis, vol. 108, no. 4, p. 116190, 2024,
https://doi.org/10.1016/j.diagmicrobio.2024.116190 |
[34]
. However, because haemoglobin and parasitaemia were measured concurrently, reduced haemoglobin may represent a consequence or contemporaneous marker of infection rather than an antecedent risk factor.
Higher wealth-index values and mobile-phone ownership generally contributed to malaria-negative predictions. These variables may reflect improved housing, access to preventive interventions, health information and healthcare services. Similar associations between socioeconomic disadvantage and childhood malaria have been reported in population-based studies
| [26] | J. O. Ashaolu, T. S. Akanji, V. I. Ayansola, O. O. Olawale-Succes, A. J. Sunday, and S. Y. M. Some, ‘From risk factors to predictive modelling: applying machine learning to childhood malaria surveillance in resource-limited settings’, BMC Infect Dis, vol. 25, p. 1693, 2025,
https://doi.org/10.1186/s12879-025-12116-6 |
| [33] | T. Mhelembe, S. Ramroop, and F. Habyarimana, ‘Determining the risk factors of malaria and anemia in children between 6 and 59 months using the joint generalized linear mixed model on the 2021 Nigeria Malaria Indicator Survey dataset’, Front Public Health, vol. 12, p. 1503884, 2025,
https://doi.org/10.3389/fpubh.2024.1503884 |
[26, 33]
.
Larger numbers of daughters living elsewhere, children ever born, and household members generally shifted predictions towards malaria positivity, although their contributions were smaller. These variables may capture household crowding, fertility, migration, caregiving arrangements, or unmeasured socioeconomic conditions. Their effects should therefore be regarded as context-specific predictive signals rather than independent malaria determinants. Likewise, malaria-treatment knowledge, concern that childhood fever could indicate malaria, preceding birth interval, and day of birth showed modest or heterogeneous contributions, indicating limited and potentially interaction-dependent predictive value.
Generally, the model combined environmental, demographic, haematological, socioeconomic, household-composition, and malaria-knowledge information. However, SHAP values explain how the fitted BIRGB model generated predictions; they do not establish causality
| [34] | U. F. Zuberi, S. Aqeel, F. Hashmi, and W. Khan, ‘Altered haematological parameters in children with malaria infection, a systematic review and meta-analysis’, Diagn Microbiol Infect Dis, vol. 108, no. 4, p. 116190, 2024,
https://doi.org/10.1016/j.diagmicrobio.2024.116190 |
[34]
.
4.3. Strengths and Limitations
This study contributes a sequential ensemble architecture in which leakage-safe, out-of-fold random-forest probabilities initialise the margins of XGBoost. It also compares internal performance with county-based geographical validation, uses a microscopy-confirmed outcome from a population-based survey and evaluates competing models on identical partitions. Applying SMOTE only within the training data reduced information leakage, while combining feature selection with SHAP provided complementary evidence for predictor inclusion and model behaviour.
Limitations in this study exist that warrant consideration. The cross-sectional design precludes establishing temporal or causal relationships. Low county-specific malaria prevalence produced few positive observations, making F1 scores, thresholds and feature rankings potentially unstable. SMOTE can facilitate minority-class learning but cannot compensate for limited epidemiological information. In addition, only ten counties from one survey were modelled, and LOCO validation did not assess temporal transportability. Finally, several predictors were self-reported, while important environmental variables were incompletely represented.
5. Conclusion
Sequential initialisation of XGBoost using risk estimates from the random forest significantly improved malaria classification compared to random forest and XGBoost alone. BIRGB yielded the greatest F1 scores during training, internal testing, and LOCO validation and maintained its predictive edge across all geographically excluded counties. Altitude, household-member age, and haemoglobin were among the most influential predictors; however, their contributions explain model predictions and should not be interpreted as causality. These results enhance support for the possibility of BIRGB for regionally varied predictions of malaria risk.
6. Recommendations
Independent temporal and geographical validation is necessary before BIRGB can be used for malaria screening or resource allocation. Future studies should consider multiple rounds of survey, maintain natural malaria prevalence, and include temporally coordinated meteorological and geospatial factors. Validation should include measures of discrimination, calibration, public-health utility, subgroup performance, and fairness. PROBAST+AI should be used to assess risk of bias and applicability
.
Abbreviations
AUC-PR | Area Under the Precision–Recall Curve |
AUC-ROC | Area Under the Receiver Operating Characteristic Curve |
BIRGB | Bagging-Initialised Residual Gradient Boosting |
CI | Confidence Interval |
DHS | Demographic and Health Surveys |
ITN | Insecticide-Treated Net |
KMIS | Kenya Malaria Indicator Survey |
KNBS | Kenya National Bureau of Statistics |
LOCO | Leave-One-County-Out |
ML | Machine Learning |
NMCP | National Malaria Control Programme |
OOF | Out-of-Fold |
PROBAST+AI | Prediction Model Risk of Bias Assessment Tool Plus Artificial Intelligence |
RDT | Rapid Diagnostic Test |
RF | Random Forest |
SD | Standard Deviation |
SFFS | Sequential Forward Floating Selection |
SHAP | SHapley Additive exPlanations |
SMOTE | Synthetic Minority Over-sampling Technique |
TRIPOD+AI | Transparent Reporting of a Multivariable Prediction Model for Individual Prognosis or Diagnosis Plus Artificial Intelligence |
XGB | Extreme Gradient Boosting |
XGBoost | Extreme Gradient Boosting |
Author Contributions
Milton Koech: Conceptualisation, Formal Analysis, Investigation, Resources, Software, Methodology, Writing – original draft
Charles Mutai: Data curation, Supervision, Writing – review & editing
Gregory Kerich: Supervision, Validation, Writing – review & editing
Eliud Koech: Resources, Writing – review & editing
Data Availability Statement
The datasets used and analysed in the current study are available at this link: https://dhsprogram.com/data/dataset/Kenya_Standard-DHS_2022.cfm?flag=0
Conflicts of Interest
The authors declare no conflicts of interest.
Appendix
Table 5. Variables excluded during preprocessing.
Preprocessing step | Number of variables |
Total available variables | 2,557 |
Exact duplicate columns removed | 1,144 |
Constant or additional duplicate columns removed | 230 |
Net reduction following manual exclusion and feature engineering | 126 |
More than 30% missing | 729 |
Constant or duplicate columns removed after missingness filtering | 7 |
County variables added through one-hot encoding | +46 |
Non-informative variables removed (variance ) | 62 |
Highly correlated or redundant variables removed | 82 |
Additional variable with more than 30% missing | 1 |
Total variables excluded, net of encoded variables added | 2,335 |
Final variables retained | 222 |
Table 6. County-specific Random-forest optimised hyperparameters for the BIRGB model.
County | Trees | Maximum depth | Minimum samples to split | Minimum samples per leaf | Maximum features | Class weight | Split criterion |
Busia | 200 | 15 | 10 | 1 | sqrt | None | Entropy |
Kakamega | 200 | 15 | 10 | 1 | sqrt | None | Entropy |
Bungoma | 200 | 15 | 10 | 1 | sqrt | None | Entropy |
Kilifi | 200 | 15 | 10 | 1 | sqrt | None | Entropy |
Kisumu | 200 | 15 | 10 | 1 | sqrt | None | Entropy |
Migori | 200 | 15 | 10 | 1 | sqrt | None | Entropy |
Baringo | 200 | 15 | 10 | 1 | sqrt | None | Entropy |
Turkana | 200 | 15 | 10 | 1 | sqrt | None | Entropy |
Siaya | 200 | 15 | 10 | 1 | sqrt | None | Entropy |
Vihiga | 200 | 15 | 10 | 1 | sqrt | None | Entropy |
Table 7. County-specific XGBoost optimised hyperparameters for the BIRGB model.
County | Learning rate (eta) | Maximum depth | Minimum child weight | Row sampling ratio | Column sampling ratio | Gamma | L2 (lambda) | L1 (alpha) | Boosting rounds | Optimal threshold |
Busia | 0.01 | 6 | 1 | 0.7 | 0.9 | 0 | 1 | 0.1 | 50 | 0.593 |
Kakamega | 0.01 | 6 | 1 | 0.7 | 0.9 | 0 | 1 | 0.1 | 50 | 0.622 |
Bungoma | 0.01 | 4 | 3 | 0.8 | 0.8 | 0.5 | 2 | 0 | 80 | 0.630 |
Kilifi | 0.01 | 6 | 1 | 0.7 | 0.9 | 0 | 1 | 0.1 | 50 | 0.627 |
Kisumu | 0.01 | 3 | 3 | 0.8 | 0.7 | 0.1 | 2 | 0.1 | 50 | 0.603 |
Migori | 0.01 | 6 | 1 | 0.7 | 0.9 | 0 | 1 | 0.1 | 50 | 0.627 |
Baringo | 0.01 | 6 | 1 | 0.7 | 0.9 | 0 | 1 | 0.1 | 50 | 0.601 |
Turkana | 0.01 | 5 | 5 | 0.8 | 0.9 | 0.5 | 1 | 0.1 | 50 | 0.609 |
Siaya | 0.01 | 5 | 5 | 0.8 | 0.9 | 0.5 | 1 | 0.1 | 50 | 0.617 |
Vihiga | 0.01 | 6 | 1 | 0.7 | 0.9 | 0 | 1 | 0.1 | 50 | 0.595 |
References
| [1] |
World Health Organization, ‘World malaria report 2025: addressing the threat of antimalarial drug resistance’, Geneva, 2025. Accessed: Oct. 03, 2026. [Online]. Available:
https://www.who.int/publications/i/item/9789240117822
|
| [2] |
World Health Organization, ‘Malaria 2025 Kenya country profile’. Accessed: Oct. 03, 2026. [Online]. Available:
https://www.who.int/publications/m/item/malaria-2025-kenya-country-profile
|
| [3] |
I. S. Walker and S. J. Rogerson, ‘Pathogenicity and virulence of malaria: Sticky problems and tricky solutions’, Virulence, vol. 14, no. 1, p. 2150456, 2023,
https://doi.org/10.1080/21505594.2022.2150456
|
| [4] |
World Health Organization, ‘Global technical strategy for malaria 2016–2030, 2021 update’, Geneva. Accessed: Oct. 03, 2026. [Online]. Available:
https://www.who.int/publications/i/item/9789240031357
|
| [5] |
Ministry of Health (NMCP), ‘Kenya Malaria Strategy | 2023-2027 | WHO | Regional Office for Africa’, Nairobi, 2023. Accessed: Oct. 03, 2026. [Online]. Available:
https://afro.who.int/countries/kenya/publication/kenya-malaria-strategy-2023-2027
|
| [6] |
D. Chilot et al., ‘Pooled prevalence and risk factors of malaria among children aged 6–59 months in 13 sub-Saharan African countries: A multilevel analysis using recent malaria indicator surveys’, PLOS ONE, vol. 18, no. 5, p. e0285265, 2023,
https://doi.org/10.1371/journal.pone.0285265
|
| [7] |
J. O. Sarfo et al., ‘Malaria amongst children under five in sub-Saharan Africa: a scoping review of prevalence, risk factors and preventive interventions’, Eur J Med Res, vol. 28, no. 1, p. 80, 2023,
https://doi.org/10.1186/s40001-023-01046-1
|
| [8] |
L. S. Tusting et al., ‘Housing Improvements and Malaria Risk in Sub-Saharan Africa: A Multi-Country Analysis of Survey Data’, PLOS Medicine, vol. 14, no. 2, p. e1002234, 2017,
https://doi.org/10.1371/journal.pmed.1002234
|
| [9] |
J. N. Odhiambo, C. Kalinda, P. M. Macharia, R. W. Snow, and B. Sartorius, ‘Spatial and spatio-temporal methods for mapping malaria risk: a systematic review’, BMJ Glob Health, vol. 5, no. 10, p. e002919, 2020,
https://doi.org/10.1136/bmjgh-2020-002919
|
| [10] |
‘Machine Learning in Medicine | NEJM’, New England Journal of Medicine, Accessed: Oct. 03, 2026. [Online]. Available:
https://www.nejm.org/doi/full/10.1056/NEJMra1814259
|
| [11] |
B. J. Brown et al., ‘Data-driven malaria prevalence prediction in large densely populated urban holoendemic sub-Saharan West Africa’, Sci Rep, vol. 10, p. 15918, 2020,
https://doi.org/10.1038/s41598-020-72575-6
|
| [12] |
O. Khan, J. O. Ajadi, and M. P. Hossain, ‘Predicting malaria outbreak in The Gambia using machine learning techniques’, PLOS ONE, vol. 19, no. 5, p. e0299386, 2024,
https://doi.org/10.1371/journal.pone.0299386
|
| [13] |
I. Z. Sadiq et al., ‘Machine learning models for predicting residual malaria infections using environmental factors: A case study of the Jazan region, Kingdom of Saudi Arabia’, Decoding Infection and Transmission, vol. 2, p. 100022, 2024,
https://doi.org/10.1016/j.dcit.2024.100022
|
| [14] |
O. Sagi and L. Rokach, ‘Ensemble learning: A survey’, Wiley Interdisciplinary Reviews: Data Mining and Knowledge Discovery, vol. 8, no. 4, p. e1249, 2018,
https://doi.org/10.1002/widm.1249
|
| [15] |
T. G. Dietterich, ‘Ensemble Methods in Machine Learning’, in Multiple Classifier Systems, Berlin, Heidelberg: Springer, 2000, pp. 1–15,
https://doi.org/10.1007/3-540-45014-9_1
|
| [16] |
Z.-H. Zhou, Ensemble Methods: Foundations and Algorithms. New York: Chapman and Hall/CRC, 2012.
https://doi.org/10.1201/b12207
|
| [17] |
D. H. Wolpert, ‘Stacked generalization’, Neural Networks, vol. 5, no. 2, pp. 241–259, 1992,
https://doi.org/10.1016/S0893-6080(05)80023-1
|
| [18] |
Division of National Malaria Programme (DNMP) [Kenya] and ICF, ‘Kenya Malaria Indicator Survey 2020’, DNMP and ICF, Nairobi, Kenya and Rockville, Maryland, USA, 2021. Accessed: Aug. 27, 2026. [Online]. Available:
https://dhsprogram.com/publications/publication-MIS36-MIS-Final-Reports.cfm
|
| [19] |
The DHS Program, ‘Kenya MIS, 2020 - Summary Report’, Kenya, Summary Reports/Key Findings, 2021. Accessed: Sep. 01, 2026. [Online]. Available:
https://dhsprogram.com/publications/publication-SR270-Summary-Reports-Key-Findings.cfm
|
| [20] |
S. van Buuren and K. Groothuis-Oudshoorn, ‘mice: Multivariate Imputation by Chained Equations in R’, Journal of Statistical Software, vol. 45, pp. 1–67, 2011,
https://doi.org/10.18637/jss.v045.i03
|
| [21] |
W. J. Youden, ‘Index for rating diagnostic tests’, Cancer, vol. 3, no. 1, pp. 32–35, 1950,
https://doi.org/10.1002/1097-0142(1950)3:1%3C32:aid-cncr2820030106%3E3.0.co;2-3
|
| [22] |
R. Fluss, D. Faraggi, and B. Reiser, ‘Estimation of the Youden Index and its associated cutoff point’, Biom J, vol. 47, no. 4, pp. 458–472, 2005,
https://doi.org/10.1002/bimj.200410135
|
| [23] |
C. Goutte and E. Gaussier, ‘A Probabilistic Interpretation of Precision, Recall and F-Score, with Implication for Evaluation’, in Advances in Information Retrieval, D. E. Losada and J. M. Fernández-Luna, Eds, Berlin, Heidelberg: Springer, 2005, pp. 345–359,
https://doi.org/10.1007/978-3-540-31865-1_25
|
| [24] |
P. Pudil, J. Novovičová, and J. Kittler, ‘Floating search methods in feature selection’, Pattern Recognition Letters, vol. 15, no. 11, pp. 1119–1125, 1994,
https://doi.org/10.1016/0167-8655(94)90127-9
|
| [25] |
S. M. Mthethwa and S. F. Melesse, ‘A Machine Learning Approach to the Prediction of Malaria in Under-five Children: Analysis of the 2021 Nigerian Malaria Indicator Survey’,
https://doi.org/10.2174/0118749445396163250604103305
|
| [26] |
J. O. Ashaolu, T. S. Akanji, V. I. Ayansola, O. O. Olawale-Succes, A. J. Sunday, and S. Y. M. Some, ‘From risk factors to predictive modelling: applying machine learning to childhood malaria surveillance in resource-limited settings’, BMC Infect Dis, vol. 25, p. 1693, 2025,
https://doi.org/10.1186/s12879-025-12116-6
|
| [27] |
B. O. Nyawanda et al., ‘The influence of malaria control interventions and climate variability on changes in the geographical distribution of parasite prevalence in Kenya between 2015 and 2020’, Int J Health Geogr, vol. 23, p. 22, 2024,
https://doi.org/10.1186/s12942-024-00381-8
|
| [28] |
C. Kioko and J. Blanford, ‘Malaria survey data and geospatial suitability mapping for understanding spatial and temporal variations of risk across Kenya’, Parasite Epidemiol Control, vol. 28, p. e00399, 2024,
https://doi.org/10.1016/j.parepi.2024.e00399
|
| [29] |
A. Tariq et al., ‘Modelling the effects of precipitation and temperature on malaria incidence in coastal and western Kenya’, Malar J, vol. 24, no. 1, p. 208, 2025,
https://doi.org/10.1186/s12936-025-05428-0
|
| [30] |
H. Yuan, ‘Toward real‐world deployment of machine learning for health care: External validation, continual monitoring, and randomized clinical trials’, Health Care Science, vol. 3, no. 5, pp. 360–364, 2024,
https://doi.org/10.1002/hcs2.114
|
| [31] |
G. S. Collins et al., ‘TRIPOD+AI statement: updated guidance for reporting clinical prediction models that use regression or machine learning methods’, BMJ, vol. 385, p. e078378, 2024,
https://doi.org/10.1136/bmj-2023-078378
|
| [32] |
‘PROBAST+AI’, Latitudes Network. Accessed: Oct. 10, 2026. [Online]. Available:
https://www.latitudes-network.org/tool/probastai/
|
| [33] |
T. Mhelembe, S. Ramroop, and F. Habyarimana, ‘Determining the risk factors of malaria and anemia in children between 6 and 59 months using the joint generalized linear mixed model on the 2021 Nigeria Malaria Indicator Survey dataset’, Front Public Health, vol. 12, p. 1503884, 2025,
https://doi.org/10.3389/fpubh.2024.1503884
|
| [34] |
U. F. Zuberi, S. Aqeel, F. Hashmi, and W. Khan, ‘Altered haematological parameters in children with malaria infection, a systematic review and meta-analysis’, Diagn Microbiol Infect Dis, vol. 108, no. 4, p. 116190, 2024,
https://doi.org/10.1016/j.diagmicrobio.2024.116190
|
Cite This Article
-
APA Style
Koech, M., Mutai, C., Kerich, G., Koech, E. (2026). A Bagging-Initialised Residual Gradient-Boosting Framework for Predicting Malaria Infection Among Children Under Five Years in Kenya. Biomedical Statistics and Informatics, 11(4), 99-112. https://doi.org/10.11648/j.bsi.20261104.12
 Copy
|
 Download
ACS Style
Koech, M.; Mutai, C.; Kerich, G.; Koech, E. A Bagging-Initialised Residual Gradient-Boosting Framework for Predicting Malaria Infection Among Children Under Five Years in Kenya. Biomed. Stat. Inform. 2026, 11(4), 99-112. doi: 10.11648/j.bsi.20261104.12
Copy
|
Download
AMA Style
Koech M, Mutai C, Kerich G, Koech E. A Bagging-Initialised Residual Gradient-Boosting Framework for Predicting Malaria Infection Among Children Under Five Years in Kenya. Biomed Stat Inform. 2026;11(4):99-112. doi: 10.11648/j.bsi.20261104.12
Copy
|
Download
-
@article{10.11648/j.bsi.20261104.12,
  author = {Milton Koech and Charles Mutai and Gregory Kerich and Eliud Koech},
  title = {A Bagging-Initialised Residual Gradient-Boosting Framework for Predicting Malaria Infection Among Children Under Five Years in Kenya},
  journal = {Biomedical Statistics and Informatics},
  volume = {11},
  number = {4},
  pages = {99-112},
  doi = {10.11648/j.bsi.20261104.12},
  url = {https://doi.org/10.11648/j.bsi.20261104.12},
  eprint = {https://article.sciencepublishinggroup.com/pdf/10.11648.j.bsi.20261104.12},
  abstract = {Background: Malaria remains an important cause of morbidity and mortality among children younger than five years in Kenya. Although machine-learning models can capture complex relationships in population-based data, bias–variance trade-offs and limited geographical transportability may constrain their performance. This study developed and evaluated a bagging-initialised residual gradient-boosting (BIRGB) framework to predict microscopy-confirmed malaria infection in children under five years in Kenya. Methods: Data were obtained from 3,749 children with microscopy results in the 2020 Kenya Malaria Indicator Survey. The proposed BIRGB framework used leakage-safe, out-of-fold random-forest probabilities, transformed into log-odds, to initialise XGBoost, which fitted regularised additive trees to correct residual prediction errors. Performance was compared with standalone random forest and XGBoost models using held-out test data and leave-one-county-out geographical validation. Sequential forward floating selection identified the optimal predictor subset, and SHapley Additive exPlanations quantified the magnitude and direction of predictor contributions to malaria predictions. Results: BIRGB achieved the best mean internal-test F1 score (88.4%), followed by random forest (68.5%) and XGBoost (56.8%). This advantage was also observed in the leave-one-county-out validation, where BIRGB had a mean F1 score of 90.5% compared to 68.3% for random forest and 55.5% for XGBoost. SHAP analysis identified altitude, household-member age, haemoglobin level, household wealth, mobile-phone ownership, household size, number of children ever born, and number of daughters living elsewhere as influential predictors. Higher altitude, haemoglobin, and wealth generally shifted predictions toward malaria negativity, whereas higher age and household size generally shifted predictions toward malaria positivity. Conclusions: Sequentially initialising XGBoost with random-forest probability estimates improved malaria classification in both internal testing and geographical validation.},
 year = {2026}
}
Copy
|
Download
-
TY  - JOUR
T1  - A Bagging-Initialised Residual Gradient-Boosting Framework for Predicting Malaria Infection Among Children Under Five Years in Kenya
AU  - Milton Koech
AU  - Charles Mutai
AU  - Gregory Kerich
AU  - Eliud Koech
Y1  - 2026/11/03
PY  - 2026
N1  - https://doi.org/10.11648/j.bsi.20261104.12
DO  - 10.11648/j.bsi.20261104.12
T2  - Biomedical Statistics and Informatics
JF  - Biomedical Statistics and Informatics
JO  - Biomedical Statistics and Informatics
SP  - 99
EP  - 112
PB  - Science Publishing Group
SN  - 2578-8728
UR  - https://doi.org/10.11648/j.bsi.20261104.12
AB  - Background: Malaria remains an important cause of morbidity and mortality among children younger than five years in Kenya. Although machine-learning models can capture complex relationships in population-based data, bias–variance trade-offs and limited geographical transportability may constrain their performance. This study developed and evaluated a bagging-initialised residual gradient-boosting (BIRGB) framework to predict microscopy-confirmed malaria infection in children under five years in Kenya. Methods: Data were obtained from 3,749 children with microscopy results in the 2020 Kenya Malaria Indicator Survey. The proposed BIRGB framework used leakage-safe, out-of-fold random-forest probabilities, transformed into log-odds, to initialise XGBoost, which fitted regularised additive trees to correct residual prediction errors. Performance was compared with standalone random forest and XGBoost models using held-out test data and leave-one-county-out geographical validation. Sequential forward floating selection identified the optimal predictor subset, and SHapley Additive exPlanations quantified the magnitude and direction of predictor contributions to malaria predictions. Results: BIRGB achieved the best mean internal-test F1 score (88.4%), followed by random forest (68.5%) and XGBoost (56.8%). This advantage was also observed in the leave-one-county-out validation, where BIRGB had a mean F1 score of 90.5% compared to 68.3% for random forest and 55.5% for XGBoost. SHAP analysis identified altitude, household-member age, haemoglobin level, household wealth, mobile-phone ownership, household size, number of children ever born, and number of daughters living elsewhere as influential predictors. Higher altitude, haemoglobin, and wealth generally shifted predictions toward malaria negativity, whereas higher age and household size generally shifted predictions toward malaria positivity. Conclusions: Sequentially initialising XGBoost with random-forest probability estimates improved malaria classification in both internal testing and geographical validation.
VL  - 11
IS  - 4
ER  -
Copy
|
Download





 Share This Article
 Twitter
 Linked In
 Facebook