Neonatal mortality remains a critical public health challenge, particularly in low- and middle-income countries (LMICs), where limited healthcare resources and fragmented follow-up systems hinder timely interventions. Accurate prediction of neonatal death is essential for risk stratification, resource allocation, and improving survival outcomes. While traditional survival analysis methods like the Kaplan-Meier estimator and Cox proportional hazards (Cox PH) model are widely used, they face limitations in handling non-linear relationships, high-dimensional data, and violations of proportional hazards assumptions. Random Survival Forests (RSF), a machine learning approach, offers potential advantages but lacks sufficient comparative evaluation in neonatal mortality prediction, especially within LMIC contexts. This study aimed to comparatively evaluate the performance of Kaplan-Meier, Cox PH, and RSF models in predicting neonatal mortality using a synthetic dataset reflecting perinatal epidemiology in Kenya. The research addresses a significant and direct methodological comparisons across these models in neonatal populations, particularly under real-world conditions involving censoring, missing data, and non-proportional hazards. We assessed discrimination (C-index, time-dependent AUC), calibration (Integrated Brier Score, CRPS), and clinical interpretability. The dataset included 2,000 neonates with 17 covariates including but not limited to gestational age, birth weight, maternal health, and socioeconomic status. Results showed that RSF outperformed both Kaplan-Meier and Cox PH in discrimination (C-index: 0.875 vs. 0.868) and maintained strong calibration, particularly at 28 days. Variable importance measures identified gestational age, birth weight, and maternal health score as top predictors. SHAP values enhanced interpretability of RSF outputs. The Cox model provided clinically intuitive hazard ratios but was less flexible in capturing interactions. The study concluded that RSF offers superior predictive accuracy for neonatal mortality and should be integrated into risk prediction tools, especially in data-rich settings. Policy makers should support adoption of advanced analytics in perinatal care systems, while maintaining traditional models for inferential clarity. Combining both paradigms can optimize neonatal survival strategies.
| Published in | Computational Biology and Bioinformatics (Volume 13, Issue 2) |
| DOI | 10.11648/j.cbb.20251302.11 |
| Page(s) | 42-59 |
| Creative Commons |
This is an Open Access article, distributed under the terms of the Creative Commons Attribution 4.0 International License (http://creativecommons.org/licenses/by/4.0/), which permits unrestricted use, distribution and reproduction in any medium or format, provided the original work is properly cited. |
| Copyright |
Copyright © The Author(s), 2025. Published by Science Publishing Group |
Neonatal Mortality, Survival Analysis, Kaplan-Meier Estimator, Cox Proportional Hazards Model, Random Survival Forests
Characteristic | Overall | 95% CI | (Survived =0) | 95% CI | (Died =1) | 95% CI | p-value2 |
|---|---|---|---|---|---|---|---|
N = 2,0001 | N = 1,4001 | N = 6001 | |||||
Maternal Age | 30 (23, 37) | 30, 30 | 29 (22, 37) | 29, 30 | 32 (25, 39) | 31, 32 | <0.001 |
Prenatal Visits | 6 (4, 8) | 5.9, 6.1 | 6 (4, 8) | 6.1, 6.4 | 5 (4, 7) | 5.3, 5.6 | <0.001 |
Birth Weight kg | 2.99 (2.61, 3.39) | 3.0, 3.0 | 3.03 (2.66, 3.44) | 3.0, 3.1 | 2.89 (2.48, 3.30) | 2.8, 2.9 | <0.001 |
Gestational Age weeks | 38 (36, 40) | 38, 38 | 38 (36, 40) | 38, 39 | 37 (35, 39) | 37, 37 | <0.001 |
Maternal Health Score | 5.35 (3.20, 7.85) | 5.3, 5.6 | 5.96 (3.66, 8.25) | 5.7, 6.0 | 4.22 (2.53, 6.08) | 4.3, 4.7 | <0.001 |
Maternal Nutrition Score | 5.47 (3.28, 7.83) | 5.4, 5.6 | 5.92 (3.58, 8.11) | 5.6, 5.9 | 4.63 (2.69, 7.08) | 4.7, 5.1 | <0.001 |
Apgar Score (5min) | 4.90 (2.50, 7.30) | 4.8, 5.0 | 5.90 (3.30, 8.10) | 5.5, 5.8 | 2.90 (1.30, 4.85) | 3.1, 3.4 | <0.001 |
Distance to Health Facility km | 7 (3, 14) | 9.4, 10 | 6 (3, 12) | 8.4, 9.3 | 9 (4, 17) | 11, 13 | <0.001 |
Characteristic | Overall | 95% CI | (Survived =0) | 95% CI | (Died =1) | 95% CI | p-value2 |
|---|---|---|---|---|---|---|---|
N = 2,0001 | N = 1,4001 | N = 6001 | |||||
Socioeconomic Status | <0.001 | ||||||
Low | 608 (30%) | 28%, 32% | 407 (29%) | 27%, 32% | 201 (34%) | 30%, 37% | |
Medium | 620 (31%) | 29%, 33% | 408 (29%) | 27%, 32% | 212 (35%) | 32%, 39% | |
High | 493 (25%) | 23%, 27% | 360 (26%) | 23%, 28% | 133 (22%) | 19%, 26% | |
Very High | 279 (14%) | 12%, 16% | 225 (16%) | 14%, 18% | 54 (9.0%) | 6.9%, 12% | |
Delivery Method | 0.035 | ||||||
Vaginal | 1,380 (69%) | 67%, 71% | 986 (70%) | 68%, 73% | 394 (66%) | 62%, 69% | |
Cesarean | 620 (31%) | 29%, 33% | 414 (30%) | 27%, 32% | 206 (34%) | 31%, 38% | |
Multiple Birth | 0.2 | ||||||
Singleton | 1,900 (95%) | 94%, 96% | 1,336 (95%) | 94%, 96% | 564 (94%) | 92%, 96% | |
Multiple | 100 (5.0%) | 4.1%, 6.1% | 64 (4.6%) | 3.6%, 5.8% | 36 (6.0%) | 4.3%, 8.3% | |
Skilled Birth Attendant | <0.001 | ||||||
Absent | 294 (15%) | 13%, 16% | 180 (13%) | 11%, 15% | 114 (19%) | 16%, 22% | |
Present | 1,706 (85%) | 84%, 87% | 1,220 (87%) | 85%, 89% | 486 (81%) | 78%, 84% | |
Smoking During Pregnancy | <0.001 | ||||||
Did not Smoke | 1,806 (90%) | 89%, 92% | 1,292 (92%) | 91%, 94% | 514 (86%) | 83%, 88% | |
Smoked | 194 (9.7%) | 8.5%, 11% | 108 (7.7%) | 6.4%, 9.3% | 86 (14%) | 12%, 17% | |
Alcohol Use During Pregnancy | 0.012 | ||||||
Did not Use | 1,840 (92%) | 91%, 93% | 1,302 (93%) | 92%, 94% | 538 (90%) | 87%, 92% | |
Use | 160 (8.0%) | 6.9%, 9.3% | 98 (7.0%) | 5.7%, 8.5% | 62 (10%) | 8.1%, 13% | |
NICU Admission | <0.001 | ||||||
Not admitted | 1,612 (81%) | 79%, 82% | 1,171 (84%) | 82%, 86% | 441 (74%) | 70%, 77% | |
Admitted | 388 (19%) | 18%, 21% | 229 (16%) | 14%, 18% | 159 (27%) | 23%, 30% | |
Type of Health Facility | <0.001 | ||||||
Public | 1,240 (62%) | 60%, 64% | 872 (62%) | 60%, 65% | 368 (61%) | 57%, 65% | |
Private | 475 (24%) | 22%, 26% | 353 (25%) | 23%, 28% | 122 (20%) | 17%, 24% | |
Rural Clinic | 285 (14%) | 13%, 16% | 175 (13%) | 11%, 14% | 110 (18%) | 15%, 22% | |
Maternal Chronic Conditions | <0.001 | ||||||
No Chronic Condition | 1,569 (78%) | 77%, 80% | 1,130 (81%) | 79%, 83% | 439 (73%) | 69%, 77% | |
Have Chronic Condition | 431 (22%) | 20%, 23% | 270 (19%) | 17%, 21% | 161 (27%) | 23%, 31% | |
Maternal Education Level | 0.068 | ||||||
None | 304 (15%) | 14%, 17% | 200 (14%) | 13%, 16% | 104 (17%) | 14%, 21% | |
Primary | 698 (35%) | 33%, 37% | 477 (34%) | 32%, 37% | 221 (37%) | 33%, 41% | |
Secondary | 682 (34%) | 32%, 36% | 488 (35%) | 32%, 37% | 194 (32%) | 29%, 36% | |
Tertiary | 316 (16%) | 14%, 17% | 235 (17%) | 15%, 19% | 81 (14%) | 11%, 17% | |
Environmental Exposure | 0.001 | ||||||
Not Exposed | 1,695 (85%) | 83%, 86% | 1,210 (86%) | 84%, 88% | 485 (81%) | 77%, 84% | |
Exposed | 305 (15%) | 14%, 17% | 190 (14%) | 12%, 16% | 115 (19%) | 16%, 23% | |
History of Pregnancy Complications | 0.006 | ||||||
No complication | 1,593 (80%) | 78%, 81% | 1,138 (81%) | 79%, 83% | 455 (76%) | 72%, 79% | |
Had complication | 407 (20%) | 19%, 22% | 262 (19%) | 17%, 21% | 145 (24%) | 21%, 28% |
Period | Deaths | Infants at Risk | Mortality Rate (%) | 95% CI |
|---|---|---|---|---|
Early Neonatal (0-6 days) | 257 | 2000 | 12.85 | [11.4, -14.4] |
Late Neonatal (7-28 days) | 223 | 1743 | 12.79 | [11.3, -14.5] |
Post-Neonatal (>28 days) | 120 | 1520 | 7.89 | [6.6, -9.4] |
Overall | 600 | 2000 | 30 | [28, -32.1] |
Key Categorical Predictors | Groups Compared | N (per group) | Observed deaths | Expected deaths | Chi-square | df | p-value |
|---|---|---|---|---|---|---|---|
NICU Admission | Not admitted vs Admitted | 1612 / 388 | 441 / 159 | 490 / 110 | 26.9 | 1 | <0.001 |
Delivery Method | Vaginal vs Cesarean | 1380 / 620 | 394 / 206 | 420 / 180 | 5.3 | 1 | 0.02 |
Socioeconomic Status | Low / Medium / High / Very High | 608 / 620 / 493 / 279 | 201 / 212 / 133 / 54 | 177.0 / 181.2 / 154.3 / 87.5 | 24.4 | 3 | <0.001 |
Skilled Birth Attendant | Absent vs Present | 294 / 1706 | 114 / 486 | 84.5 / 515.5 | 12.1 | 1 | <0.001 |
Multiple Birth | Singleton vs Multiple | 1900 / 100 | 564 / 36 | 573 / 27 | 3.1 | 1 | 0.08 |
NICU Admission | Survival for 14 Days | Survival for 28 Days |
|---|---|---|
NICU Admission = No | 0.822 | 0.780 |
NICU Admission = Yes | 0.763 | 0.678 |
Log-rank Test (NICU Admission) | Chi-sq = 26.9, p = 2e-07 |
Variable | Coefficient | Hazard Ratio (HR) | SE | Z-value | 95% CI Lower | 95% CI Upper | P-value |
|---|---|---|---|---|---|---|---|
Maternal Age | 0.0243 | 1.0246 | 0.0049 | 4.951 | 0.0147 | 0.034 | 7.00E-07 |
Prenatal Visits | -0.1317 | 0.8766 | 0.0177 | -7.464 | -0.1663 | -0.0972 | 0.00E+00 |
Birth Weight (kg) | -0.6353 | 0.5298 | 0.0716 | -8.869 | -0.7757 | -0.4949 | 0.00E+00 |
Gestational Age weeks | -0.139 | 0.8702 | 0.0139 | -9.974 | -0.1664 | -0.1117 | 0.00E+00 |
Maternal Health Score | -0.1815 | 0.834 | 0.0172 | -10.541 | -0.2153 | -0.1478 | 0.00E+00 |
Socioeconomic Status-Medium | -0.0213 | 0.979 | 0.1015 | -0.21 | -0.2201 | 0.1776 | 8.34E-01 |
Socioeconomic Status-High | -0.3145 | 0.7301 | 0.1148 | -2.739 | -0.5396 | -0.0895 | 6.17E-03 |
Socioeconomic Status-Very High | -0.365 | 0.6942 | 0.1553 | -2.35 | -0.6694 | -0.0605 | 1.88E-02 |
Delivery Method-Cesarean | 0.3091 | 1.3622 | 0.0878 | 3.522 | 0.1371 | 0.4812 | 4.29E-04 |
Multiple Birth -Multiple | 0.5766 | 1.78 | 0.1745 | 3.305 | 0.2347 | 0.9186 | 9.49E-04 |
Maternal Nutrition Score | -0.1119 | 0.8941 | 0.0162 | -6.917 | -0.1437 | -0.0802 | 0.00E+00 |
Maternal Chronic Conditions-Yes | 0.3564 | 1.4281 | 0.0943 | 3.779 | 0.1715 | 0.5412 | 1.58E-04 |
Skilled Birth Attendant-Present | -0.3009 | 0.7402 | 0.1059 | -2.841 | -0.5085 | -0.0933 | 4.50E-03 |
Maternal Education Level-Primary | -0.0827 | 0.9207 | 0.1213 | -0.682 | -0.3204 | 0.155 | 4.95E-01 |
Maternal Education Level-Secondary | -0.3091 | 0.7341 | 0.1244 | -2.485 | -0.5529 | -0.0653 | 1.30E-02 |
Maternal Education Level-Tertiary | -0.4786 | 0.6197 | 0.1513 | -3.162 | -0.7752 | -0.1819 | 1.57E-03 |
Smoking During Pregnancy-Yes | 0.3681 | 1.445 | 0.1202 | 3.063 | 0.1325 | 0.6036 | 2.19E-03 |
Alcohol Use During Pregnancy-Yes | 0.4027 | 1.4958 | 0.1378 | 2.922 | 0.1326 | 0.6728 | 3.48E-03 |
Apgar_Score_5min | -0.2743 | 0.7601 | 0.0164 | -16.69 | -0.3065 | -0.2421 | 0.00E+00 |
NICU Admission-Admitted | 0.5132 | 1.6707 | 0.094 | 5.458 | 0.3289 | 0.6976 | 0.00E+00 |
Distance to Health Facility (km) | 0.0347 | 1.0354 | 0.004 | 8.783 | 0.027 | 0.0425 | 0.00E+00 |
Characteristic | Result |
|---|---|
Sample size | 2000 |
Number of deaths | 600 |
Number of trees | 1000 |
Forest terminal node size | 3 |
Average number of terminal nodes | 272.42 |
Variables tried at each split | 4 |
Total number of variables | 17 |
Resampling used to grow trees | Without replacement (swor) |
Resample size used to grow trees | 1264 |
Analysis | RSF |
Family | Survival |
Splitting rule | Log-rank (random) |
Number of random split points | 10 |
(OOB) Continuous Ranked Probability Score (CRPS) | 42.46 |
(OOB) Standardized CRPS | 0.168 |
(OOB) Requested performance error | 0.205 |
Time (days) | Cox AUC | RSF AUC |
|---|---|---|
7 | 0.828 | 0.835 |
14 | 0.845 | 0.852 |
28 | 0.868 | 0.875 |
90 | 0.876 | 0.882 |
Metrics | Cox | RSF |
|---|---|---|
Harrell C | 0.825 | 0.953 |
Integrated Brier score (crps): | 0.155 | 0.156 |
Reference (CRPS) | 0.172 | 0.172 |
KM | Kaplan-Meier |
Cox PH | Cox Proportional Hazards |
RSF | Random Survival Forest |
HR | Hazard Ratio |
CI | Confidence Interval |
AUC | Area Under the Curve |
C-index | Concordance Index |
IBS | Integrated Brier Score |
CRPS | Continuous Ranked Probability Score |
NICU | Neonatal Intensive Care Unit |
APGAR | Appearance, Pulse, Grimace, Activity, Respiration |
OOB | Out-of-Bag |
| [1] |
Arora, A. (2024, March 12). Levels and trends in child mortality - UNICEF DATA. UNICEF DATA.
https://data.unicef.org/resources/levels-and-trends-in-child-mortality-2023/ |
| [2] | Liu, L., Oza, S., Hogan, D., Chu, Y., Perin, J., Zhu, J., Lawn, J. E., Cousens, S., Mathers, C., & Black, R. E. (2016). Global, regional, and national causes of under-5 mortality in 2000-15: an updated systematic analysis with implications for the Sustainable Development Goals. The Lancet, 388(10063), 3027-3035. |
| [3] |
WHO. (2024, March 14). Newborn mortality.
https://www.who.int/news-room/fact-sheets/detail/newborn-mortality |
| [4] | Yan, T., Mullany, L. C., Subedi, S., Hazel, E. A., Khatry, S. K., Mohan, D., Zeger, S., Tielsch, J. M., LeClerq, S. C., & Katz, J. (2023). Risk factors for neonatal mortality: an observational cohort study in Sarlahi district of rural southern Nepal. BMJ Open, 13(9), e066931-e066931. |
| [5] | Kaplan, E. L., & Meier, P. (1958). Nonparametric Estimation from Incomplete Observations. Journal of the American Statistical Association, 53(282), 457-481. |
| [6] | Getaneh, T., Homaira, N., Kasaye, H., Jane, S., Chughtai, A. A., & Lui, K. (2025). Global inequities in the survival of extremely preterm infants: a systematic review and meta-analysis. BMC Pediatrics, 25(1). |
| [7] | Odongkara, B., Nankabirwa, V., Achora, V., Arach, A. A., Napyo, A., Musaba, M., Mukunya, D., Ndeezi, G., Tylleskär, T., & Tumwine, J. K. (2024). Low birthweight increased the risk of neonatal death twenty-folds in Northern Uganda: a community-based cohort study. MedRxiv (Cold Spring Harbor Laboratory). |
| [8] | Orsido, T. T., Asseffa, N. A., & Berheto, T. M. (2019). Predictors of Neonatal mortality in Neonatal intensive care unit at referral Hospital in Southern Ethiopia: a retrospective cohort study. BMC Pregnancy and Childbirth, 19(1). |
| [9] | Cox, D. R. (1972). Regression Models and Life-Tables. Journal of the Royal Statistical Society: Series B (Methodological), 34(2), 187-202. |
| [10] | Ezeh, O. K., Agho, K. E., Dibley, M. J., Hall, J., & Page, A. N. (2014). Determinants of neonatal mortality in Nigeria: evidence from the 2008 demographic and health survey. BMC Public Health, 14(1). |
| [11] | Orsini, N. (2013). Review of Flexible Parametric Survival Analysis Using Stata: Beyond the Cox Model by Patrick Royston and Paul C. Lambert. The Stata Journal: Promoting Communications on Statistics and Stata, 13(1), 212-216. |
| [12] | Wang, P., Li, Y., & Reddy, C. K. (2019). Machine Learning for Survival Analysis. ACM Computing Surveys, 51(6), 1-36. |
| [13] | Ishwaran, H., Kogalur, U. B., Blackstone, E. H., & Lauer, M. S. (2008). Random survival forests. The Annals of Applied Statistics, 2(3), 841-860. |
| [14] | Berkowitz, M., Altman, R. M., & Loughin, T. M. (2024). Random forests for survival data: which methods work best and under what conditions? The International Journal of Biostatistics. |
| [15] | MASHRAFI, S. S. A., Tafakori, L., & Abdollahian, M. (2025). Predicting Early Neonatal Mortality using Machine Learning Models. |
| [16] | Chatziioannidis, I., Mitsiakos, G., Karagianni, P., Tsakalidis, C., & Dimopoulou, A. (2020). Predictors of early neonatal mortality in extremely low birth weight infants in a Neonatal Intensive Care Unit over a 10-year period. DOAJ (DOAJ: Directory of Open Access Journals). |
| [17] | Shukla, V., & Carlo, W. A. (2019). Technology-driven Neonatal Health Care in Low-resource Settings: Expectations and Reality. EClinicalMedicine, 12, 2-3. |
| [18] | Mangold, C., Zoretic, S., Thallapureddy, K., Moreira, A., Chorath, K., & Moreira, A. (2021). Machine Learning Models for Predicting Neonatal Mortality: A Systematic Review. Neonatology, 118(4), 394-405. |
| [19] | O’Sullivan, C., Hsiang-Te Tsai, D., Chang-Yen Wu, I., Boselli, E., Hughes, C., Padmanabhan, D., & Hsia, Y. (2023). Machine learning applications on neonatal sepsis treatment: a scoping review. 23(1). |
| [20] | Collins, G. S., Dhiman, P., Ma, J., Schlussel, M. M., Archer, L., Calster, B. V., Harrell, F. E., Martin, G. P., Moons, K. G. M., Smeden, M. van, Sperrin, M., Bullock, G. S., & Riley, R. D. (2024). Evaluation of clinical prediction models (part 1): from development to external validation. BMJ, 384, e074819. |
| [21] | Lundberg, S. M., Erion, G., Chen, H., DeGrave, A., Prutkin, J. M., Nair, B., Katz, R., Himmelfarb, J., Bansal, N., & Lee, S.-I. (2020). From local explanations to global understanding with explainable AI for trees. Nature Machine Intelligence, 2(1), 56-67. |
| [22] | Weissler, E. H., Naumann, T., Andersson, T., Ranganath, R., Elemento, O., Luo, Y., Freitag, D. F., Benoit, J., Hughes, M. C., Khan, F., Slater, P., Shameer, K., Roe, M., Hutchison, E., Kollins, S. H., Broedl, U., Meng, Z., Wong, J. L., Curtis, L., & Huang, E. (2021). The role of machine learning in clinical research: transforming the future of evidence generation. Trials, 22(1). |
| [23] | Hendry, D. J. (2013). Data generation for the Cox proportional hazards model with time-dependent covariates: a method for medical researchers. Statistics in Medicine, 33(3), 436-454. |
| [24] | Carvajal-Aguirre, L., Amouzou, A., Mehra, V., Ziqi, M., Zaka, N., & Newby, H. (n.d.). Gap between contact and content in maternal and newborn care: An analysis of data from 20 countries in sub-Saharan Africa. Journal of Global Health, 7(2). |
| [25] | Suliman, A., Masud, M., Serhani, M. A., Abdullahi, A. S., & Oulhaj, A. (2024). Predictive performance of machine learning compared to statistical methods in time-to-event analysis of cardiovascular disease: a systematic review protocol. BMJ Open, 14(4), e082654-e082654. |
| [26] | Feng, J., Lee, J., Vesoulis, Z. A., & Li, F. (2021). Predicting mortality risk for preterm infants using deep learning models with time-series vital sign data. Npj Digital Medicine, 4(1). |
| [27] | Grambsch, P. M., & Therneau, T. M. (1994). Proportional Hazards Tests and Diagnostics Based on Weighted Residuals. Biometrika, 81(3), 515-515. |
| [28] | Spytek, M., Krzyziński, M., Langbein, S. H., Baniecki, H., Wright, M. N., & Biecek, P. (2023). survex: an R package for explaining machine learning survival models. Bioinformatics, 39(12). |
| [29] | Blencowe, H., Cousens, S., Chou, D., Oestergaard, M., Say, L., Moller, A.-B., Kinney, M., & Lawn, J. (2013). Born Too Soon: The global epidemiology of 15 million preterm births. Reproductive Health, 10(Suppl 1), S2. |
| [30] | Casey, B. M., McIntire, D. D., & Leveno, K. J. (2021). The Continuing Value of the Apgar Score for the Assessment of Newborn Infants. New England Journal of Medicine, 344(7), 467-471. |
| [31] | Darnton-Hill, I., & Mkparu, U. (2015). Micronutrients in Pregnancy in Low- and Middle-Income Countries. Nutrients, 7(3), 1744-1768. |
| [32] | Cooper, P. A. (2013). The Challenge of Reducing Neonatal Mortality in Low- and Middle-Income Countries. Pediatrics, 133(1), 4-6. |
| [33] | Nakua, E. K., Sevugu, J. T., Dzomeku, V. M., Otupiri, E., Lipkovich, H. R., & Owusu-Dabo, E. (2015). Home birth without skilled attendants despite millennium villages project intervention in Ghana: insight from a survey of women’s perceptions of skilled obstetric care. BMC Pregnancy and Childbirth, 15(1). |
| [34] | McIntire, D. D., & Leveno, K. J. (2008). Neonatal Mortality and Morbidity Rates in Late Preterm Births Compared With Births at Term. Obstetrics & Gynecology, 111(1), 35-41. |
| [35] | Sokou, R., Lianou, A., Lampridou, M., Panagiotounakou, P., Kafalidis, G., Paliatsiou, S., Volaki, P., Tsantes, A. G., Boutsikou, T., Iliodromiti, Z., & Iacovidou, N. (2025). Neonates at Risk: Understanding the Impact of High-Risk Pregnancies on Neonatal Health. Medicina, 61(6), 1077-1077. |
| [36] | Liu, Q., Deng, J., Yan, W., Qin, C., Du, M., Wang, Y., Zhang, S., Liu, M., & Liu, J. (2024). Burden and trends of infectious disease mortality attributed to air pollution, unsafe water, sanitation, and hygiene, and non-optimal temperature globally and in different socio-demographic index regions. Global Health Research and Policy, 9(1). |
| [37] | Nabila, M., Baidani, A., Mourajid, Y., Chebabe, M., & Abderraouf, H. (2024). Analysis of Risk Determinants of Neonatal Mortality in the Last Decade: A Systematic Literature Review (2013-2023). Pediatric Reports, 16(3), 696-716. |
| [38] | Mangu, C. D., Rumisha, S. F., Lyimo, E. P., Mremi, I. R., Massawe, I. S., Bwana, V. M., Chiduo, M. G., & Mboera, L. E. G. (2020). Trends, patterns and cause-specific neonatal mortality in Tanzania: a hospital-based retrospective survey. International Health, 13(4), 334-343. |
APA Style
Lumumba, V. W., Muriithi, D. K., Langat, A. K., Wanyama, M. A., Njoroge, E. W., et al. (2025). A Comparative Evaluation of Kaplan-Meier, Cox Proportional Hazards, and Random Survival Forests for Neonatal Mortality Prediction. Computational Biology and Bioinformatics, 13(2), 42-59. https://doi.org/10.11648/j.cbb.20251302.11
ACS Style
Lumumba, V. W.; Muriithi, D. K.; Langat, A. K.; Wanyama, M. A.; Njoroge, E. W., et al. A Comparative Evaluation of Kaplan-Meier, Cox Proportional Hazards, and Random Survival Forests for Neonatal Mortality Prediction. Comput. Biol. Bioinform. 2025, 13(2), 42-59. doi: 10.11648/j.cbb.20251302.11
@article{10.11648/j.cbb.20251302.11,
  author = {Victor Wandera Lumumba and Denis Kariuki Muriithi and Amos Kipkorir Langat and Maureen Ambasa Wanyama and Elizabeth Wambui Njoroge and John Kamwele Mutinda and Olivia Waka and Edson Mwebesa},
  title = {A Comparative Evaluation of Kaplan-Meier, Cox Proportional Hazards, and Random Survival Forests for Neonatal Mortality Prediction
},
  journal = {Computational Biology and Bioinformatics},
  volume = {13},
  number = {2},
  pages = {42-59},
  doi = {10.11648/j.cbb.20251302.11},
  url = {https://doi.org/10.11648/j.cbb.20251302.11},
  eprint = {https://article.sciencepublishinggroup.com/pdf/10.11648.j.cbb.20251302.11},
  abstract = {Neonatal mortality remains a critical public health challenge, particularly in low- and middle-income countries (LMICs), where limited healthcare resources and fragmented follow-up systems hinder timely interventions. Accurate prediction of neonatal death is essential for risk stratification, resource allocation, and improving survival outcomes. While traditional survival analysis methods like the Kaplan-Meier estimator and Cox proportional hazards (Cox PH) model are widely used, they face limitations in handling non-linear relationships, high-dimensional data, and violations of proportional hazards assumptions. Random Survival Forests (RSF), a machine learning approach, offers potential advantages but lacks sufficient comparative evaluation in neonatal mortality prediction, especially within LMIC contexts. This study aimed to comparatively evaluate the performance of Kaplan-Meier, Cox PH, and RSF models in predicting neonatal mortality using a synthetic dataset reflecting perinatal epidemiology in Kenya. The research addresses a significant and direct methodological comparisons across these models in neonatal populations, particularly under real-world conditions involving censoring, missing data, and non-proportional hazards. We assessed discrimination (C-index, time-dependent AUC), calibration (Integrated Brier Score, CRPS), and clinical interpretability. The dataset included 2,000 neonates with 17 covariates including but not limited to gestational age, birth weight, maternal health, and socioeconomic status. Results showed that RSF outperformed both Kaplan-Meier and Cox PH in discrimination (C-index: 0.875 vs. 0.868) and maintained strong calibration, particularly at 28 days. Variable importance measures identified gestational age, birth weight, and maternal health score as top predictors. SHAP values enhanced interpretability of RSF outputs. The Cox model provided clinically intuitive hazard ratios but was less flexible in capturing interactions. The study concluded that RSF offers superior predictive accuracy for neonatal mortality and should be integrated into risk prediction tools, especially in data-rich settings. Policy makers should support adoption of advanced analytics in perinatal care systems, while maintaining traditional models for inferential clarity. Combining both paradigms can optimize neonatal survival strategies.
},
 year = {2025}
}
TY  - JOUR
T1  - A Comparative Evaluation of Kaplan-Meier, Cox Proportional Hazards, and Random Survival Forests for Neonatal Mortality Prediction

AU  - Victor Wandera Lumumba
AU  - Denis Kariuki Muriithi
AU  - Amos Kipkorir Langat
AU  - Maureen Ambasa Wanyama
AU  - Elizabeth Wambui Njoroge
AU  - John Kamwele Mutinda
AU  - Olivia Waka
AU  - Edson Mwebesa
Y1  - 2025/10/27
PY  - 2025
N1  - https://doi.org/10.11648/j.cbb.20251302.11
DO  - 10.11648/j.cbb.20251302.11
T2  - Computational Biology and Bioinformatics
JF  - Computational Biology and Bioinformatics
JO  - Computational Biology and Bioinformatics
SP  - 42
EP  - 59
PB  - Science Publishing Group
SN  - 2330-8281
UR  - https://doi.org/10.11648/j.cbb.20251302.11
AB  - Neonatal mortality remains a critical public health challenge, particularly in low- and middle-income countries (LMICs), where limited healthcare resources and fragmented follow-up systems hinder timely interventions. Accurate prediction of neonatal death is essential for risk stratification, resource allocation, and improving survival outcomes. While traditional survival analysis methods like the Kaplan-Meier estimator and Cox proportional hazards (Cox PH) model are widely used, they face limitations in handling non-linear relationships, high-dimensional data, and violations of proportional hazards assumptions. Random Survival Forests (RSF), a machine learning approach, offers potential advantages but lacks sufficient comparative evaluation in neonatal mortality prediction, especially within LMIC contexts. This study aimed to comparatively evaluate the performance of Kaplan-Meier, Cox PH, and RSF models in predicting neonatal mortality using a synthetic dataset reflecting perinatal epidemiology in Kenya. The research addresses a significant and direct methodological comparisons across these models in neonatal populations, particularly under real-world conditions involving censoring, missing data, and non-proportional hazards. We assessed discrimination (C-index, time-dependent AUC), calibration (Integrated Brier Score, CRPS), and clinical interpretability. The dataset included 2,000 neonates with 17 covariates including but not limited to gestational age, birth weight, maternal health, and socioeconomic status. Results showed that RSF outperformed both Kaplan-Meier and Cox PH in discrimination (C-index: 0.875 vs. 0.868) and maintained strong calibration, particularly at 28 days. Variable importance measures identified gestational age, birth weight, and maternal health score as top predictors. SHAP values enhanced interpretability of RSF outputs. The Cox model provided clinically intuitive hazard ratios but was less flexible in capturing interactions. The study concluded that RSF offers superior predictive accuracy for neonatal mortality and should be integrated into risk prediction tools, especially in data-rich settings. Policy makers should support adoption of advanced analytics in perinatal care systems, while maintaining traditional models for inferential clarity. Combining both paradigms can optimize neonatal survival strategies.

VL  - 13
IS  - 2
ER  -
Department of Physical Sciences, Chuka University, Chuka, Kenya
Department of Physical Sciences, Chuka University, Chuka, Kenya
Department of Statistics and Actuarial Sciences, Jomo Kenyatta University of Agriculture and Technology, Nairobi, Kenya
Department of Public Health, Medwise Solutions Consultancy Limited, Nairobi, Kenya
Department of Physical Sciences, Chuka University, Chuka, Kenya
Department of Statistics and Finance, University of Science and Technology of China, Hefei, China
Department of Physical Sciences, Chuka University, Chuka, Kenya
Department of Mathematics, Physics and Computing, Moi University, Eldoret, Kenya
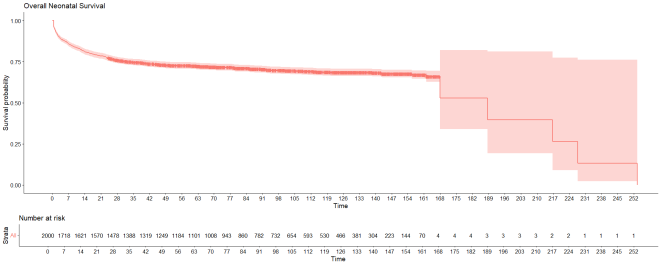
Figure 1. Overall Neonatal Survival Probability.
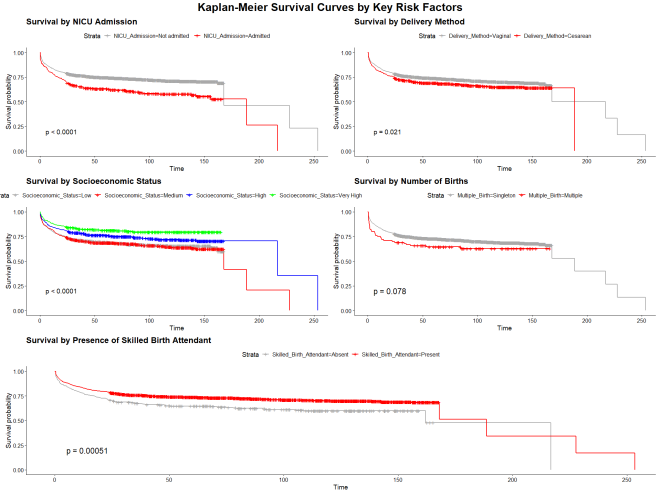
Figure 2. Neonates Survival Probabilities Determined by Various Categorical Predictors.
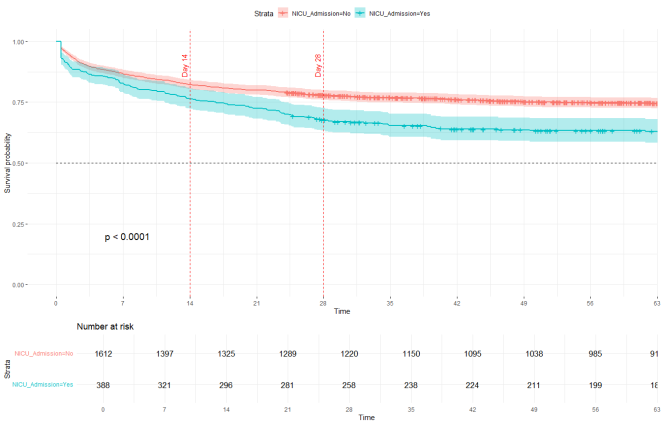
Figure 3. Survival Probabilities for Neonates Between 14 and 28 days of the Study.
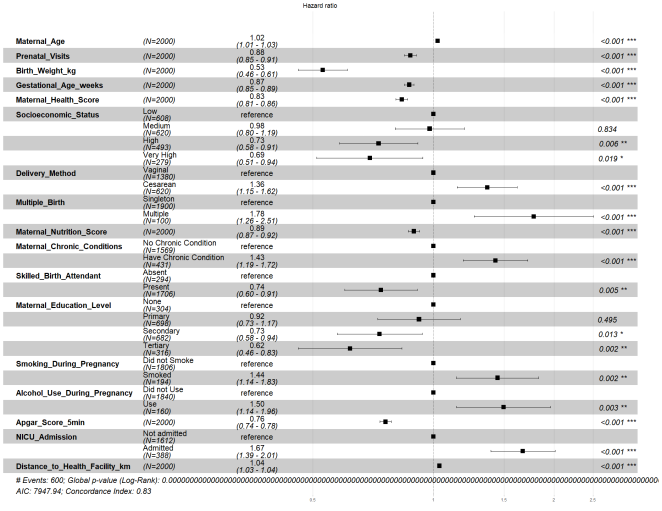
Figure 4. Cox Proportional Hazard Ratios.
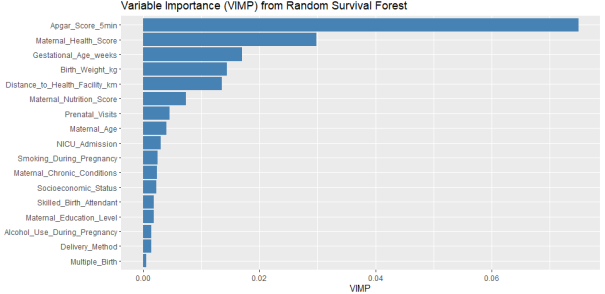
Figure 5. Variables Importance for Random Survival Forest.
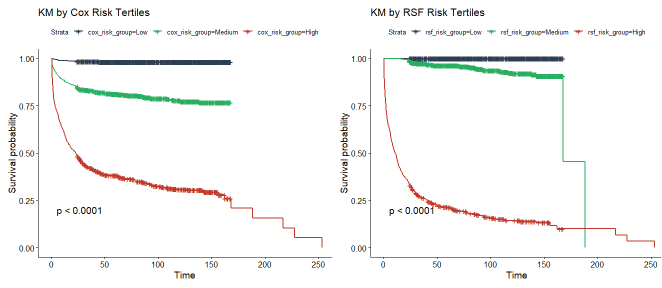
Figure 6. Stratified KM Survival Curves for Cox and RSF.
Information

