Research Article | | Peer-Reviewed

Subsurface Lithostratigraphic Characterization Using Integrated Log and Cross-Plot Analysis: Re-evaluation of a Borehole in Chirirbandar, Dinajpur, Bangladesh

Received: 19 May 2026     Accepted: 15 June 2026     Published: 22 August 2026
Views:       Downloads:
Abstract

This research represents a detailed Litho-stratigraphic characterization of Precambrian basement complex by integrating geophysical log and drilling data of GDH-76 from technical reports of the Geological Survey of Bangladesh (GSB). It is a re-evaluation of a Borehole data by interpreting drilling parameter and interval-averaged geophysical log data. A high-resolution petro-physical “fingerprint” of the Northwestern Bangladesh basement complex is identified by integrated cross-plot analysis. This study delineates a six subsurface zones by correlated Rate of Penetration (ROP), Percentage of Core Recovery, Magnetic Susceptibility, Gamma-Resistivity signatures. The Result shows a distinct 6 meter weathered transition zone (200-206 m) characterized by low core recovery (45%) and moderate ROP (1.02 m/hr). The basement entry at 206 m is marked by moderate to high (0.46 to 1.1 m/hr) in ROP and moderate resistivity (72.5 ohm-m) indicating weathered condition. Notable feature include a 15-meter thick magnetic anomaly zone (295-310 m), identified with a peak susceptibility of 1130 cgs unit, suggesting a mineralization zone. Moreover, a high-gamma unit (318-336 m) exhibiting a value of 375 cps (peak value) with extremely low ROP (0.132 m/hr) indicates a high strength potassium-rich felsic lithology. Furthermore, the research also pinpointed the F39 fault boundary between two boreholes.

Published in Earth Sciences (Volume 15, Issue 4)
DOI 10.11648/j.earth.20261504.14
Page(s) 193-204
Creative Commons

This is an Open Access article, distributed under the terms of the Creative Commons Attribution 4.0 International License (http://creativecommons.org/licenses/by/4.0/), which permits unrestricted use, distribution and reproduction in any medium or format, provided the original work is properly cited.

Copyright

Copyright © The Author(s), 2026. Published by Science Publishing Group

Keywords

Lithostratigraphic Characterization, Cross-plot Analysis, Precambrian Basement Complex, Drilling Parameter, Petro-physical Fingerprint, Gamma-Resistivity Signatures

1. Introduction
The northwestern part of Bangladesh situated at the Precambrian Rangpur saddle which is geologically significant area for its buried mineral resources and complex basement architecture. The Rangpur Platform is a part of the Indian Shield covered by a thin layer of sediments . This platform connecting the Indian Shield to the Shillong Massif in the north. The Dinajpur region sits in this Rangpur Platform, a key tectonic feature marking the eastern continuation of the Indian Shield into the Bengal Basin . The Archaean basement complex of this zone lies at a comparatively shallower depth (shallowest depth 0.12 km at Madhypara . Hence, this area is characterized by a shallow crystalline basement compare to deep, sediment-heavy basin to the south, and over time this zone influenced both the topography and the distribution of mineral resources. Moreover, Geophysical and borehole analysis disclose a complex system of horst and graben structures. The gravity field analysis confirms that the shallow nature of the basement is dominate the tectonic setting of the area along with demonstrate that the crustal thickness here is varies greatly from the deeper parts of the Bengal Basin . In order to understand the subsurface geology and the evolutionary history of these northern basins is crucial for evaluating the region's current structural framework . The subsurface of Northwest Bangladesh is characterized by a series of uplifted blocks. While the general existence of these features has been known since the 1990s, the specific geometry of the Ambari Horst has been recently clarified. Borehole GDH 76 provide critical evidence for the structural limits of this horst, offering a more precise map of the crystalline basement’s elevation in the Dinajpur area .
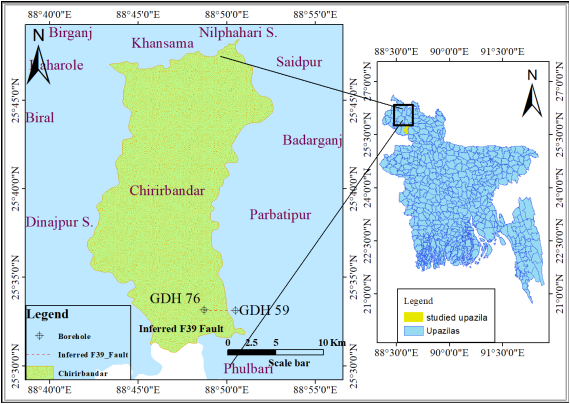
Figure 1. Schematic location map of the study area outlining the concession boundaries and the precise coordinates of drill hole GDH 76.
Borehole GDH 76 (Figure 1) is situated in the Chiribandar, Dinajpur that positioned on this Rangpur Saddle area where basement encounter at 206 m. the GPS location of this hole is latitude 25° 33'18.3"N and longitude 88° 48' 41.9" E. To explore the mineral deposit and understand the basement configuration, different geophysical method are applied here. In the 1980s an Aeromagnetic survey was conducted over Bangladesh including study area where a significant magnetic susceptibility zone was marked and also identify several deep-seated faults, including the F39, which define the boundaries of uplifted blocks . The presence of sharp vertical displacements across adjacent boreholes (for example GDH 59 and GDH 76) aligns with the regional structural framework outlined by , who noted that although Precambrian Platform is geologically Stable, it is locally interrupted by distinct fault-bounded graben basins. In 2001, to confirm the presence of magnetic mineral, GDH-59 was drilled and exploration has highlighted the potential for metallic mineral deposits within the buried crystalline complex . However, in contrast to neighboring boreholes GDH 59, GDH 76 is predominantly consists of non-magnetic Granodiorite, serving as geological benchmark for delineating the boundaries between the host basement and intrusive mafic dykes. Re-evaluating the integrated logs and mechanical data as well as cross-plot analysis of data from this borehole, provided fundamental data of Rangur Saddle’s northern slop, highlighting its specific lithological composition and structural configuration.
Cross plot analysis is an essential multi-proxy technique used to compare diverse datasets such as geophysical logs and mechanical drilling information on a single graph. This method allows us to identify lithological and mechanical facies that are obscured in separate logs . By correlating these datasets, we can identify data clusters which defined specific rock properties and borehole integrity . Hence this integrated approach provides a comprehensive understanding of the subsurface than looking at each data individually . Moreover, identified the major fault boundary, the F39, between two borehole GDH 59 and GDH 76.
While the subsurface characterization of Stable Precambrian Platform of Bangladesh conventionally rely on traditional geophysical logs or physical core samples, there is a distinct lack of research integrating subsurface geophysical properties with real-time drilling parameters. Past research fails to combine geophysical logs (like Gamma and Resistivity) with mechanical data (like ROP and core recovery). This creates a clear gap in using integrated, multi-proxy data to electrofacies indentification and confirm lithostratigraphic boundaries simultaneously. To address this gap, this study combines geophysical logs (Gamma, Resistivity, and Magnetic Susceptibility) with drilling data (ROP and core recovery) on a single graph. By using cross-plots, we establish clear numerical thresholds to identify electrofacies and map hidden faults like the F39 boundary.
2. Objectives
This research aims to integrate different datasets, including geophysical log data and mechanical drilling parameters in order to achieve following things:
1) Utilizing cross-plot analysis for identification of inferred lithology.
2) To identify distinct mineralogical populations within the Precambrian complex.
3) To describe physical nature of the basement using depth-based logging data and drilling parameters.
4) To evaluate the F39 fault boundary by correlating data between two boreholes.
3. Geology Setting
The lithological succession of the northwestern part of Bangladesh is defined by the stratigraphic framework established by Reimann , which characterizes the Precambrian crystalline basement acting as foundation later Permian and Cenozoic strata were deposited.
Referring the geological map of Bangladesh the major tectonic features within Bangladesh are 1) Rangpur platform, 2) Himalayan Foredeep 3) Bogra shelf 4) palaeo continental slope. GDH 76 is located in Chirirbandar Upazila, lies in the Dinajpur district of northwestern Bangladesh. Geologically, the Chirirbandar Upazila of Dinajpur is situated within the stable Rangpur Platform, which represents the northeastern continuation of the Indian Shield in Bangladesh . It is a stable tectonic zone where the crystalline basement is found at depths markedly shallower relative to the southern Bengal Basin . This makes the region geologically distinct from the rest of the subsiding parts of the country. The subsurface of this region consists of Precambrian igneous and metamorphic rocks, such as granite and gneiss. In the surroundings of the Dinajpur region, Permian-Carboniferous Gondwana Group sediments, which contain the country's primary coal deposits, overlie the basement .
The subdivision of the Stable Platform/ Rangpur platform, is characterized by the Permian Gondwana Formation above basement, has considerable economic interest for coal exploration which is overlain by younger units including the Dupi Tila Formation . The depositional history of this overburden from the Pleistocene Barind clays to Holocene alluvium, is further elaborately analysis by Reimann and Hiller in 1993 .
Geophysical investigations, most prefer aeromagnetic surveys in 1981, disclose that the basement configuration in this region is signified by a series of uplifted blocks and faulted troughs . The presence of high-intensity magnetic anomalies in this tectonic zone suggesting a basement composition rich in ferromagnetic minerals, primarily magnetite and ilmenite . These magnetic signatures shows that the crystalline basement is likely composed of granodiorite, gneiss, and diorite, forming the primary foundation for subsequent Permian and Cenozoic deposits.
Chirirbandar's landscape is heavily influenced by the Old Himalayan Piedmont Plain and the Barind Tract, consisting mainly of Tista Alluvium—characterized by dominance of non-calcareous grey floodplain soils .
4. Methodology
The primary data consists of geophysical well log and drilling parameter of GDH 76 collecting from unpublished report geophysical log and drilling data of Geological survey of Bangladesh (GSB). The geophysical well log are Gamma Ray (cps), Magnetic Susceptibility (cgs unit), Electrical Resistivity (ohm-m), and the drilling data are Rate of Penetration (ROP) and percentage of core recovery. Well log are recorded from 200m and extend up to 336m wherein drilling data recorded from 196 m below the surface. Based on geophysical log and drilling parameter, we divided the subsurface into six zones. The Interval boundaries of these zones were defined using a statistically validated geophysical proxy based on magnetic susceptibility log. Despite the lack of a visible "magnetic body" in the core samples, the downhole tool detected a sharp signature. The fact that this magnetic shift perfectly matches simultaneous step-changes in the Gamma, Resistivity, ROP, and Core Recovery logs verifies it as a genuine litho-structural boundary—such as an alteration front or textural change—that cannot be seen with the naked eye. Then we calculate the average value of Gamma Ray (cps), Magnetic Susceptibility (cgs), and Electrical Resistivity (ohm-m) for each interval. This average technique is essential to smooth out the influence of noise and localized borehole irregularities making it easy to create comparison plots and create stabilized dataset for cross-plots. In this depth range, continuous data of drilling parameters (ROP and Percentage core recovery) are taken. Then the average interval data of geophysical log parameter is plotted against drilling data to see how the rock chemical makeup gets affected, how it easily being drilled and recovered. We used cross-plot to find out exact basement rock. For this reason Cross-plot of Gamma ray versus (vs) ROP, Magnetic susceptibility vs ROP, Gamma vs magnetic susceptibility, Resistivity vs Gamma ray, Resistivity vs magnetic susceptibility and ROP vs percentage of core recovery are created based on the data.
By plotting Gamma Ray against Magnetic values and Resistivity, we could see where the data points are find in the map. For instance, zones with low gamma and low magnetism were identified as Felsic (Acidic) rocks, like Granite or Gneiss. This approach provided a scientific basis for ruling out alternative lithology, such as iron-rich rocks, which would have shown much higher magnetic peaks. Or rock with high gamma indicates radioactive minerals.
Due to absence of physical core samples for thin-section or petrographic work, lithologies were classified as petrophysical electrofacies using Gamma, Resistivity, Magnetic Susceptibility, ROP and core recovery log data. Though it is indirect, these classifications follow on established geophysical baselines. For example, high-gamma intervals indicate potassic granite due to potassium-40 enrichment, while highly resistive, low-susceptibility zones point to quartzitic rocks.
Finally, we confirmed the F39 fault boundary by comparing our GDH-76 basement encounter at 206 depth with regional aeromagnetic data from Hunting, 1980. This analysis defines the physical edge of the Ambari Horst and enables us to understand how this fault controls separation of different geological zones in the region.
5. Result and Discussion
5.1. Drilling and Geophysical Log Integration
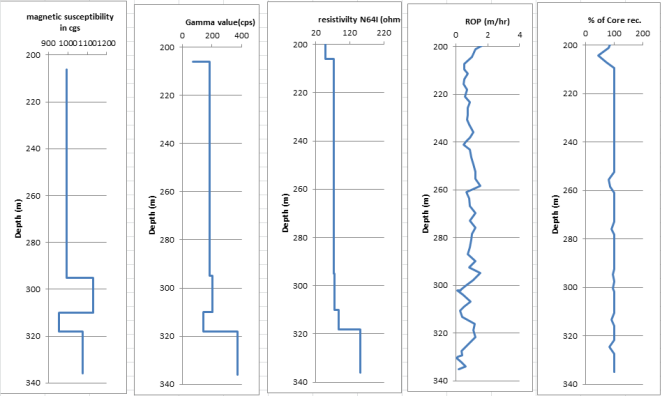
The results presented herein are derived from the re-evaluation of legacy geophysical logs and core/drilling reports for GDH 76 of Geological Survey of Bangladesh. The integrated log—comprising gamma, resistivity, magnetic, ROP and core recovery data—was digitized and correlated to identify inferred Lithological variations. In this study, magnetic susceptibility, Gamma value, and resistivity logs are interval-averaged data and step-plots are created to correlate with continuous drilling data (Figure 2). The integrated analysis of GDH-76 reveals a six subsurface zones in current paper while in the unpublished paper of geophysical log data three distinct layer was described. This refined zoning allows for a more precise delineation of the mineralized intervals within the crystalline basement complex (Table 1).
Figure 2. Composite log of geophysical and drilling parameters from depth 200 to 340 m. This combined dataset was then evaluated to identify shifts in subsurface rock composition (lithology) and establish electrofacies boundaries.
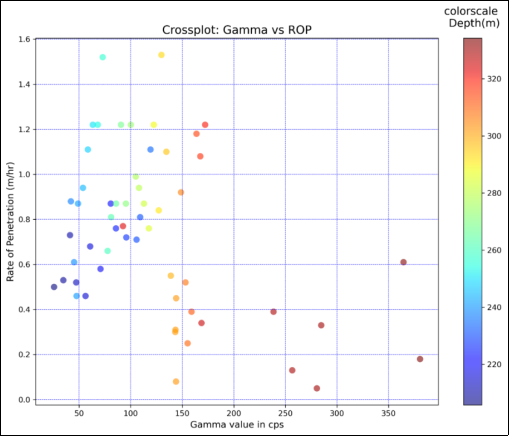
Table 1. Summary of Zone characteristics based on geophysical log and Mechanical Data.

Depth (m)

Magnetic susceptibility (in cgs unit)

Gamma Value (cps)

Resistivity (Ohm-m)

Rate of Penetration (ROP) (m/hr)

Percentage of Core Recovery (%)

Zone classification

0-200

Not recorded

Not recorded

Not recorded

2.03 at 199 m depth

90.13 at 199 m depth

Sedimentary overburden

200-206

Not recorded

Not recorded

Low (average value 47.5)

Moderate (range 0.5-1.02)

Low (45)

Weathered Transition Zone

206-295

Low (average value-992)

Moderate (average value 185)

Moderate (average value 72.5)

Moderate to high (range 0.46-1.1)

High 100 (from 253m to 260 m value is 83.5)

Fractured/weathered felsic crystalline basement

295-310

High (average value -1130)

Moderate (average value - 205

Moderate (average value 75.5)

High to moderate (range 1.18 -0.39)

High (100)

Fresh intermediate basement with magnetic Anomaly Zone

310-318

Very low (average value -955)

low (average value 140)

High (average value 87.5)

Moderate to high (range 0.39-1.18)

High to moderate (range 100-90)

Precambrian Granitic Gneiss Basement

318-336

Moderate (average value 1075)

Very High (peak value -375)

Very High (average value 150)

High to Very low (range 1.22 -0.05)

High to moderate (range 100-84.4)

Mineralized Potassic-Crystalline Complex Basement

5.2. Inferred Lithology (Cross Plot Analysis)
5.2.1. Cross-plot of Gamma Ray Versus Rate of Penetration (ROP)
Figure 3. Cross-plot analysis of Gamma Ray against Rate of Penetration (ROP) relative to depth. The graph illustrates specific shifts in log responses used to distinguish between various subsurface zones.
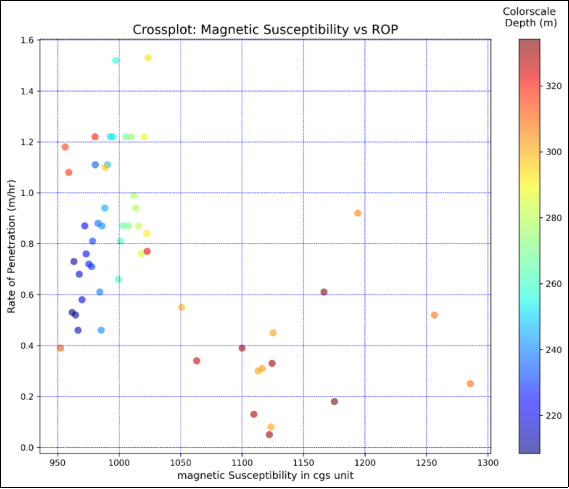
Figure 4. Cross-plot analysis of Magnetic Susceptibility against Rate of Penetration (ROP) along a depth profile. The plot highlights distinct log response changes used to differentiate subsurface zones.
The provided cross-plot (Figure 3) illustrated the relationship between Gamma ray and Rate of penetration (ROP), data are categorized by depth (200m-334m). It showed the inverse relation of gamma ray with ROP. The analysis of this cross-plot reveals several key lithological and petro physical trends that are described below:
Inferred Lithological Zones:
1) Low Gamma Ray zone (<125 cps): The value of gamma ray less than 125 cps are correlated with higher ROP values (upto 1.5 m/hr). Generally, low GR values are indicator of cleaner formation such as sandstones or carbonates, which often display higher drillability.
2) High Gamma Ray zone (>200 cps): A shift toward lower ROP values (mostly <0.4 m/hr) with GR increases is noticed form the cross-plot analysis. This zone with higher radioactivity levels typically represents shale-rich or clay-heavy intervals, which are denser and more resistant to drilling.
Petrophysical Correlation
An inverse relationship between Gamma Ray (GR) and Rate of Penetration (ROP) is a well-established petrophysical signatures, it mainly used to identify lithological changes. In this relationship, high gamma ray reading with low ROP indicate a very distinct transition to compact shale baseline or a highly cemented zone around depth 320 m. While low gamma ray reading with high ROP correspond clean formation like sandstone.
5.2.2. Cross-plot of Magnetic Susceptibility Vs Rate of Penetration (ROP)
The cross-plot (Figure 4) demonstrated the relationship between Magnetic susceptibility and Rate penetration (ROP), data are categorized by depth (200m-334m). It showed the inverse relation of magnetic susceptibility with ROP with depth. This cross-plot analysis reveals several key geological and petrophysical trends:
Inferred Lithological Zones:
1) Low magnetic susceptibility zone (<1025 cgs): A negative correlation is observed between these points with Rate of penetration (ROP) values (up to 1.6 m/hr). From the well log environment, low magnetic susceptibility values suggest a lack of iron-bearing minerals and the formation might be dominated by paramagnetic or diamagnetic minerals. It represents clear sand, quartz, which often shows high drillability.
2) High magnetic susceptibility zone (>1100 cgs): A noticeable shift is observed toward lower ROP values (mostly <0.6 m/hr) as magnetic susceptibility increases. Typically it indicates a transition into harder, more "ferromagnetic" or"mafic" lithologies or a classic indicator of igneous rocks, particularly mafic types like basalt, gabbro, or diabase, which are hard to drill.
Petro physical Correlation
From a reservoir point of view, this is usually a negative indicator: High magnetics value usually point to high clay content or iron-rich impurities that block pore spaces. Besides, the low ROP suggests a very dense, low-porosity "tight" zone that offers high resistance.
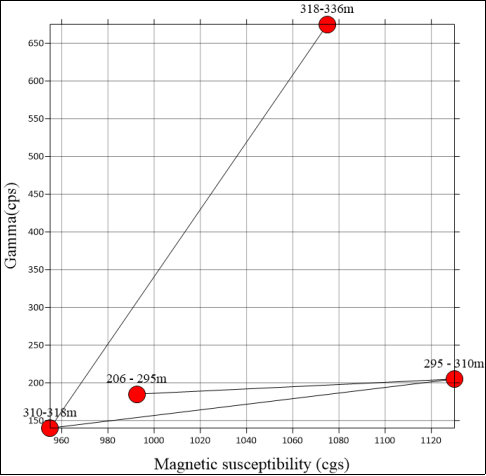
Figure 5. Cross-plot of interval-average value of Magnetic Susceptibility (cgs) versus Gamma Ray (cps) across depth zones. The data points illustrate average log response changes across designated subsurface depth zones.
5.2.3. Cross-plot of Magnetic Susceptibility with Gamma Ray
This cross-plot (Figure 5) highlights the relationship between magnetic susceptibility and gamma-ray data by depth intervals (206-295m, 295-310 m, 310-318m, 318-336m).
1) Zone (206-295m) of low magnetic susceptibility (average 992 in cgs unit) and medium Gamma ray value (average 185 cps): In the bottom left of the plot, the zone is situated. This zone typically indicates a highly characteristic of specific rock types that lack both radioactive isotopes (Potassium, Thorium, and Uranium) and iron-bearing magnetic minerals (like magnetite). The basement rock type may be quartzite. Marble, basalt etc.
2) Zone (295-310m) of high magnetic susceptibility (average 1130 cgs unit) and medium Gamma ray value (average 205 cps): This zone is positioned in the lower-right quadrant of the plot. The layer is interpreted as intermediate igneous or metamorphic rocks (eg. Granodiorite or diorite, gneiss) that found in the basement.
3) Zone (310-318m) of very low magnetic susceptibility (average 955 cgs unit) and low Gamma ray value (average 140 cps): This zone is situated in the southeastern corner of the map. It classified as nearly pure silica or carbonate, lacking both radioactive isotopes and iron-bearing minerals.
4) Zone (318-336m) of high magnetic susceptibility (average 1075 cgs unit) and very high Gamma ray value (peak value 375 cps): This zone occupies the upper-right quadrant of the regional layout. A basement with this value is almost always a Felsic Igneous Rock, a Potassic Granite or a Rhyolitic Basement.
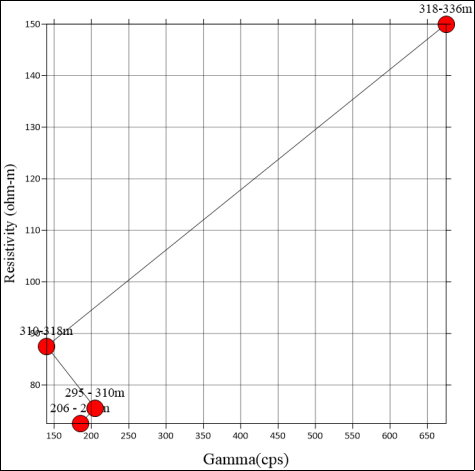
Figure 6. Cross-plot analysis of Gamma Ray against Resistivity relative to depth. This graph illustrates shifts in wireline log signatures, which are utilized to define lithostratigraphic boundaries and categorize electrofacies across studied section.
5.2.4. Cross-plot of Gamma Ray with Resistivity
This cross-plot (Figure 6) highlights the relationship between gamma-ray and Resistivity data by depth intervals (206-295m, 295-310 m, 310-318m, 318-336m).
1) Zone (206-295m) of medium Gamma ray value (average 185 cgs unit) and medium resistivity value (average 72.5 ohm-m): This zone located in the southeast side in the plot. This zone typically indicates a highly characteristic of specific rock types that lack both radioactive isotopes (Potassium, Thorium, and Uranium) and it represents as a Weathered to Fractured Crystalline Basement.
2) Zone (295-310m) of medium Gamma ray (average 205 cgs unit) and medium resistivity value (average 75.5 ohm-m): This zone situated in the bottom left in this diagram. This signature indicates you have crossed the "Weathering Front" and entered the Fresh (Unweathered) Intermediate Basement, such as a Diorite or Granodiorite.
3) Zone (310-318m) of low Gamma ray value (average 140 cgs unit) and high resistivity value (average 87.5 ohm-m): This zone is in the left corner in the map. This signature reveals a sharp lithological change to a Clean, Tight Metamorphic rock, most likely Quartzite or Marble.
4) Zone (318-336m) of very high Gamma ray value (peak value 375 cgs unit) and very high resistivity value (average 150 ohm-m): This zone extents in the top right corner in the illustration. This signature represents the tightest and most radiogenic part of the crystalline basement, typically interpreted as a Fresh Potassic Granite or Felsic Gneiss.
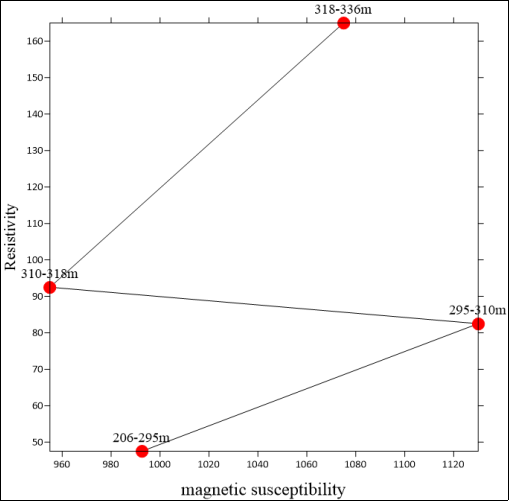
Figure 7. Cross-plot analysis of Magnetic susceptibility (cgs) versus Resistivity (ohm-m) relative to depth.
5.2.5. Cross-plot of Magnetic Susceptibility with Resisitvity
The above cross-plot (Figure 7) illustrates the relationship between Resistivity and Magnetic Susceptibility, categorized by four distinct depth intervals. This analysis reveals a complex geological sequence where mineralogy and fluid content change with depth.
1) Zone (206-295m) of low magnetic susceptibility (average 992 cgs unit) and medium resistivity value (average 72.5 ohm-m): This zone located in the lower left in the plot. This typically represents a fractured porous basement with low concentrations of magnetic minerals.
2) Zone (295-310m) of high magnetic susceptibility (average 1130 cgs unit) and medium resistivity value (average 75.5 ohm-m): These data points map within the right side of the diagram. There is a sharp increase in magnetic susceptibility (peaking at ~1130) with increases of resistivity (~82 ohm-m). This suggests the introduction of heavy magnetic minerals (e.g., magnetite or ilmenite) or iron-rich cements, which would also explain the low ROP previously discussed.
3) Zone (310-318m) of low magnetic susceptibility value (average 955 cgs unit) and high resistivity value (average 87.5 ohm-m): This zone find in the left side in the map. The susceptibility drops back to its lowest level (~955), but resistivity increases. This indicates a "cleaner" lithology with fewer magnetic impurities, though it shows a higher compaction or possibly change in pore fluid chemistry.
4) Zone (318-336m) of high magnetic susceptibility (average 1075 cgs unit) and very high resistivity value (average 150 ohm-m): This zone is in the top right corner in the diagram. The deepest interval shows a dramatic spike in resistivity (~165 ohm-m) paired with a moderate increase in magnetic susceptibility (~1075). This is a classic signature of a a highly dense, non-porous "tight" rock with magnetic mineral.
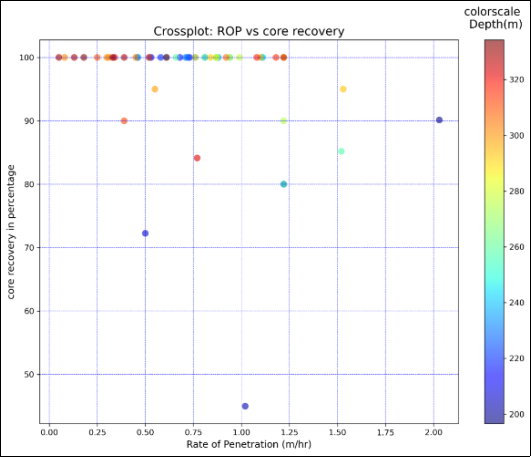
Figure 8. Cross-plot analysis of Rate of Penetration (m/hr) versus Percentage of core recovery, highlighting an inverse relationship between drilling speed and rock competency.

5.2.6. Cross-plot of ROP with Percentage of Core Recovery
The cross-plot of ROP (Rate of Penetration) vs. Core Recovery (Figure 8) indicates the drilling efficiency and quantity of samples retrieved. It indicates the inverse relation of this parameter in this plot and ROP decrease with depth but recovery percentage increases. Low ROP (0.25-0.5 m/hr) with higher core recovery (100%) in the top-left side of the plot indicate a hard and compact rock like granite or granodiorite in basement (depth more than 320 m) and on the other hand, higher ROP (>1.00 m/hr) leads to lower core recovery (<50%) (in the bottom side of plot where depth of subsurface is less than 260m). Due to intense mechanical stress and vibration, fast penetration often causes core failure or washout.
5.3. Lithostratigraphic Characterization
1) Zone 1 (0-200m) (sedimentary overburden): This zone extends from surface to 200 m in depth and lies above Zone 2. The log data was not recorded here as it is soft, unconsolidated layer. It is collectively called as sedimentary cover or overburden.
2) Zone 2 (200-206 m): The interval from 200 to 206 m is identified as a Weathered Transition Zone. The high ROP (1.11 m/hr) and low percentage of core recovery (45%) suggest a mechanically weak, fractured or unconsolidated formation. It represents the highly weathered upper profile of the crystalline basement or the basal contact of the Gondwana sequence. The presence of secondary porosity or moisture within this weathered horizon is supported by the subdued resistivity (47.5 ohm-m).
3) Zone 3 (206-295m): Zone 3 represents the Precambrian hard cap, encountered at 206m. The transition is marked by a sharp reduction in ROP (0.53 m/hr) and a corresponding moderate increase in resistivity, revealing the change from unconsolidated overburden to fractured crystalline basement. The cross-plot of ROP vs. Gamma Ray (Figure 3) shows a tight cluster for this zone, distinguishing the moderately fractured granodiorite 'cap' from the weathered materials above it. The cross-plot analysis of gamma ray vs magnetic susceptibility (Figure 5) and gamma ray versus resistivity (Figure 6) indicates a fractured/weathered felsic crystalline basement which is identified by low magnetic minerals. However, the high core recovery (Table 1) suggests the drilling was steady where the rock mass is not heavily fractured. The moderate resistivity and reduction in ROP from zone 2 recommend a fractured or secondary porosity zone likely weathered profile of Granodiorite rather than a mafic dyke or intrusion.
4) Zone 4 (295-310m): This zone sits beneath the weathered, non-magnetic basement (Zone 3), it indicates a compositional change—likely a mafic intrusion (like a dyke or sill) or a mineralized horizon within the older basement rock. From Cross-Plot Signature (Magnetic vs. Resistivity in Figure 7) see a dramatic jump as both magnetic and resistivity increases from previous zone. Zone 3 points will be at the bottom (low magnetism), and then Zone 4 points will be high on the x -axis (Figure 7). And resistivity value is also increased and become moderate (average 75.5 ohm-m) compared to another zone. The transition at 295m marks a significant geophysical boundary. While the lithology remains crystalline, the magnetic susceptibility spike observed in Zone 4 suggests the presence of magnetite-bearing minerals or traces of magnetic minerals. The high core recovery with steady ROP (Figure 8) within this interval suggest a competent, fresh magnetite-rich crystalline basement. However, a small traces or magnetic mineral veins are found in the GDH 76 borehole. GDH-76 was specifically drilled to define the boundary of the Ambari Horst. As it sits right on a fault line (F39), the reading may be influenced by the magnetic signature from the mineralized block on the other side of the fault while the core itself only contains non-mineralized granodiorite. So, it can know as fresh intermediate basement (granodiorite) with traces of magnetic signature.
5) Zone 5 (310-318 m): This zone interval is recognized as Precambrian Granitic Gneiss layer. The very low Gamma value with high resistivity point out a dense, silica-rich metamorphic unit, however, the 100% core recovery and ROP suggest a massive crystalline structure. In this 310-318m interval depth, it likely moved past the upper granodiorite unit and hit a more Silica-rich or Metamorphic layer.
6) Zone 6 (318-336m): The lower most zone between 318 and 336 m of GDH 76/21 (zone VI) indicates a unique petro-physical signature marked by massive spike in Gamma radiation (average-375 cps) and a reduction in the Rate of Penetration (ROP) (from 1.22m/hr to 0.05 m/hr). Usually, a high gamma signature represents soft clay-rich sedimentary layers, when this Gamma value combined with a very slow ROP, suggesting the rock transformed from a basic/intermediate rock (like Granodiorite) to a very hard, radioactive-rich felsic rock (like a Potassic Granite or Gneiss). Moreover, from the cross-plot Gamma vs ROP (Figure 3), it proved that the cluster at the bottom right side has high gamma value with low ROP zone. However, the zone has high magnetic value with high resistivity identifies as Mineralized Potassic-Crystalline Complex.
5.4. Structural Mapping (Fault Correlation)
The F39 fault is a major structural feature first identified by Hunting Geology and Geophysics Ltd. during their 1981 aeromagnetic survey. These f39 fault boundary is identified in this study through spatial correlation and lithological truncation.
First, increase of basement depth from 149 m in GDH-59 to 206 m in GDH-76 indicates a significant vertical displacement of the Ambari Horst.
Second, the updated regional map (Figure 1) provides evidence for the F39 fault boundary. It is shown from the map that the two drill holes GDH-59 and GDH-76 are located in close proximity. While the lateral distance between the boreholes is minimal, their basement contacts presents a significant vertical offset. This spatial relationship strongly indicates that a structural discontinuity, interpreted here as the F39 fault plane, confirms that the fault plane passes directly between these two borehole locations.
Third, the complete absence of high-magnetic susceptibility in GDH-76 at 208 meter (average 992.5 in cgs unit) relative to massive magnetic deposits in GDH-59 suggest that this fault act as structural barrier and truncate this mineralized zone.
Finally, the low to moderate resistivity recorded at 206 meters proved the physical evidence of a fractured damage zone.
6. Conclusion
This research provides a comprehensive litho-stratigraphic feature of GDH 76 that obtained by integrated analysis of geophysical logs and drilling parameters. It is a re-evaluation of this borehole data collected from GSB and the geophysical log data are interval averaged data wherein mechanical data are continuous data.
The Cross-plot of ROP vs percentage of core recovery suggests that the zone 2 (200-206 m) can be weathered transition zone the next zone 3 (206-295 m) identified as a fractured / weathered felsic crystalline basement with low magnetic content. Zone 4 (295-310m) represents as fresh intermediate basement (granodiorite) that witnesses a dramatic jump as both magnetic and resistivity value increases from zone 3. The next zone 5 (310-318 m) is delineated as Precambrian Granitic gneiss layer because it has very low gamma value (140 cps as average value) with high resistivity and moderate to high ROP (0.39 to 1.18 m/hr) suggesting a massive, fresh crystalline structures. The zone 6 (318- 336m) is classified as mineralized potassic-crystalline basement as this Gamna value is is 375 cps as average value represent radioactive mineral in zone.
Comparing drilling data (ROP) with Gamma ray and Resistivity are effective for describing physical nature of the rock and it show s with depth ROP along with Gamma ray and resistivity become high identifying zone of high hardness (zone 4, 5, 6) versus fractured zones (zone 2, 3). The combined results successfully mapped the F39 fault, shows the clear lithological shifts occurring between the borehole locations.
Overall, this integrated approach decreases the uncertainty of mapping subsurface. It shows that drilling data is as valuable as traditional data for litho-stratigraphic characterization.
Abbreviations

GSB

Geological Survey of Bangladesh

ROP

Rate of Penetration

Vs

Versus

Author Contributions
Nazmun Nahar: Conceptualization, Data Curation, Formal Analysis, Investigation, Methodology, Resources, Visualization, Writing – original draft
Mst Sirajum Monira: Conceptualization, Investigation, Validation, Visualization, Writing – original draft, Writing – review & editing
Md. Selim Reza: Project Administration, Resources, Supervision
Mohammad Zohir Uddin: Project Administration, Resources, Supervision
Sultana Nasrin Nury: Formal Analysis, Resources, Project Administration, Writing – review & editing
Mohammad Ferozur Rahaman: Writing – original draft, Supervision, Writing – review & editing
Conflicts of Interest
The authors declare that they have no known competing financial interests or personal relationships that could have appeared to influence the work reported in this paper.
References
[1] Alam, M., et al., 2003. An overview of the sedimentary geology of the Bengal Basin in relation to the regional tectonic setting. Journal of Asian Earth Sciences, 21(9), 1035-1047.
[2] Alam, M. K., Hasan, A. K. M. S., Khan, M. R., Whitney, J. W., 1990. Geological map of Bangladesh, GSB publication, Dhaka.
[3] Bakr, M. A., and others., 1996. Geology and Coal Deposit of Barapukuria Basin, Dinajpur District, Bangladesh, Geological Survey of Bangladesh Records, vol-8, part-1.
[4] Brammer, H, 1996. The Geography of the Soils of Bangladesh. University Press Limited, Dhaka.
[5] Burke, J. A., Campbell, R. L., & Schmidt, A. W., 1969. The Litho-Porosity Crossplot: A New Concept for Determining Porosity and Lithology in Complex Formations. The Log Analyst, 10(06). 2, Open Journal of Geology, Vol. 6 No. 8, August 17, 2016.
[6] Fertl, W. H., 1981. Openhole Crossplot Concepts: A Powerful Technique in Well Log Analysis. Journal of Petroleum Technology, 33(03), 535-549,
[7] Hunting 1981 Interpretation and operations reports of an aeromagnetic survey of Bangladesh, Hunting geology and Geophysics ltd. Boreharmwood, Hertfordshire, England, 43p.
[8] Imam, B., 2013. Energy Resources of Bangladesh: Natural Gas, Oil, Coal (2nd ed.). University Grants Commission of Bangladesh.
[9] Islam, M. S., & Alam, M. J., 2014. Geological Aspects of Soil Formation of Bangladesh. Proceedings of the 2nd International Conference on Advances in Civil Engineering (ICACE), CUET, Chittagong, Bangladesh.
[10] Khan, A. A., & Rahman, T., 1992. An analysis of the gravity field and tectonic evaluation of the northwestern part of Bangladesh. Tectonophysics, 206(3-4), 351-364,
[11] Khan, F. H., 1991. Geology of Bangladesh. University Press Limited, Dhaka.
[12] Masum, M., Hoque, M. N., Akbar, M. A., Mahmud, Z., Rana, M. S., Razzaque, M. A., & Al Amin, M., 2021. Geology and Precambrian Banded Iron Formation formed at Rangpur Platform in Bangladesh. International Journal of Engineering Research and Development, 17(3), pp. 43-57.
[13] Rahman, M. A., & Khan, M. A. R., 1994. Subsurface geology of the Madhyapara area, Dinajpur district, Bangladesh. Journal of the Geological Society of Bangladesh, Vol. 13, pp. 27-36.
[14] Rahman, M. S., Hossain, M. S., & Khan, A. A., 2014. Interpretation of Magnetic Anomalies over the Precambrian Basement in Northwestern Bangladesh. Journal of the Geological Society of India, 84(2), 205-214.
[15] Rana, M. M., Islam, M. M., Islam, Md, M., Khan, M. N. H., Elahi, M. A., and Rokonuzzaman, Md., 2022 Keshabpur Drilling Program (GDH-76/21) Chirirbandar, Dinajpur GSB Unpublished report, GSB/DATA/UR-915,
[16] Reimann, K.-U., & Hiller, K. (1993). Geology of Bangladesh. Beiträge zur regionalen Geologie der Erde, Vol. 20. Gebrüder Borntraeger, Stuttgart, 160 pp.
[17] Reza, M. S. Uddin, M. Z. and Nury, S. N., 2024. Interpretation of Geophysical logs of the Borehole GDH-76 in Chirirbandar Upazila of Dinajpur District, Bangladesh, GSB Unpublished report, GSB/DATA/UR-940.
[18] Shahjanan, Md., Uddin, M. Z., and Nahar, N., 2024. Gravity Signatures of Kutubpur Magnetic Body and adjoining areas, Parbatipur and Chiribandar Upazilas, Dinajpur District, Bangladesh. Proceedings of the 2nd National Seminar on Geology for the Sustainable Development of Bangladesh, GSB, Dhaka, pp. 291-299.
[19] Zoback, M. D. (2010). Reservoir Geomechanics. Cambridge University Press.
Cite This Article
  • APA Style

    Nahar, N., Monira, M. S., Reza, M. S., Uddin, M. Z., Nury, S. N., et al. (2026). Subsurface Lithostratigraphic Characterization Using Integrated Log and Cross-Plot Analysis: Re-evaluation of a Borehole in Chirirbandar, Dinajpur, Bangladesh. Earth Sciences, 15(4), 193-204. https://doi.org/10.11648/j.earth.20261504.14

    Copy | Download

    ACS Style

    Nahar, N.; Monira, M. S.; Reza, M. S.; Uddin, M. Z.; Nury, S. N., et al. Subsurface Lithostratigraphic Characterization Using Integrated Log and Cross-Plot Analysis: Re-evaluation of a Borehole in Chirirbandar, Dinajpur, Bangladesh. Earth Sci. 2026, 15(4), 193-204. doi: 10.11648/j.earth.20261504.14

    Copy | Download

    AMA Style

    Nahar N, Monira MS, Reza MS, Uddin MZ, Nury SN, et al. Subsurface Lithostratigraphic Characterization Using Integrated Log and Cross-Plot Analysis: Re-evaluation of a Borehole in Chirirbandar, Dinajpur, Bangladesh. Earth Sci. 2026;15(4):193-204. doi: 10.11648/j.earth.20261504.14

    Copy | Download

  • @article{10.11648/j.earth.20261504.14,
      author = {Nazmun Nahar and Mst Sirajum Monira and Md. Selim Reza and Mohammad Zohir Uddin and Sultana Nasrin Nury and Mohammad Ferozur Rahaman},
      title = {Subsurface Lithostratigraphic Characterization Using Integrated Log and Cross-Plot Analysis: Re-evaluation of a Borehole in Chirirbandar, Dinajpur, Bangladesh},
      journal = {Earth Sciences},
      volume = {15},
      number = {4},
      pages = {193-204},
      doi = {10.11648/j.earth.20261504.14},
      url = {https://doi.org/10.11648/j.earth.20261504.14},
      eprint = {https://article.sciencepublishinggroup.com/pdf/10.11648.j.earth.20261504.14},
      abstract = {This research represents a detailed Litho-stratigraphic characterization of Precambrian basement complex by integrating geophysical log and drilling data of GDH-76 from technical reports of the Geological Survey of Bangladesh (GSB). It is a re-evaluation of a Borehole data by interpreting drilling parameter and interval-averaged geophysical log data. A high-resolution petro-physical “fingerprint” of the Northwestern Bangladesh basement complex is identified by integrated cross-plot analysis. This study delineates a six subsurface zones by correlated Rate of Penetration (ROP), Percentage of Core Recovery, Magnetic Susceptibility, Gamma-Resistivity signatures. The Result shows a distinct 6 meter weathered transition zone (200-206 m) characterized by low core recovery (45%) and moderate ROP (1.02 m/hr). The basement entry at 206 m is marked by moderate to high (0.46 to 1.1 m/hr) in ROP and moderate resistivity (72.5 ohm-m) indicating weathered condition. Notable feature include a 15-meter thick magnetic anomaly zone (295-310 m), identified with a peak susceptibility of 1130 cgs unit, suggesting a mineralization zone. Moreover, a high-gamma unit (318-336 m) exhibiting a value of 375 cps (peak value) with extremely low ROP (0.132 m/hr) indicates a high strength potassium-rich felsic lithology. Furthermore, the research also pinpointed the F39 fault boundary between two boreholes.},
     year = {2026}
    }
    

    Copy | Download

  • TY  - JOUR
    T1  - Subsurface Lithostratigraphic Characterization Using Integrated Log and Cross-Plot Analysis: Re-evaluation of a Borehole in Chirirbandar, Dinajpur, Bangladesh
    AU  - Nazmun Nahar
    AU  - Mst Sirajum Monira
    AU  - Md. Selim Reza
    AU  - Mohammad Zohir Uddin
    AU  - Sultana Nasrin Nury
    AU  - Mohammad Ferozur Rahaman
    Y1  - 2026/08/22
    PY  - 2026
    N1  - https://doi.org/10.11648/j.earth.20261504.14
    DO  - 10.11648/j.earth.20261504.14
    T2  - Earth Sciences
    JF  - Earth Sciences
    JO  - Earth Sciences
    SP  - 193
    EP  - 204
    PB  - Science Publishing Group
    SN  - 2328-5982
    UR  - https://doi.org/10.11648/j.earth.20261504.14
    AB  - This research represents a detailed Litho-stratigraphic characterization of Precambrian basement complex by integrating geophysical log and drilling data of GDH-76 from technical reports of the Geological Survey of Bangladesh (GSB). It is a re-evaluation of a Borehole data by interpreting drilling parameter and interval-averaged geophysical log data. A high-resolution petro-physical “fingerprint” of the Northwestern Bangladesh basement complex is identified by integrated cross-plot analysis. This study delineates a six subsurface zones by correlated Rate of Penetration (ROP), Percentage of Core Recovery, Magnetic Susceptibility, Gamma-Resistivity signatures. The Result shows a distinct 6 meter weathered transition zone (200-206 m) characterized by low core recovery (45%) and moderate ROP (1.02 m/hr). The basement entry at 206 m is marked by moderate to high (0.46 to 1.1 m/hr) in ROP and moderate resistivity (72.5 ohm-m) indicating weathered condition. Notable feature include a 15-meter thick magnetic anomaly zone (295-310 m), identified with a peak susceptibility of 1130 cgs unit, suggesting a mineralization zone. Moreover, a high-gamma unit (318-336 m) exhibiting a value of 375 cps (peak value) with extremely low ROP (0.132 m/hr) indicates a high strength potassium-rich felsic lithology. Furthermore, the research also pinpointed the F39 fault boundary between two boreholes.
    VL  - 15
    IS  - 4
    ER  - 

    Copy | Download

Author Information
  • Geophysics Branch, Geological Survey of Bangladesh, Dhaka, Bangladesh

  • Geophysics Branch, Geological Survey of Bangladesh, Dhaka, Bangladesh

  • Geophysics Branch, Geological Survey of Bangladesh, Dhaka, Bangladesh

  • Geophysics Branch, Geological Survey of Bangladesh, Dhaka, Bangladesh

  • Geophysics Branch, Geological Survey of Bangladesh, Dhaka, Bangladesh

  • Departmen of Resilience and Risk Management, Palli Karma-Sahayak Foundation (PKSF), Dhaka, Bangladesh