Understanding rainfall characteristic is very important for aviation operational planning and for other activities. This study investigated annual, seasonal and monthly rainfall climatology and variability in Ethiopian Active airports from 1991-1994 using time series Climate Hazards Group Infrared Precipitation with Stations (CHIRPS) rainfall datasets. Long year mean, standard deviation and coefficient of variations were used to analyze Annual, Monthly and seasonal rainfall climatology and variability spatially and on active airports as a point. Western and southwestern airports such as Jimma, Asosa, Bahir Dar, and Gambella exhibit the highest annual mean rainfall, consistently exceeding 1,200mm, while eastern and northeastern Airports like Gode and Semera, experience very low annual totals (often below 300mm. For instance, Jimma airport records monthly averages exceeding 200mm in peak months, while Airports like Axum, Humera, and Gode receive less than 1mm in dry months. The Kiremt season contributes the bulk of annual rainfall in most parts of the country, for instance Nekemte Airport (1324.5mm), Bahir Dar airport (1147.4mm), and Jimma airport (881.0mm) leading as high climatological mean rainfall. Belg (February-May) and Bega (October-January) are secondary rainfall seasons and dry seasons respectively but are significant in southern and southwestern parts of the country such as Jinka and Arba Minch. More than 80% of airports fall under low annual rainfall variability (CV < 20%), indicating high reliability for long-term aviation planning. Only Gode airport shows high annual rainfall variability (CV = 41%), indicating operational unpredictability and risk exposure. CV values during dry months often exceed 200%, particularly in arid and semi-arid regions, indicating unreliable rainfall patterns. In contrast, wet months (July-August) in western airports exhibit low CVs (e.g., Bahir Dar: 11.8% in August), supporting predictable seasonal operations. Generally climatological and variability insights highlight the spatial and temporal heterogeneity of rainfall across Ethiopian airports, driven by topography, regional climate systems, and global drivers like ENSO. Understanding both average conditions (climatology) and year-to-year fluctuations (variability) is critical for aviation safety, infrastructure resilience, and operational efficiency.
| Published in | International Journal of Atmospheric and Oceanic Sciences (Volume 9, Issue 2) |
| DOI | 10.11648/j.ijaos.20250902.14 |
| Page(s) | 112-125 |
| Creative Commons |
This is an Open Access article, distributed under the terms of the Creative Commons Attribution 4.0 International License (http://creativecommons.org/licenses/by/4.0/), which permits unrestricted use, distribution and reproduction in any medium or format, provided the original work is properly cited. |
| Copyright |
Copyright © The Author(s), 2025. Published by Science Publishing Group |
Rainfall, Climatology, Variability, CDT
No | Airport | Lat | Lon | ICAO Code | No | Airport | Lat | Lon | ICAO Code |
|---|---|---|---|---|---|---|---|---|---|
1 | Axum | 14.144 | 38.775 | HAAX | 13 | Gode | 5.934 | 43.576 | HAGO |
2 | Arba Minch | 6.039 | 37.590 | HAAM | 14 | Gondar | 12.521 | 38.500 | HAGN |
3 | Asosa | 10.023 | 34.578 | HASO | 15 | Debrezeit | 8.716 | 39.008 | HAHM |
4 | Awassa | 7.067 | 38.500 | HALA | 16 | Humera | 13.836 | 36.881 | HAHU |
5 | Bahir Dar | 11.606 | 37.317 | HABD | 17 | Jigjiga | 9.332 | 42.908 | HAJJ |
6 | Bale Goba | 7.120 | 40.069 | HAGB | 18 | Jimma | 7.665 | 36.817 | HAJM |
7 | Addis Ababa | 8.977 | 38.800 | HAAB | 19 | Jinka/Baco | 5.784 | 36.562 | HABC |
8 | Dessie | 11.083 | 39.714 | HADC | 20 | Lalibela | 11.975 | 38.981 | HALA |
9 | Dire Dawa | 9.623 | 41.854 | HADR | 21 | Mekele | 13.467 | 39.517 | HAMK |
10 | Dembidolo | 8.550 | 34.850 | HADO | 22 | Semera | 11.789 | 40.990 | HASM |
11 | Gambella | 8.132 | 34.565 | HAGM | 23 | Nekemte | 9.030 | 36.359 | HANK |
12 | Gore | 8.16 | 35.55 | HAGR | 24 | Shire | 8.16 | 40.433 | HASH |
Name | Statistics | Description | Range | Perfect Score |
|---|---|---|---|---|
CORR | 0.974 | Correlation | -1 to 1 | 1 |
BIAS | 1.021 | Bias | 0 to | 1 |
PBIAS | 2.093 | Percent Bias | - | 0 |
MAE | 11.269 | Mean Absolute Error | 0 to | 0 |
RMSE | 16.578 | Root Mean Square Error | 0 | |
NSE | 0.948 | Nash-Sutcliffe Efficiency | 1 |
Station | Mean | Std | Cv | Station | Mean | Std | Cv |
|---|---|---|---|---|---|---|---|
Axum | 792 | 83 | 11 | Gondar | 846 | 98 | 12 |
ArbaMinch | 870 | 112 | 13 | Debrezeit | 920 | 144 | 16 |
Asosa | 1202 | 87 | 7 | Humera | 1058 | 139 | 13 |
Awassa | 991 | 116 | 12 | Jigjiga | 543 | 95 | 18 |
BahirDar | 1388 | 129 | 9 | Jimma | 1562 | 165 | 11 |
BaleGoba | 947 | 108 | 11 | Jinka | 1283 | 185 | 14 |
AddisAbaba | 1273 | 163 | 13 | Lalibela | 823 | 103 | 12 |
Dessie | 1018 | 134 | 13 | Mekele | 662 | 120 | 18 |
DireDawa | 576 | 115 | 20 | Semera | 206 | 46 | 22 |
Dembidolo | 1347 | 109 | 8 | Shire | 905 | 87 | 10 |
Gambella | 1193 | 110 | 9 | Nekemte | 1953 | 189 | 10 |
Gode | 278 | 115 | 41 |
Aerodrome | Statistics | Jan | Feb | Mar | Apr | May | Jun | Jul | Aug | Sep | Oct | Nov | Dec |
|---|---|---|---|---|---|---|---|---|---|---|---|---|---|
Axum | Mean (mm) | 0.0 | 0.1 | 14.4 | 34.6 | 40.4 | 98.6 | 222.4 | 248.9 | 91.5 | 33.4 | 7.2 | 0.1 |
Std (mm) | 0.1 | 0.4 | 8.4 | 17.3 | 23.7 | 35.4 | 43.2 | 44.1 | 35.4 | 20.3 | 6.5 | 0.3 | |
CV (%) | 600.0 | 354.5 | 58.3 | 50.1 | 58.6 | 35.9 | 19.4 | 17.7 | 38.7 | 60.6 | 90.3 | 377.8 | |
ArbaMinch | Mean (mm) | 28.8 | 25.7 | 64.5 | 153.6 | 137.2 | 60.9 | 47.0 | 54.7 | 81.7 | 119.6 | 61.0 | 35.0 |
Std (mm) | 15.2 | 15.1 | 26.2 | 49.6 | 45.0 | 20.2 | 17.2 | 18.4 | 32.4 | 33.9 | 36.0 | 23.9 | |
CV (%) | 52.6 | 58.8 | 40.6 | 32.3 | 32.8 | 33.1 | 36.6 | 33.7 | 39.7 | 28.4 | 59.1 | 68.3 | |
Asosa | Mean (mm) | 0.1 | 0.1 | 20.4 | 43.9 | 134.1 | 213.0 | 221.3 | 236.2 | 198.1 | 112.8 | 21.9 | 0.5 |
Std (mm) | 0.3 | 0.4 | 9.7 | 21.4 | 38.1 | 35.3 | 43.2 | 40.7 | 28.9 | 25.6 | 15.2 | 1.2 | |
CV (%) | 261.5 | 583.3 | 47.6 | 48.8 | 28.4 | 16.6 | 19.5 | 17.2 | 14.6 | 22.7 | 69.1 | 252.2 | |
Awassa | Mean (mm) | 28.7 | 34.3 | 76.1 | 115.9 | 123.9 | 103.0 | 125.9 | 126.5 | 117.5 | 89.5 | 30.5 | 19.3 |
Std (mm) | 16.7 | 21.6 | 30.8 | 42.1 | 33.9 | 19.2 | 29.9 | 23.2 | 21.7 | 41.7 | 19.3 | 14.1 | |
CV (%) | 58.3 | 62.9 | 40.5 | 36.3 | 27.4 | 18.6 | 23.8 | 18.3 | 18.4 | 46.6 | 63.1 | 73.3 | |
BahirDar | Mean (mm) | 0.5 | 0.3 | 5.3 | 26.0 | 92.7 | 196.3 | 420.3 | 333.6 | 197.2 | 95.3 | 19.5 | 1.3 |
Std (mm) | 1.4 | 1.3 | 5.1 | 13.5 | 46.1 | 46.0 | 57.9 | 39.4 | 38.2 | 44.3 | 9.7 | 2.3 | |
CV (%) | 287.8 | 422.6 | 95.7 | 51.9 | 49.8 | 23.4 | 13.8 | 11.8 | 19.4 | 46.5 | 49.5 | 174.6 | |
BaleGoba | Mean (mm) | 15.9 | 20.3 | 69.9 | 146.6 | 97.5 | 61.9 | 93.3 | 133.7 | 135.3 | 112.4 | 45.1 | 15.6 |
Std (mm) | 12.1 | 17.6 | 39.8 | 45.4 | 27.2 | 25.0 | 32.4 | 38.4 | 32.1 | 47.2 | 25.9 | 10.5 | |
CV (%) | 76.2 | 86.5 | 56.9 | 31.0 | 27.9 | 40.4 | 34.7 | 28.7 | 23.7 | 42.0 | 57.4 | 66.9 | |
AddisAbaba | Mean (mm) | 20.2 | 34.0 | 78.2 | 95.7 | 92.1 | 155.6 | 272.4 | 286.0 | 149.5 | 63.0 | 14.0 | 11.9 |
Std (mm) | 13.4 | 27.4 | 46.6 | 42.0 | 51.7 | 43.8 | 48.7 | 42.1 | 49.9 | 40.4 | 10.6 | 8.0 | |
CV (%) | 66.3 | 80.6 | 59.6 | 43.9 | 56.1 | 28.2 | 17.9 | 14.7 | 33.3 | 64.1 | 75.3 | 67.2 | |
Dessie | Mean (mm) | 22.9 | 26.6 | 70.0 | 93.9 | 61.0 | 23.7 | 259.2 | 280.8 | 103.3 | 42.6 | 18.9 | 15.6 |
Std (mm) | 14.1 | 15.8 | 40.5 | 45.8 | 40.7 | 13.1 | 79.9 | 63.2 | 33.8 | 32.0 | 14.7 | 9.5 | |
CV (%) | 61.6 | 59.4 | 57.8 | 48.8 | 66.8 | 55.3 | 30.8 | 22.5 | 32.7 | 75.2 | 77.5 | 60.6 | |
DireDawa | Mean (mm) | 16.5 | 15.9 | 77.0 | 100.2 | 42.4 | 16.0 | 84.1 | 110.2 | 65.5 | 31.3 | 12.7 | 3.7 |
Std (mm) | 13.8 | 14.7 | 61.8 | 52.2 | 19.2 | 8.6 | 28.8 | 22.1 | 25.2 | 24.6 | 9.5 | 5.3 | |
CV (%) | 83.4 | 92.3 | 80.3 | 52.1 | 45.4 | 53.5 | 34.2 | 20.0 | 38.5 | 78.6 | 74.3 | 142.7 | |
Dembidolo | Mean (mm) | 7.4 | 18.9 | 58.7 | 123.1 | 216.5 | 198.2 | 190.2 | 169.8 | 195.3 | 110.6 | 40.7 | 18.0 |
Std (mm) | 5.4 | 8.8 | 31.3 | 43.5 | 57.4 | 34.8 | 28.0 | 23.1 | 32.8 | 22.9 | 22.9 | 10.2 | |
CV (%) | 72.5 | 46.5 | 53.4 | 35.4 | 26.5 | 17.6 | 14.7 | 13.6 | 16.8 | 20.7 | 56.1 | 56.8 | |
Gambella | Mean (mm) | 3.2 | 6.6 | 28.8 | 70.3 | 165.5 | 155.9 | 211.7 | 211.0 | 141.7 | 126.1 | 58.8 | 12.9 |
Std (mm) | 3.6 | 4.7 | 14.9 | 26.1 | 35.7 | 29.5 | 32.5 | 45.7 | 24.3 | 29.8 | 39.5 | 8.6 | |
CV (%) | 112.3 | 72.1 | 51.8 | 37.1 | 21.5 | 18.9 | 15.3 | 21.6 | 17.2 | 23.7 | 67.2 | 66.4 | |
Gode | Mean (mm) | 0.0 | 0.6 | 7.3 | 88.4 | 46.7 | 0.3 | 0.1 | 0.2 | 2.4 | 80.9 | 50.7 | 0.3 |
Std (mm) | 0.1 | 1.2 | 12.4 | 43.8 | 24.1 | 1.5 | 0.4 | 0.8 | 3.0 | 49.1 | 60.7 | 1.3 | |
CV (%) | 700.0 | 201.7 | 170.5 | 49.5 | 51.6 | 531.0 | 433.3 | 394.7 | 129.4 | 60.7 | 119.8 | 431.0 | |
Gondar | Mean (mm) | 9.5 | 11.0 | 23.4 | 49.1 | 45.2 | 72.6 | 256.1 | 293.3 | 37.9 | 23.0 | 18.0 | 7.0 |
Std (mm) | 4.7 | 5.4 | 9.7 | 19.6 | 21.6 | 28.6 | 63.7 | 61.3 | 14.2 | 15.5 | 11.4 | 5.1 | |
CV (%) | 50.1 | 49.4 | 41.2 | 39.8 | 47.7 | 39.4 | 24.9 | 20.9 | 37.5 | 67.5 | 63.2 | 72.7 | |
Debrezeit | Mean (mm) | 5.3 | 21.9 | 51.6 | 62.2 | 75.5 | 118.6 | 219.3 | 244.6 | 100.6 | 16.1 | 3.5 | 1.1 |
Std (mm) | 7.6 | 19.7 | 32.7 | 32.6 | 46.2 | 36.6 | 49.9 | 50.3 | 34.9 | 15.9 | 5.4 | 2.7 | |
CV (%) | 143.9 | 89.8 | 63.3 | 52.3 | 61.2 | 30.8 | 22.7 | 20.6 | 34.7 | 98.7 | 156.5 | 261.0 | |
Humera | Mean (mm) | 0.1 | 0.1 | 0.5 | 17.7 | 59.9 | 166.1 | 260.7 | 317.6 | 187.5 | 44.7 | 3.1 | 0.0 |
Std (mm) | 0.3 | 0.2 | 1.4 | 11.5 | 25.2 | 46.0 | 48.4 | 51.3 | 50.5 | 26.2 | 3.8 | 0.1 | |
CV (%) | 400.0 | 300.0 | 266.7 | 64.8 | 42.1 | 27.7 | 18.6 | 16.2 | 26.9 | 58.6 | 124.2 | 433.3 | |
Jigjiga | Mean (mm) | 1.9 | 5.1 | 49.1 | 79.1 | 78.2 | 38.7 | 56.8 | 89.0 | 89.1 | 38.7 | 16.5 | 0.9 |
Std (mm) | 3.6 | 9.6 | 42.2 | 31.4 | 31.5 | 17.5 | 22.9 | 27.4 | 31.1 | 31.4 | 15.5 | 2.6 | |
CV (%) | 190.0 | 188.1 | 85.9 | 39.7 | 40.3 | 45.2 | 40.3 | 30.8 | 34.9 | 81.1 | 93.9 | 281.3 | |
Jimma | Mean (mm) | 31.0 | 46.3 | 87.9 | 132.1 | 177.5 | 232.0 | 238.8 | 224.0 | 186.3 | 112.8 | 58.3 | 34.7 |
Std (mm) | 18.0 | 32.4 | 42.8 | 37.0 | 44.8 | 39.6 | 36.0 | 41.2 | 35.3 | 59.5 | 45.5 | 26.1 | |
CV (%) | 58.1 | 70.0 | 48.7 | 28.0 | 25.2 | 17.1 | 15.1 | 18.4 | 18.9 | 52.7 | 77.9 | 75.1 | |
Jinka | Mean (mm) | 45.3 | 47.9 | 103.4 | 178.5 | 158.1 | 104.4 | 80.0 | 99.4 | 126.2 | 166.3 | 129.9 | 44.0 |
Std (mm) | 39.7 | 33.2 | 48.5 | 54.5 | 45.7 | 41.0 | 36.1 | 41.0 | 46.5 | 46.9 | 76.9 | 37.8 | |
CV (%) | 87.5 | 69.2 | 46.9 | 30.5 | 28.9 | 39.3 | 45.1 | 41.3 | 36.8 | 28.2 | 59.2 | 85.9 | |
Lalibela | Mean (mm) | 17.0 | 15.6 | 36.9 | 53.0 | 42.2 | 48.0 | 254.6 | 264.7 | 42.6 | 19.6 | 18.6 | 10.5 |
Std (mm) | 8.5 | 7.6 | 18.3 | 28.1 | 24.3 | 25.2 | 64.4 | 60.4 | 12.4 | 12.0 | 16.3 | 5.8 | |
CV (%) | 50.3 | 48.5 | 49.6 | 52.9 | 57.5 | 52.5 | 25.3 | 22.8 | 29.1 | 61.1 | 87.6 | 54.8 | |
Mekele | Mean (mm) | 0.0 | 2.8 | 20.6 | 33.1 | 34.7 | 41.7 | 218.5 | 257.9 | 43.8 | 4.8 | 4.6 | 0.0 |
Std (mm) | 0.1 | 4.7 | 12.6 | 18.4 | 17.7 | 15.8 | 71.5 | 77.0 | 20.9 | 4.7 | 5.9 | 0.1 | |
CV (%) | 500.0 | 164.3 | 60.9 | 55.5 | 50.9 | 37.8 | 32.7 | 29.8 | 47.7 | 98.7 | 130.0 | 500.0 | |
Semera | Mean (mm) | 10.4 | 7.1 | 11.4 | 28.8 | 11.7 | 0.5 | 41.3 | 75.3 | 8.1 | 0.7 | 8.4 | 2.0 |
Std (mm) | 4.4 | 9.5 | 9.4 | 22.3 | 9.3 | 0.8 | 19.2 | 29.6 | 2.6 | 1.0 | 6.2 | 3.8 | |
CV (%) | 42.0 | 133.5 | 83.0 | 77.6 | 79.1 | 163.3 | 46.4 | 39.3 | 31.9 | 153.7 | 74.6 | 191.9 | |
Shire | Mean (mm) | 0.3 | 0.1 | 1.7 | 26.2 | 49.4 | 118.2 | 258.5 | 299.3 | 115.0 | 23.6 | 12.7 | 0.0 |
Std (mm) | 0.9 | 0.2 | 2.3 | 13.8 | 25.8 | 37.8 | 39.0 | 41.1 | 39.0 | 13.3 | 6.9 | 0.0 | |
CV (%) | 330.8 | 420.0 | 138.7 | 52.6 | 52.4 | 32.0 | 15.1 | 13.7 | 33.9 | 56.5 | 53.8 | 300.0 | |
Nekemte | Mean (mm) | 7.2 | 10.1 | 54.7 | 93.8 | 238.0 | 349.3 | 359.8 | 341.2 | 274.1 | 164.1 | 46.4 | 14.7 |
Std (mm) | 5.2 | 9.0 | 31.9 | 46.8 | 76.6 | 51.4 | 47.9 | 60.2 | 46.2 | 67.8 | 27.7 | 8.6 | |
CV (%) | 72.5 | 88.5 | 58.3 | 49.9 | 32.2 | 14.7 | 13.3 | 17.6 | 16.9 | 41.3 | 59.8 | 58.2 |
Season | Belg | Kiremt | Bega | ||||||
|---|---|---|---|---|---|---|---|---|---|
Airport | Mean | Std | CV (%) | Mean | Std | CV (%) | Mean | Std | CV (%) |
Axum | 89.5 | 37.5 | 41.9 | 661.3 | 84.7 | 12.8 | 40.7 | 23.3 | 57.2 |
Arba Minch | 381.1 | 80.7 | 21.2 | 244.2 | 57.6 | 23.6 | 243.7 | 75.9 | 31.1 |
Asosa | 198.5 | 46.5 | 23.4 | 868.5 | 82.5 | 9.5 | 135.3 | 33.4 | 24.7 |
Awassa | 350.1 | 68.3 | 19.5 | 473.0 | 54.9 | 11.6 | 167.8 | 55.1 | 32.9 |
Bahir Dar | 124.3 | 54.9 | 44.2 | 1147.4 | 97.7 | 8.5 | 116.6 | 47.9 | 41.1 |
Bale Goba | 334.3 | 70.1 | 21.0 | 424.2 | 77.7 | 18.3 | 188.8 | 64.8 | 34.3 |
Addis Ababa | 300.1 | 96.9 | 32.3 | 863.4 | 125.6 | 14.5 | 109.0 | 47.4 | 43.5 |
Dessie | 251.5 | 89.0 | 35.4 | 667.0 | 119.5 | 17.9 | 99.9 | 42.9 | 42.9 |
Dire Dawa | 235.5 | 96.6 | 41.0 | 275.7 | 48.8 | 17.7 | 64.0 | 37.6 | 58.8 |
Dembi dolo | 417.2 | 78.1 | 18.7 | 753.5 | 59.0 | 7.8 | 176.5 | 37.0 | 20.9 |
Gambella | 271.2 | 43.0 | 15.8 | 720.3 | 69.4 | 9.6 | 200.9 | 51.7 | 25.7 |
Gode | 143.0 | 52.8 | 36.9 | 2.9 | 3.4 | 117.8 | 131.9 | 97.5 | 73.9 |
Gondar | 128.8 | 38.3 | 29.7 | 659.9 | 110.1 | 16.7 | 57.5 | 26.5 | 46.1 |
Debrezeit | 211.2 | 83.2 | 39.4 | 683.1 | 103.1 | 15.1 | 26.0 | 19.4 | 74.7 |
Humera | 78.1 | 29.5 | 37.7 | 931.9 | 133.0 | 14.3 | 47.9 | 27.1 | 56.5 |
Jigjiga | 211.4 | 71.4 | 33.7 | 273.6 | 54.3 | 19.9 | 57.8 | 42.1 | 72.9 |
Jimma | 443.8 | 93.6 | 21.1 | 881.0 | 69.7 | 7.9 | 235.5 | 95.1 | 40.4 |
Jinka | 488.0 | 103.7 | 21.3 | 410.0 | 103.9 | 25.3 | 382.2 | 143.9 | 37.7 |
Lalibela | 147.7 | 49.1 | 33.3 | 609.9 | 108.5 | 17.8 | 65.7 | 26.7 | 40.7 |
Mekele | 91.3 | 37.5 | 41.1 | 561.8 | 126.4 | 22.5 | 9.4 | 7.7 | 81.9 |
Semera | 59.0 | 28.7 | 48.6 | 125.2 | 36.0 | 28.8 | 21.5 | 8.2 | 38.0 |
Shire | 77.3 | 33.6 | 43.5 | 791.0 | 83.2 | 10.5 | 36.6 | 16.9 | 46.3 |
Nekemte | 396.5 | 85.8 | 21.6 | 1324.5 | 136.5 | 10.3 | 232.3 | 81.4 | 35.0 |
Cb | Cumulonimbus |
CDT | Climate Data Tool |
CDF | Cumulative Distribution Function |
CHIRPS | Climate Hazards Group InfraRed Precipitation |
CV | Coefficient of Variation |
EMI | Ethiopian Meteorology Institute |
FMAM | February, March, April, May |
GIS | Geographic Information Systems |
ITCZ | Inter-tropical Convergence Zone |
JJAS | June, July, August, September |
MAE | Mean Absolute Error |
MCN | Multilayer Complex Network |
NSE | Nash-Sutcliffe Efficiency |
ONDJ | October, November, December, January |
RMSE | Root Mean Square Error |
STD | Standard Deviation |
TCu | Towering Cumulus |
VFR | Visual Flight Rules |
| [1] | O. M. Haji et al., “The Influence of Climate Change and Variability on Aircraft Take-off and Landing Performance; a Case Study of the Abeid Amani Karume International Airport-Zanzibar,” J. Transp. Technol., vol. 12, no. 03, pp. 453-474, 2022, |
| [2] | K. Kim, H. Lee, M. Lee, Y. H. Bae, H. S. Kim, and S. Kim, “Analysis of Weather Factors on Aircraft Cancellation using a Multilayer Complex Network,” Entropy, vol. 25, no. 8, 2023, |
| [3] | E. A. Adeleke, “Climate Change in Kwara State, Nigeria : Evidence of Rainfall and Temperature Variations,” vol. 2, no. I, pp. 48-63, 2024. |
| [4] | Á. Rodríguez-Sanz, J. Cano, and B. R. Fernández, “Impact of weather conditions on airport arrival delay and throughput,” IOP Conf. Ser. Mater. Sci. Eng., vol. 1024, no. 1, 2021, |
| [5] | V. E. Weli and G. C. Emenike, “Turbulent Weather Events and Aircraft Operations: Implications for Aviation Safety At the Port Harcourt International Airport, Nigeria,” Clim. Chang. Conserv. Res., vol. 2, no. 1, pp. 11-21, 2016. |
| [6] | K. Fekadu, “Ethiopian Seasonal Rainfall Variability and Prediction Using Canonical Correlation Analysis (CCA),” Earth Sciences, vol. 4, no. 3. p. 112, 2015. |
| [7] | G. T. Diro, T. Toniazzo, and L. Shaffrey, “Ethiopian Rainfall in Climate Models,” no. February, 2011, |
| [8] | T. Gebre, Z. Abraha, A. Zenebe, and W. Zeweld, “Precipitation variability and its teleconnection with the global SST and ENSO indices in the food-insecure rural areas of Tigray,” Theor. Appl. Climatol., no. 2019, 2023, |
| [9] | Y. Seleshi and U. Zanke, “Recent changes in rainfall and rainy days in Ethiopia,” Int. J. Climatol., vol. 24, no. 8, pp. 973-983, 2004, |
| [10] | Z. T. Segele, “Characterization and variability of Kiremt rainy season over Ethiopia Characterization and variability of Kiremt rainy season over Ethiopia,” no. August, 2014, |
| [11] | M. L. Berihun et al., Examining the past 120 years’ climate dynamics of Ethiopia, vol. 154, no. 1-2. Springer Vienna, 2023. |
| [12] | T. Hassan, S. A. Gadzama, and L. U. Solomon, “International Journal of Research Publication and Reviews Effects of Weather Parameters on Flight Operations and Passenger Security in Nigeria,” vol. 5, no. 9, pp. 624-631, 2024. |
| [13] | E. A. Mohammed, X. Zhi, and K. A. Abdela, “Extreme Weather Patterns in Ethiopia: Analyzing Extreme Temperature and Precipitation Variability,” Atmosphere (Basel)., vol. 16, no. 2, 2025, |
| [14] | F. T. Tola, D. K. Dadi, T. T. Kenea, and T. Dinku, “Weather and climate services in Ethiopia: progress, challenges, and opportunities,” Front. Clim., vol. 7, no. April, pp. 1-17, 2025, |
| [15] | T. Dinku, R. Faniriantsoa, S. Islam, and G. Nsengiyumva, “The Climate Data Tool : Enhancing Climate Services Across Africa,” vol. 3, no. February, pp. 1-16, 2022, |
| [16] | C. D. Geleta and T. A. Deressa, “Evaluation of Climate Hazards Group InfraRed Precipitation Station (CHIRPS) satellite-based rainfall estimates over Finchaa and Neshe Watersheds, Ethiopia,” Eng. Reports, vol. 3, no. 6, pp. 1-16, 2021, |
| [17] | Z. Watershed, “Evaluation and Bias Correction of CHIRP Rainfall Estimate for Rainfall-Runo ff Simulation over Lake,” 2019. |
| [18] | M. A. Kidie and A. Teklay, “Journal of Environmental And Sciences (ISSN 2836-2551) Evaluation of multi-source satellite rainfall products in tekeze basin, Ethiopia Journal of Environmental And Sciences (ISSN 2836-2551),” pp. 1-18, 2023. |
| [19] | A. Asfaw, B. Simane, A. Hassen, and A. Bantider, “Variability and time series trend analysis of rainfall and temperature in northcentral Ethiopia: A case study in Woleka sub-basin,” Weather Clim. Extrem., vol. 19, no. June 2017, pp. 29-41, 2018, |
APA Style
Wolde, G. B., Bogale, M. T. (2025). Rainfall Climatology and Variability in Ethiopian Airports. International Journal of Atmospheric and Oceanic Sciences, 9(2), 112-125. https://doi.org/10.11648/j.ijaos.20250902.14
ACS Style
Wolde, G. B.; Bogale, M. T. Rainfall Climatology and Variability in Ethiopian Airports. Int. J. Atmos. Oceanic Sci. 2025, 9(2), 112-125. doi: 10.11648/j.ijaos.20250902.14
@article{10.11648/j.ijaos.20250902.14,
  author = {Getahun Bekele Wolde and Mussie Tizazu Bogale},
  title = {Rainfall Climatology and Variability in Ethiopian Airports
},
  journal = {International Journal of Atmospheric and Oceanic Sciences},
  volume = {9},
  number = {2},
  pages = {112-125},
  doi = {10.11648/j.ijaos.20250902.14},
  url = {https://doi.org/10.11648/j.ijaos.20250902.14},
  eprint = {https://article.sciencepublishinggroup.com/pdf/10.11648.j.ijaos.20250902.14},
  abstract = {Understanding rainfall characteristic is very important for aviation operational planning and for other activities. This study investigated annual, seasonal and monthly rainfall climatology and variability in Ethiopian Active airports from 1991-1994 using time series Climate Hazards Group Infrared Precipitation with Stations (CHIRPS) rainfall datasets. Long year mean, standard deviation and coefficient of variations were used to analyze Annual, Monthly and seasonal rainfall climatology and variability spatially and on active airports as a point. Western and southwestern airports such as Jimma, Asosa, Bahir Dar, and Gambella exhibit the highest annual mean rainfall, consistently exceeding 1,200mm, while eastern and northeastern Airports like Gode and Semera, experience very low annual totals (often below 300mm. For instance, Jimma airport records monthly averages exceeding 200mm in peak months, while Airports like Axum, Humera, and Gode receive less than 1mm in dry months. The Kiremt season contributes the bulk of annual rainfall in most parts of the country, for instance Nekemte Airport (1324.5mm), Bahir Dar airport (1147.4mm), and Jimma airport (881.0mm) leading as high climatological mean rainfall. Belg (February-May) and Bega (October-January) are secondary rainfall seasons and dry seasons respectively but are significant in southern and southwestern parts of the country such as Jinka and Arba Minch. More than 80% of airports fall under low annual rainfall variability (CV < 20%), indicating high reliability for long-term aviation planning. Only Gode airport shows high annual rainfall variability (CV = 41%), indicating operational unpredictability and risk exposure. CV values during dry months often exceed 200%, particularly in arid and semi-arid regions, indicating unreliable rainfall patterns. In contrast, wet months (July-August) in western airports exhibit low CVs (e.g., Bahir Dar: 11.8% in August), supporting predictable seasonal operations. Generally climatological and variability insights highlight the spatial and temporal heterogeneity of rainfall across Ethiopian airports, driven by topography, regional climate systems, and global drivers like ENSO. Understanding both average conditions (climatology) and year-to-year fluctuations (variability) is critical for aviation safety, infrastructure resilience, and operational efficiency.},
 year = {2025}
}
TY  - JOUR
T1  - Rainfall Climatology and Variability in Ethiopian Airports

AU  - Getahun Bekele Wolde
AU  - Mussie Tizazu Bogale
Y1  - 2025/08/15
PY  - 2025
N1  - https://doi.org/10.11648/j.ijaos.20250902.14
DO  - 10.11648/j.ijaos.20250902.14
T2  - International Journal of Atmospheric and Oceanic Sciences
JF  - International Journal of Atmospheric and Oceanic Sciences
JO  - International Journal of Atmospheric and Oceanic Sciences
SP  - 112
EP  - 125
PB  - Science Publishing Group
SN  - 2640-1150
UR  - https://doi.org/10.11648/j.ijaos.20250902.14
AB  - Understanding rainfall characteristic is very important for aviation operational planning and for other activities. This study investigated annual, seasonal and monthly rainfall climatology and variability in Ethiopian Active airports from 1991-1994 using time series Climate Hazards Group Infrared Precipitation with Stations (CHIRPS) rainfall datasets. Long year mean, standard deviation and coefficient of variations were used to analyze Annual, Monthly and seasonal rainfall climatology and variability spatially and on active airports as a point. Western and southwestern airports such as Jimma, Asosa, Bahir Dar, and Gambella exhibit the highest annual mean rainfall, consistently exceeding 1,200mm, while eastern and northeastern Airports like Gode and Semera, experience very low annual totals (often below 300mm. For instance, Jimma airport records monthly averages exceeding 200mm in peak months, while Airports like Axum, Humera, and Gode receive less than 1mm in dry months. The Kiremt season contributes the bulk of annual rainfall in most parts of the country, for instance Nekemte Airport (1324.5mm), Bahir Dar airport (1147.4mm), and Jimma airport (881.0mm) leading as high climatological mean rainfall. Belg (February-May) and Bega (October-January) are secondary rainfall seasons and dry seasons respectively but are significant in southern and southwestern parts of the country such as Jinka and Arba Minch. More than 80% of airports fall under low annual rainfall variability (CV < 20%), indicating high reliability for long-term aviation planning. Only Gode airport shows high annual rainfall variability (CV = 41%), indicating operational unpredictability and risk exposure. CV values during dry months often exceed 200%, particularly in arid and semi-arid regions, indicating unreliable rainfall patterns. In contrast, wet months (July-August) in western airports exhibit low CVs (e.g., Bahir Dar: 11.8% in August), supporting predictable seasonal operations. Generally climatological and variability insights highlight the spatial and temporal heterogeneity of rainfall across Ethiopian airports, driven by topography, regional climate systems, and global drivers like ENSO. Understanding both average conditions (climatology) and year-to-year fluctuations (variability) is critical for aviation safety, infrastructure resilience, and operational efficiency.
VL  - 9
IS  - 2
ER  -
Aviation Meteorology Service, Ethiopian Meteorology Institute, Addis Ababa, Ethiopia
Aviation Meteorology Service, Ethiopian Meteorology Institute, Addis Ababa, Ethiopia
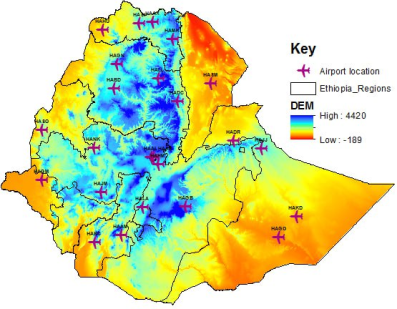
Figure 1. Map of study Area (Active Airports) in Ethiopia.
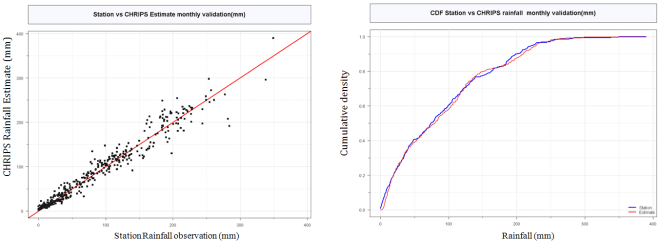
Figure 2. Station and CHRIPS Monthly Rainfall Validation with Scatter plot and CDF.
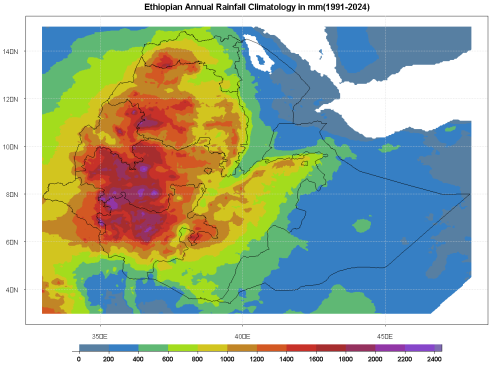
Figure 3. Ethiopia Annual Rainfall Climatology (1991-2024).
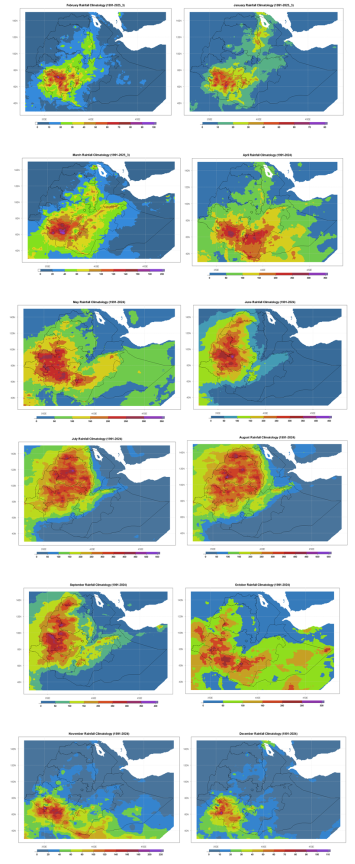
Figure 4. Spatial Monthly Rainfall Climatology (Jan-Dec).
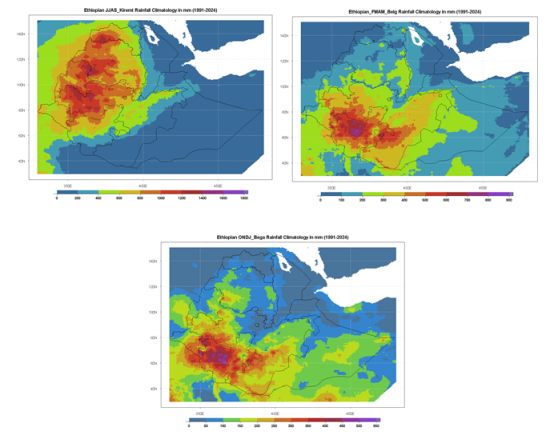
Figure 5. Ethiopian Seasonal Rainfall Spatial Mean Climatology.
Information

