1. Introduction
Millions of people worldwide have diabetes, a common disorder characterized by always elevated blood sugar; efficient therapy depends on regular glucose monitoring
| [1] | Rastogi, R.; Bansal, M.; Kumar, N.; Singla, S.; Singla, P.; Jaswal, R. A. Effective Diabetes Prediction Using an IoT-Based Integrated Ensemble Machine Learning Framework. Eng. Technol. Appl. Sci. Res. 2025, 15(1), 20064–20070. https://doi.org/10.48084/etasr.8869 |
[1]
. The prevalent, traditional finger prick techniques are often painful and only offer discrete snapshots of glucose levels. Seeking a continuous, painless, and more convenient substitute has fueled extensive study into non-invasive monitoring technologies. Various approaches have been explored, including optical, microwave, and electrochemical methods
| [2] | Tang, L.; Chang, S. J.; Chen, C.-J.; Liu, J.-T. Non-Invasive Blood Glucose Monitoring Technology: A Review. Sensors 2020, 20(23), 6925. https://doi.org/10.3390/s20236925 |
[2]
.
One promising non-invasive approach for glucose testing is radio frequency absorption
. Better tissue penetration and improved sensitivity are two key benefits of RF based approaches over near-infrared and mid-infrared ones. RF absorption is not sensitive to skin variations such as thickness or pigmentation, which is a primary motivation. As a result of these skin variations, light absorption and scattering vary considerably from person to person, making optical techniques like near-infrared spectroscopy and Raman spectroscopy difficult to use. For non-invasive blood glucose monitoring, the optimal RF operating frequency range still needs more research. The present work seeks to arrive at a definition of such a frequency range. Although lower and higher frequencies have been used in the RF spectrum according to studies, the rationales behind these choices have not been precisely stated
| [4] | Saha, S.; Cano-Garcia, H.; Sotiriou, I.; Lipscombe, O.; Gouzouasis, I.; Koutsoupidou, M.; Palikaras, G.; Mackenzie, R.; Reeve, T.; Kosmas, P.; Kallos, E. A Glucose Sensing System Based on Transmission Measurements at Millimetre Waves Using Micro Strip Patch Antennas. Sci Rep 2017, 7(1), 6855. https://doi.org/10.1038/s41598-017-06926-1 |
[4]
.
Particularly the VHF band (30-300MHz) of the electromagnetic spectrum seems to be a favorable choice for research since high absorption in this region may occur all over the body
. This implies that although more research is required to ascertain the ideal operating frequency, the VHF band could be a good option for non-invasive blood glucose monitoring. Many scientists investigated the way fields that extend a number of electromagnetic spectrum frequency bands interact with the human body. The absorption of radio frequency radiation by the human body has distinct characteristics across different frequency ranges
| [3] | Yilmaz, T.; Foster, R.; Hao, Y. Radio-Frequency and Microwave Techniques for Non-Invasive Measurement of Blood Glucose Levels. Diagnostics 2019, 9(1), 6. https://doi.org/10.3390/diagnostics9010006 |
| [4] | Saha, S.; Cano-Garcia, H.; Sotiriou, I.; Lipscombe, O.; Gouzouasis, I.; Koutsoupidou, M.; Palikaras, G.; Mackenzie, R.; Reeve, T.; Kosmas, P.; Kallos, E. A Glucose Sensing System Based on Transmission Measurements at Millimetre Waves Using Micro Strip Patch Antennas. Sci Rep 2017, 7(1), 6855. https://doi.org/10.1038/s41598-017-06926-1 |
| [5] | Juan, C. G.; Bronchalo, E.; Potelon, B.; Quendo, C.; Sabater-Navarro, J. M. Glucose Concentration Measurement in Human Blood Plasma Solutions with Microwave Sensors. Sensors 2019, 19(17), 3779. https://doi.org/10.3390/s19173779 |
[3-5]
. According to a previous study, electromagnetic waves at 150 MHz penetrate the human body more easily than those at cell phone frequencies
.
Three electrical parameters of the medium play an important role in wave propagation: permittivity, ε, permeability, μ, and conductivity, σ. The attenuation of electromagnetic waves rises with increasing conductivity, since conductivity is directly related to electromagnetic wave propagation. As water and sodium chloride solutions are homogeneous media, their electrical parameters remain constant regardless of their position within the medium. The permeability of NaCl solution and water do not affect wave propagation, as they are non-magnetic in nature. Thus, the relative magnetic permeability is taken as 1, and relative permittivity is given considerable attention. A material's relative permittivity is its ability to be electrically polarized by an external electric field, which can be induced via electronic, atomic, dipolar, ionic, or orientation polarization
| [7] | Dorey, R. A. “Ceramic thick films for MEMS and microdevices,” William Andrew, Oxford OX5 1GB, UK, Elsevier Inc, Sep 2011, pp. 102-103. |
[7]
. Each polarization mechanism (ionic, dipolar, atomic, electronic) has a relaxation frequency, and slower processes fade out with increasing frequency
| [8] | Dielectric Properties of Tissues / Kenneth R. Foster. In Encyclopedia of Biomaterials and Biomedical Engineering; Wnek, G., Bowlin, G., Eds.; CRC Press, 2008; pp 864–874. https://doi.org/10.1201/9780429154065-83 |
[8]
. Low frequency dielectric response is dominated by ionic polarization, where free charges and ions are important
. Dipolar or rotational polarization processes associated to water molecule rotation in biological tissues dominate mid-range frequencies
| [10] | Marzouk, H. M.; Abd El-Hameed, A. S.; Allam, A.; Pokharel, R. K.; Abdel-Rahman, A. B. Comprehensive System for Noninvasive Glucose Monitoring Utilizing a Rectangular Dielectric Resonator Microwave Sensor. IEEE Trans. Instrum. Meas. 2025, 74, 1–13. https://doi.org/10.1109/TIM.2025.3544356 |
[10]
. Although atomic polarization occurs at higher frequencies, electronic polarization dominates at extremely high frequencies
| [11] | Sebastian, M. T.; Silva, M. A. S.; Sombra, A. S. B. Measurement of Microwave Dielectric Properties and Factors Affecting Them. In Microwave Materials and Applications 2V Set; Sebastian, M. T., Jantunen, H., Ubic, R., Eds.; Wiley, 2017; pp 1–51. https://doi.org/10.1002/9781119208549.ch1 |
[11]
. At frequencies above 100 MHz, the interaction of electromagnetic waves with biological material is nearly entirely determined by its aqueous and ionic composition
| [12] | Kenneth R. Foster, Herman P. Schwan, "Dielectric properties of tissues," in CRC Handbook of Biological Effects of Elec-tromagnetic Fields, 4th ed., Boca Raton, FL, USA: CRC Press, 2019, pp. 27–96. |
[12]
. The utilization of tissue equivalent phantom models of different shapes (like circle, cylinder, and prolate spheroid) is beneficial for experimental energy absorption testing of a device or system
| [13] | IEEE Recommended Practice for Measurements and Computations of Radio Frequency Electromagnetic Fields With Respect to Human Exposure to Such Fields, 100 kHz-300 GHz. https://doi.org/10.1109/IEEESTD.2002.94226 |
[13]
. Since sixty percent of the human body is water, for emulating human tissue, a water tank phantom can be considered the best readily available alternative for most energies
| [14] | Peyman, A.; Gabriel, C.; Grant, E. H. Complex Permittivity of Sodium Chloride Solutions at Microwave Frequencies. Bioelectromagnetics 2007, 28(4), 264–274. https://doi.org/10.1002/bem.20271 |
[14]
. Based on the fact that different tissues inside the body have different water contents, a synthetic model of the tissues for simulating their behaviour in high frequency transmission comprises a liquid mixture of NaCl and acetonitrile of appropriate concentrations in a container whose shape and dimensions emulate the tissue or organ of interest
| [15] | Durney, C. H. Electromagnetic Dosimetry for Models of Humans and Animals: A Review of Theoretical and Numerical Techniques. Proc. IEEE 1980, 68(1), 33–40. https://doi.org/10.1109/PROC.1980.11578 |
[15]
. The human body contains a variety of salts, out of which NaCl is the primary one, and it makes up around 0.4% of the body's concentration comparable to that in seawater
| [16] | Guyton, A. C. and Hall, J. E. Textbook of Medical Physiology, 11th ed. Elsevier Saunders, 2006. |
[16]
.
According to energy conservation, an incident electromagnetic wave can bounce (reflect or scatter), attenuate, or transmit through a material. The response of the material to the incident wave is determined by its inherent properties
| [17] | Ulaby, F. T. and Ravaioli, U. Fundamentals of Applied Electromagnetics. Pearson Education, 2015. |
[17]
. The rate of attenuation of electromagnetic waves propagating in saline water is solely determined by the medium's relative permittivity
. "Skin depth" or "penetration depth" are terms used to describe a media's attenuation properties. This expression describes how close an electromagnetic wave's amplitude gets to 1/e, or 36.8% of its initial value. The significance of this in a lossy medium (excellent conductor) where σ≫ωε is written as
| [19] | Cheng, David K. Field and Wave Electromagnetics. Second edition, Pearson, 2014. |
[19]
:
(1)
Where μ = permeability of the material (henries per meter),
σ = conductivity of the material (siemens per meter),
ω = angular frequency (radians per second),
δ = skin depth (meters),
Thus, high frequencies exhibit restricted penetration depth, while lower frequencies can penetrate more deeply via various media. Previous research has reported that the propagation of electromagnetic radiation, particularly in the radiofrequency bands, is restricted in water due to its high relative permittivity and conductivity
. The absorption loss and propagation velocity of electromagnetic waves in fresh water are frequency independent, while they become carrier frequency dependent in conductive solutions
.
The selection of optimal frequency for non-invasive blood glucose measurement depends on numerous factors. These include the sensitivity of the measurement, the penetration depth of the radio wave signal, and the interference from other factors. The operating frequency should be selected considering tissue selectivity and sensitivity. VHF waves may be beneficial for non-invasive glucose monitoring due to their properties like moderate tissue penetration, minimal tissue heating and molecular composition responsiveness. There are limited studies available in literature on the VHF based glucose sensing methods, which includes three modes of operation for implementation of the sensor: transmission based, reflection based and resonance frequency shift techniques. A transmissive technique for non-invasive glucose testing was tested utilizing electromagnetic sensing at 45 MHz. This study utilized a bobbin coil and network analyzer to assess glucose levels
| [22] | Alavi, S. M.; Gourzi, M.; Rouane, A.; Nadi, M. An Original Method for Non-Invasive Glucose Measurement: Preliminary Results. In 2001 Conference Proceedings of the 23rd Annual International Conference of the IEEE Engineering in Medicine and Biology Society; IEEE: Istanbul, Turkey, 2001; Vol. 4, pp 3318–3320. https://doi.org/10.1109/IEMBS.2001.1019535 |
[22]
. A multi sensor device with 40–80 MHz frequencies was developed to monitor changes in interstitial fluid permittivity caused by glucose. As per the data obtained from the clinical tests the GlucoTrack gadget demonstrated a mean absolute relative difference of 15 to 20%.
| [23] | Harman-Boehm, I.; Gal, A.; Raykhman, A. M.; Zahn, J. D.; Naidis, E.; Mayzel, Y. Noninvasive Glucose Monitoring: A Novel Approach. J Diabetes Sci Technol 2009, 3(2), 253–260. https://doi.org/10.1177/193229680900300205 |
| [24] | Lin, T. Non-Invasive Glucose Monitoring: A Review of Challenges and Recent Advances. CTBEB 2017, 6(5). https://doi.org/10.19080/CTBEB.2017.06.555696 |
[23, 24]
. A separate research developed a 200 MHz onwards transmission line sensor, utilizing sophisticated machine learning methods to account for moisture content and temperature variables for precise measurement
| [25] | Xue, Y.; Thalmayer, A. S.; Zeising, S.; Fischer, G.; Lübke, M. Commercial and Scientific Solutions for Blood Glucose Monitoring—A Review. Sensors 2022, 22(2), 425. https://doi.org/10.3390/s22020425 |
[25]
. Reflection based techniques examine the impedance difference at tissue interfaces. In an advanced multi sensor system, the sensor operating in frequency range (0.1 to 100 MHz) with three capacitive elements of varying shapes and sizes assessed impedance magnitude and phase over 16 frequencies
| [26] | Caduff, A.; Mueller, M.; Megej, A.; Dewarrat, F.; Suri, R. E.; Klisic, J.; Donath, M.; Zakharov, P.; Schaub, D.; Stahel, W. A.; Talary, M. S. Characteristics of a Multisensor System for Non Invasive Glucose Monitoring with External Validation and Prospective Evaluation. Biosensors and Bioelectronics 2011, 26(9), 3794–3800. https://doi.org/10.1016/j.bios.2011.02.034 |
[26]
. An isolator separated incident and reflected signals and demonstrated the skin layer glucose related dielectric changes. In another study, dipole sensor emitted and measured reflected waves at 100-300MHz to detect glucose related tissue dielectric changes. Machine learning systems estimated glucose levels from sensor data
| [27] | Bamatraf, S. M.; Aldhaeebi, M. A.; Ramahi, O. M. Noninvasive continuous glucose monitoring on aqueous solutions using microwave sensor with machine learning. Pier Letters 2022, 102, 127–134. https://doi.org/10.2528/PIERL21110905 |
[27]
. The utilization of VHF waves for non-invasive blood glucose monitoring offers an intriguing yet difficult prospect. The theoretical basis and preliminary research suggest potential; nonetheless, actual application necessitates addressing substantial technological and physiological challenges.
This paper investigates the potential of using radio frequency absorption within the VHF range for non-invasive glucose monitoring. Given that the dielectric properties of biological tissues are affected by glucose concentration and that these properties influence the interaction of RF signals with those tissues
| [28] | Gabriel, S.; Lau, R. W.; Gabriel, C. The Dielectric Properties of Biological Tissues: II. Measurements in the Frequency Range 10 Hz to 20 GHz. Phys. Med. Biol. 1996, 41(11), 2251–2269. https://doi.org/10.1088/0031-9155/41/11/002 |
[28]
, this study explores a method for estimating blood glucose levels by measuring changes in RSS at specific RF frequencies. A key objective is to develop a compact, cost effective printed antenna operating within the 175-195 MHz range, a band identified as significant for differentiating glucose concentrations in biological simulants. The study involves antenna design, simulation, fabrication, and experimental evaluation. Through a measurement system, differences in RSS data are collected with human trials, and then polynomial regression model is employed to fit the correlation between the RSS fluctuations and blood glucose levels. This paper aims to contribute to the development of non-invasive glucose monitoring technologies in general to improve diabetes management and patient care.
2. Experimental Approaches
2.1. Radiofrequency Absorption in Aqueous and Biological Media
The development of non-invasive blood glucose detection systems depends on understanding the propagation of radiofrequency waves in biological media. The absorption and dispersion of radiofrequency energy in biological tissues are strongly influenced by their dielectric properties, especially related to their water content
. For this, an experiment is performed to investigate the propagation of radiofrequency signals in different media, including water, sodium chloride solutions, and two biological materials: freshly collected pig blood and chicken leg bone to simulate the absorption characteristics of RF signals in the human body. Because electromagnetic waves propagate very differently in freshwater and seawater, the aim is to determine the ideal frequency range that yields the least and greatest attenuation for RF propagation across the tested media, enabling extrapolation to human tissues
.
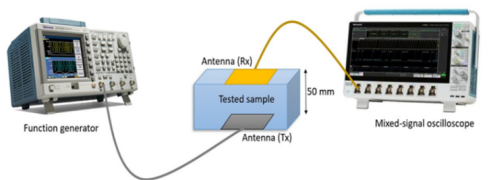
Figure 1. The experimental setup.
The experimental setup in
Figure 1 consists of an insulating rectangular container housing the tested liquid/biological samples, with two identical transmitting and receiving antennas placed adjacent to the container. Printed square loop antennas of identical sizes are used; they excel in multi band operation
| [31] | Balanis, Constantine A. Antenna Theory: Analysis and Design. 1st ed, John Wiley & Sons, Incorporated, 2016. |
[31]
, and for the compact design, they could be easily integrated into a rectangular container. The transmitting antenna is located at the bottom face of the container, while the receiving antenna is attached to the top. The container is covered with aluminium foil on all four lateral sides to ensure that the receiving antenna receives vertically transmitted electromagnetic waves through the tested samples
. This aluminium coating helped trap the waves that would otherwise move parallel to the surface of the solution samples, resulting from the high refraction angle, and facilitates a single propagation path through the tested samples. The container could hold 160 ml of liquid, allowing for a sample column height of 5 cm. The transmitting antenna is fed with a sine wave signal with a peak-to-peak voltage of 4 V, and the frequency is varied at 1 MHz intervals from 148 MHz to 215 MHz from a function generator. The captured signal from the loop antenna is viewed on a mixed signal oscilloscope. NaCl solutions are prepared with four different weight percentage concentrations (2%, 4%, 6%, and 8% w/v) and used freshly collected pig blood and chicken leg bone as additional test samples. The pieces of chicken leg bone are cut into equal lengths and stacked, one piece on top of another, to create a column in the container
. A total of eight samples, including a control sample of water, are tested for the absorption of radio frequency in the system.
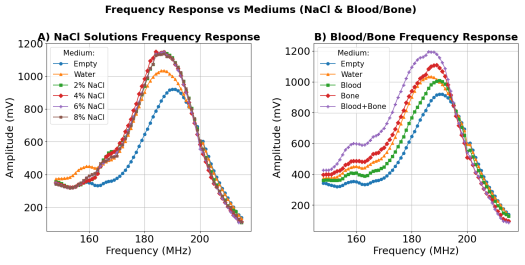
Figure 2. Frequency response of the tested samples.
The data presented in
Figure 2 reveals distinct absorption trends across tested mediums (water, pig blood, chicken leg bone, and blood+bone) in the 148–215 MHz range. For the empty container (i.e., the dielectric is air), around 190 MHz is determined to be the ideal frequency of propagation, and 920 mV is the measured RSS. The transmission is achievable in the water medium; still, the peak propagation frequency is moved to 187 MHz but with a larger signal intensity than in air. When the container is filled with water, the amplitude of the recorded signals in the frequency range of 148 to 196 MHz rises as compared to that obtained for the empty container. Attributed to constructive interference among the RF waves, the increase is observed to be greatest (38%) compared to air at frequency 181 MHz. The water sample readings are used as a control for comparison of the tested sample solutions. The amplitude of the captured signal increases for the entire level of tested NaCl solutions in the range of 165 to 196 MHz compared to results obtained with water. A significant increase in the amplitude of 12%, 13%, 12%, and 11% can be seen in the frequency of 184 MHz for 2%, 4%, 6%, and 8% NaCl solutions, respectively compared to the control. But an opposite trend is depicted across the frequency range 148-164 MHz; the signal amplitude levels off, unlike the case of control for all tested samples. The peak percentage decrease in amplitude values is obtained at the frequency of 157 MHz and is in the range of 20 to 22% of all the samples. This absorption of RF signals can be attributed to the dielectric constant or relative permittivity of the NaCl solutions. The pig blood sample absorbed the incident RF almost in the entire frequency range (except for the band 190-195 MHz) compared to the readings obtained with water, and peak absorption is logged at 182 MHz indicating stronger energy dissipation due to its high water content and ionic conductivity. Due to its high dielectric losses and abundance of hemoglobin and electrolytes, blood exhibits enhanced absorption at the reported frequencies. While the results obtained with the chicken leg bone exhibited an opposite trend in the frequency range 148–194 MHz, the received signal amplitude increased, and beyond that, the signal amplitude stabilize in a similar manner as obtained with the pig blood sample. The peak attenuation and enhancement of amplitude are found at frequencies 201 and 189 MHz, respectively. In contrast to soft tissues, bone has a greater permittivity but a lower conductivity since it is denser and mostly made up of collagen and calcium phosphate minerals. At certain frequencies this leads to greater transmission and less energy loss. When the blood and bone samples are tested together, they exhibit a similar response to the incident radiation as obtained in the case of the chicken leg bone. The signal amplitude continues to increase up to 186 MHz, and beyond that, it begins to level off. However, 175 MHz records the highest value of the received signal amplitude compared to water, with an increase of 32%. After having gathered the measurement data, it is revealed that the signal amplitudes obtained at the receiving antenna vary depending on the tested media and frequency. These results indicate that tissue-specific frequency-dependent absorption patterns exist, and that targeting certain tissue components may be helped by choosing the right frequency bands. The obtained frequency response with fresh water, NaCl solutions, and bone suggests the optimum propagation frequency band of 175-195 MHz, at this range, the enhanced signal amplitude (resulting from scattering and frequency dependent multipath) demonstrated by all tested samples increases as a function of frequency. Comparatively to the readings of the water sample, the pig blood sample absorbed the incident radiation in this frequency range (except from frequencies 190-195 MHz). By means of a comparison between the data acquired in offline mode measurement with a specific excised animal tissue and that obtained in online mode from the same tissue of a living animal, this frequency range has the potential to offer useful non-invasive diagnostic discoveries
| [30] | Bernardi, P.; Cavagnaro, M.; Pisa, S.; Piuzzi, E. Specific Absorption Rate and Temperature Elevation in a Subject Exposed in the Far-Field of Radio-Frequency Sources Operating in the 10-900-MHz Range. IEEE Trans. Biomed. Eng. 2003, 50(3), 295–304. https://doi.org/10.1109/TBME.2003.808809 |
[30]
. The 175–195 MHz band remains critical for differentiating between water, various NaCl solutions, pig blood, and chicken leg bone and for maximizing signal integrity in complex biological media. This broader band can be confirmed as ideal for biological diagnostics, balancing signal integrity and penetration
| [33] | Cole, K. S.; Cole, R. H. Dispersion and Absorption in Dielectrics I. Alternating Current Characteristics. The Journal of Chemical Physics 1941, 9(4), 341–351. https://doi.org/10.1063/1.1750906 |
[33]
.
2.2. Antenna Design and Simulation
The next step involved designing a compact and affordable printed antenna radiating efficiently within the evaluated frequency range for non-invasive blood glucose monitoring applications. Designed and simulated utilizing Path Wave Advanced Design System (ADS) software, the antenna is built on an FR-4 substrate with a relative permittivity of 4.4 and a thickness of 1.6 mm. The antenna is characterized as a meander line printed monopole antenna with the dimension of 17 cm x 10 cm. The antenna includes a meander line on the top and a partial ground plane at the bottom layer. The use of edge feeding and the meander line approach in the design helped in achieving a compact size and reasonable gain of the antenna. Key performance measures include a voltage standing wave ratio (VSWR) of 1.15, approaching the ideal value of 1, which signifies efficient power transfer; a peak gain of 0.145 dBi at 203 MHz; and a radiation efficiency of 66%, considered acceptable for compact VHF antennas; a return loss (S11) of -26 dB at 203 MHz indicates minimal signal reflection
| [34] | Sutradhar, D.; Hazarika, D.; Bhunia, S. Design of Small-Sized Meander Lined Printed Monopole Antenna Operating in VHF Range. In Inventive Systems and Control; Suma, V., Chen, J. I.-Z., Baig, Z., Wang, H., Eds.; Springer Singapore: Singapore, 2021; Vol. 204, pp 517–525. https://doi.org/10.1007/978-981-16-1395-1_38 |
[34]
. Compared to traditional VHF antennas, the design achieves a compactness of 89.5%, so balancing size, cost, and performance make it appropriate for non-invasive blood glucose testing uses.
2.3. Antenna Fabrication and Testing
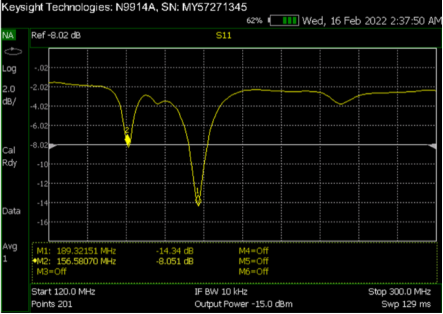
Figure 3. The S11 measurement of the fabricated antenna.
The antenna is fabricated on a double sided PCB with a tin lead finish achieved through hot air levelling, which ensures a smooth and consistent surface to have better electrical conductivity and achieve good soldering of subminiature version-A (SMA) connectors with the antenna. The antenna performance is then measured with a vector network analyzer (VNA), and the plot of return loss revealed the presence of two resonant frequencies at 189 MHz and 156 MHz. At 189 MHz, the S11 value is found to be -14.34 dB and followed by secondary resonance at 156 MHz with an S11 of -8.051 dB (
Figure 3). There is an obvious shift of the resonance frequency from 203 MHz, found in the simulation result, to 189 MHz in the measured S11 value. The reason for this frequency shift may be due to dielectric constant differences and manufacturing tolerances. During the simulation a constant and ideal dielectric value is typically assumed for the substrate material. But in reality the actual dielectric constant of the PCB material may vary slightly from the specified value due to manufacturing variability. If the real dielectric constant is higher than assumed, the effective electrical length increases, which in turn lowers the resonant frequency. Fabrication-induced parasitic effects and dimensional tolerances such as increased trace length or thickness irregularities also results in downward shift in resonant frequency. Although the antenna is designed to resonate at a single frequency, the appearance of the second resonance could be an unintentional result of substrate differences or unanticipated coupling interactions. Meander lines inherently display several resonant modes owing to their complex shape.
The two detected resonances may signify the fundamental mode and a higher-order mode of the meandering structure. This 156 MHz may also be considered for detecting blood dominated regions due to the strong absorption by pig blood at this frequency (390.8 mV vs. water's 427.2 mV,
Figure 2(
b)). NaCl solutions also portrayed 20–22% amplitude reduction around this frequency. This 156 MHz signal could be valuable in the current glucose sensing setup, even if the signal penetration is going to be weaker compared to the 189 MHz frequency.
2.4. Sensor Setup and Integration
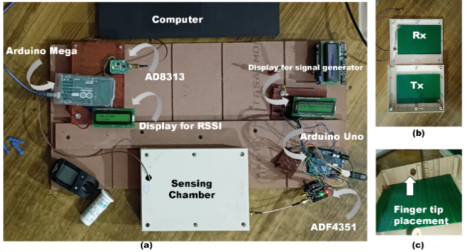
Figure 4. System Configuration, (a) visual overview of the setup; (b) placement of antennas; (c) fingertip placement area.
The proposed configuration is a non-invasive blood glucose measurement system that uses radio frequency signals to assess glucose concentrations in the bloodstream. As can be seen from
Figure 4, the system comprises a transmitting antenna (T
x), a receiving antenna (R
x), a signal generator, and a signal strength analyzer. The T
x antenna emits RF signals via the fingertip, while the R
x antenna captures the received signals. The housing (size: 17 cm x 10 cm) holds the two antennas in a precise alignment facing each other. The distance between the antennas is fixed at 3 cm, optimized for the dimensions of the fingertips of the individuals agreed upon for clinical trials.
The fingertip is an advantageous site for RF absorption measurement in blood glucose detection due to numerous critical aspects, including thin tissue layers, high capillary density, reduced muscle and fat content, and, most significantly, ease of access for the proposed setup. Due to the direct blood supply and low tissue interference in the fingertip, fluctuations in blood glucose levels are more likely to affect RF absorption than in other body parts. The fingertip is already often utilized for several blood related tests, including pulse oximetry and capillary blood collection. This established application serves as a basis for modifying RF absorption methods for glucose monitoring. The signal generator provides the RF signal to the Tx antenna, and the signal analyzer measures the received signal strength from the Rx antenna. The signal generator (ADF4351, a wide band frequency synthesizer) emits two RF signals (156 MHz and 189 MHz) one after another to the Tx antenna, while the signal analyzer (AD8313, a logarithmic RF detector) quantifies the received signal strengths after its passage through the fingertip. The Arduino Uno programs the ADF4351 to generate the two RF signals, and the Arduino Mega reads the voltages from the AD8313 and processes the data. The received signal strength data is analyzed to determine the absorption characteristics, which are then correlated with blood glucose levels. For real time blood glucose monitoring, the replacement of laboratory equipment, including function generator and mixed signal oscilloscope with small and dedicated RF components like the ADF4351 and AD8313 greatly improves the system's portability, affordability, and user friendliness.
2.5. Clinical Trial with Human Subjects
A total of eight volunteers participated in the clinical trial, and approval from the institutional ethics council (IEC) was obtained to perform the study involving human participants. For each participant, the distal phalanx of the index finger is positioned between the sensing system.
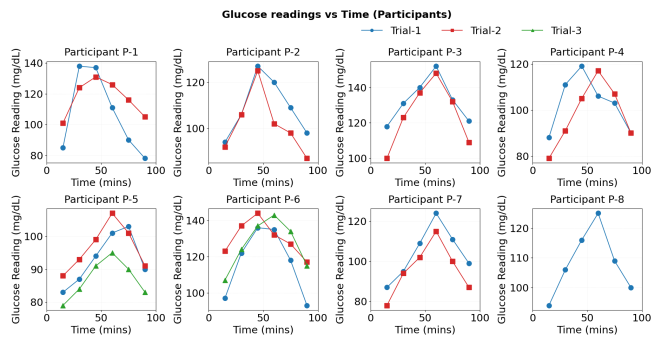
Figure 5. Actual blood glucose values measured by glucometer for the eight volunteers.
In comparison to utilizing the entire finger or the distal and middle phalanx, the distal phalanx has distinct advantages that render it a superior choice for precise and dependable measurements. Measuring the entire finger or including the middle phalanx would introduce considerable heterogeneity in tissue composition (e.g., skin, muscle, bone, and tendons), thereby complicating the measurement unnecessarily, as the presence of additional muscle and bone can disrupt the RF signal, resulting in increased signal noise and diminished accuracy. The difference in frequency response behaviour between blood and bone obtained earlier in this investigation emphasize the need to carefully consider the measurement site and sensor alignment to prevent interference from deeper tissues like bone. Before the clinical study, each participant is asked to consume 50 grams of glucose, and then measurements are recorded at 15-minute intervals.
Glucose first begins absorption from the digestive system into the bloodstream within the first fifteen minutes. Blood glucose levels start to rise, but at that time the spike is not yet significant. Subsequently, in the next 30 to 60 minutes, blood glucose levels generally reach their highest point. It is observed that for many individuals (indicated by abbreviations P-1 to P-8 in
Figure 5), the peak glucose content in the bloodstream appears approximately between 30- and 45-minutes following glucose ingestion. Afterwards, within 60 to 90 minutes after reaching the peak, blood glucose levels commence a drop as insulin is secreted to promote glucose absorption by cells.
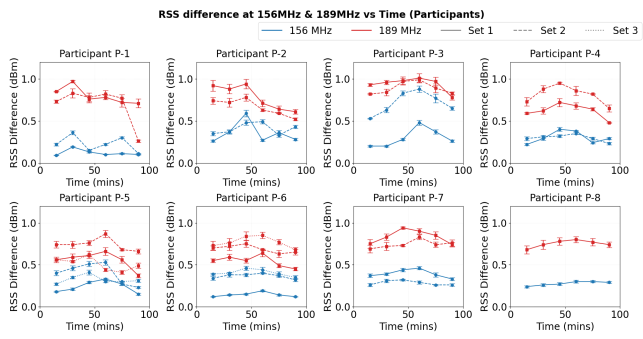
Figure 6. RSS differences at 156MHz and 189MHz for eight volunteers.
The different colors in
Figures 5 and
6 represent two distinct sets of measurements performed on the same individual but at different time points. Ultimately, blood glucose levels in healthy individuals revert to baseline or near normal values. The experimental procedure involved measuring the RSS (at the two distinct frequencies, 156 MHz and 189 MHz) without any fingertip in place to establish a baseline, then introducing the fingertip into the sensing region and measuring the RSS again with the same two frequencies at 15-minute intervals (
Figure 6). The difference between these two readings is considered as the final signal for analysis.
(2)
This subtraction helps to eliminate background noise, device drift, and environmental fluctuations, and partially accounts for inter-subject anatomical differences. Participants' blood glucose levels are also monitored simultaneously with an Accu-Chek Active Glucometer, which meets the global accuracy standard ISO 15197: 2013. The difference in the RSS signals obtained with and without a fingertip is correlated with the glucometer readings. Using polynomial model, the collected data is analyzed to evaluate the accuracy and reliability of the glucose measurement system.
3. Data Analysis and Discussion
A program is written in python that combines simplicity of syntax and powerful features to establish a polynomial relationship between the RSS differences at two frequencies (156 MHz and 189 MHz) and blood glucose concentration. The goal is to create a predictive model that can estimate blood glucose levels based on the two RSS differences. Polynomial features of degree-2 are generated, incorporating quadratic and interaction terms, such as X12, X22, X1*X2 and interactions among multiple engineered features like normalized difference, geometric mean, log(X1/X2) etc., where, X1 = RSS difference at 156 MHz, and X2 = RSS difference at 189 MHz.
Table 1. Key Polynomial Features Influencing Blood Glucose Prediction.
Positive Impact | Negative Impact |
Normalized difference | X1 |
Absolute difference | X2 |
Sum | Logarithm of their ratio |
Squared ratio | Arithmetic mean |
Geometric mean (X1/X2) and other features | Square of normalized difference |
These features are then used to construct a second-degree polynomial regression model to estimate blood glucose concentration. The resulting equation includes numerous terms with high magnitude coefficients due to the diverse scales and interactions among the input features. The equation is lengthy and complex, it contains original features, their squared values, and interaction terms between them, reflecting a highly non-linear model structure. The R-squared score, RMSE, and MAE are used to evaluate the model's performance. Some of the key features with large positive or negative influence on the prediction are as listed in
Table 1.
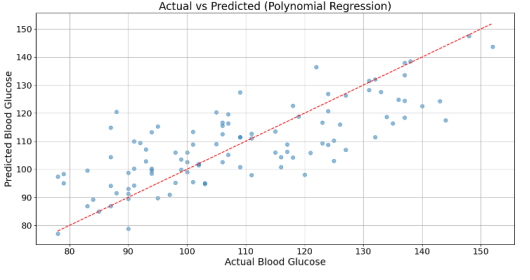
Figure 7. Actual vs. Predicted blood glucose values.
The model achieved an R-squared value of 0.5850, indicating that it explains approximately 58.5% of the variability in the blood glucose data. The RMSE value of 11.77 and MAE of 9.21 indicate a moderate level of prediction error. The actual vs predicted plot in
Figure 7 shows that the polynomial regression model correctly predicts the general trend in blood glucose levels, with projected values being mostly in line with actual measurements particularly in the mid-range. However, the scatter of points around the ideal red dashed line indicates that while the model captures the overall relationship, there is still some variability in its predictions.
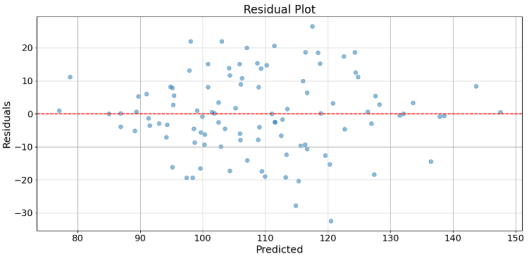
The residual plot as can been seen in
Figure 8 is crucial for evaluating the appropriateness and performance of a regression model. The points appear to be scattered somewhat randomly, both above and below the zero line. The spread of the residuals seems relatively consistent across the range of predicted values. Overall, the residual plot indicated that the polynomial model provides a reasonable fit, but still, there's potential for improvement.
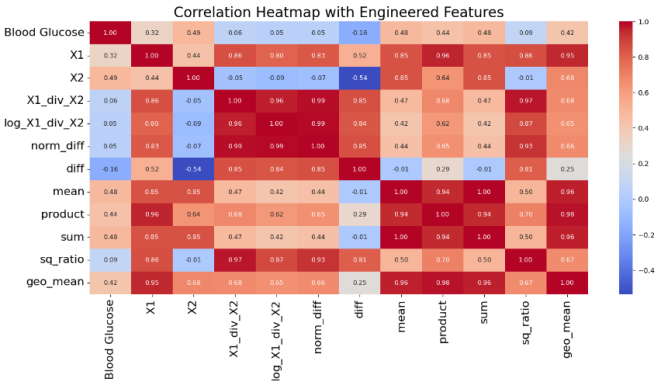
Figure 9. Correlation heat map for polynomial blood glucose prediction.
The correlation heat map represents the Pearson correlation coefficients between various features, including blood glucose and the various engineered features derived from X1 and X2. Strong positive correlation with blood glucose can be seen with four features namely, product, sum, mean and geometric mean of X1 and X2. While X1 and X2 individually portrays a moderate positive correlation (0.44). These weak to moderate correlations explain the model's moderate performance, as reflected in the R² score of 0.5850, indicating that the model captures only part of the variability in blood glucose levels.
One of the primary challenges encountered in this study is the high sensitivity of the received signal measurement to slightest movement of the finger during data acquisition process. Since the propagation of radio frequency signals is strongly influenced by positioning and alignment within the sensing region, even minor displacement of the finger is found to induce significant fluctuations in RSS values. These fluctuations introduce substantial measurement noise, thereby reducing the measurement reliability. To minimize this source of experimental error, a controlled acquisition protocol is followed. Participants are instructed to keep their fingers completely still during each measurement sequence. The finger is gently secured in a fixed position within the sensing chamber, and readings are recorded only after continuous monitoring confirmed signal stabilization, indicative of a steady-state condition. Furthermore, to enhance reliability three consecutive RSS measurements are acquired at each sampling instance and their arithmetic mean is taken as final reading.