1. Introduction
Diabetes Mellitus (DM) is a metabolic disorder characterized by chronically high levels of blood glucose, resulting from absolute or relative insulin deficiency leading to long-term profound damage to different organs in the body such as the eyes, kidneys, nerves, heart and blood vessels
| [1] | American Diabetes Association. Classification and diagnosis of diabetes: standards of medical care in diabetes—2021. Diabetes Care 2021; 44(Suppl 1): S15–S3. https://doi.org/10.233/dc21-S002 |
[1]
. The prevalence of DM has continued to increase in recent years leading to epidemic levels in many countries of the world so much that populations previously unaffected or minimally affected by DM are now reporting soaring prevalence figures, making DM a major public health problem worldwide
| [2] | Uloko A, Musa BM, Ramalan MA, Gezawa ID, Puepet FH, Uloko AT, et al. Prevalence and risk factors for diabetes mellitus in Nigeria: a systematic review and meta-analysis. Diabetes Therapy. 2018; 9(3): 1307-16. https://doi.org/10.1007/s13300-018-0441-1 |
[2]
.
The global burden of diabetes is huge as revealed by statistics from the International Diabetes Federation (IDF); approximately 425 million adults (aged 20-79 years) are living with DM worldwide with nearly 50% of these undiagnosed. These figures are projected to rise to about 693 million by 2045. A significant fraction of this figure is from developing countries of Africa and Asia. Among factors responsible for the soaring epidemic of DM are aging population, increasing urbanization, sedentary lifestyle and obesity
.
Type 2 DM is associated with complications that have a linear relationship with the average plasma glucose and the management of diabetes relies on adequate monitoring of blood glucose control. Reports from the Diabetes Control and Complications Trial (DCCT) clearly revealed the importance of tight glucose control for the prevention of complications of diabetes
| [5] | Diabetes Control and Complications Trial Research Group. The effect of intensive treatment of diabetes on the development and progression of long-term complications in insulin-dependent diabetes mellitus. New England journal of medicine. 1993 30; 329(14): 977-86. https://doi.org/10.1056/NEJM199309303291401 |
[5]
. HbA1c and FPG are traditional blood glucose monitoring tools that have been well established as complementary and gold standard metrics for assessing blood glucose control. However, there is a wide gap between daily blood glucose measurement and average glycaemia over 2-3 months as indicated by HbA1c. Also, the use of HbA1c falls short of utility in certain clinical situations such as haemolytic anaemias, chronic kidney disease, haemoglobinopathies and pregnancy etc. It is also not a reliable marker of short-term glycaemic changes and it cannot reveal post-prandial hyperglycaemia and the analytical methods employed for its measurement may give false results that are sometimes not truly correlated with mean glycaemia
| [5] | Diabetes Control and Complications Trial Research Group. The effect of intensive treatment of diabetes on the development and progression of long-term complications in insulin-dependent diabetes mellitus. New England journal of medicine. 1993 30; 329(14): 977-86. https://doi.org/10.1056/NEJM199309303291401 |
| [6] | George JA, Erasmus RT. Haemoglobin A1c or Glycated Albumin for Diagnosis and Monitoring Diabetes: An African Perspective. Ind J Clin Biochem. 2018; 33(3): 255-261. https://doi.org/10.1007/s12291-018-0755-9 |
| [7] | International Expert Committee Report on the Role of A1c Assay in the Diagnosis of Diabetes. Diabetes care. 2009; 32(1): 1327-1334. https://doi.org/10.2337/dc09-9033 |
[5-7]
.
Recent proposals for additional glycaemic markers beyond HbA1c have advocated the use of intermediate markers such as glycated albumin (GA) to complement the information provided by HbA1c and blood glucose measurement. GA has gained attention in the last few decades as being a new parameter for glycaemic control monitoring. It is formed by a non-enzymatic glycation process similar to HbA1c, but reflects short to intermediate term mean glycaemic levels (≃ 3 weeks), equivalent to the half-life of serum albumin
| [8] | Anguizola J, Matsuda R, Barnaby OS, Hoy KS, Wa C, DeBolt E et al. Glycation of human serum albumin. Clinica chimica acta. 2013 Oct 21; 425: 64-76. https://doi.org/10.1016/j.cca.2013.05.031 |
| [9] | Danese E, Montagnana M, Nouvenne A, Lippi G. Advantages and pitfalls of fructosamine and glycated albumin in the diagnosis and treatment of diabetes. Journal of diabetes science and technology. 2015 14; 9(2): 169-76. https://doi.org/10.1177/193229681462227 |
| [10] | Ueda Y, Matsumoto H. Recent topics in chemical and clinical research on glycated albumin. Journal of diabetes science and technology. 2015 Jan 21; 9(2): 177-82. https://doi.org/10.1177/1932296814562228 |
[8-10]
.
1.1. Physiology of Glycated Albumin
Albumin is a high molecular weight protein with molecular weight 66.7kDa, composed of a single polypeptide chain which contains 585 amino acids, 17 disulfide bridges and 3 homologous domains that are connected in a helical structure8. It is this structure that makes it possible for albumin to perform its physiologic function of maintaining PH and blood osmotic pressure, act as a powerful antioxidant and the main transporter of metabolic products, ions, nutrients, drugs, hormones, and fatty acids. It is the major plasma protein, comprising about 60% of the total protein in blood, with concentration between 30 and 50 g/L and half-life of 14 to 20days
. Like other proteins, albumin is able to go through the physiological process of glycation.
Glycation is a non-enzymatic spontaneous reaction in which a reducing sugar is added to a free amino group, typically lysine or arginine present within proteins, also called Maillard reaction
. The initial step of this reaction involves the formation of an unstable and reversible product known as a Schiff base, formed by bonding of carbonyl group of an acyclic carbohydrate with the N-terminal amino acid8. This intermediate product can suffer a change in its conformation and result in a stable and irreversible ketamine, known as the Amadori product
| [15] | Goldstein DE, Little RR. Bringing order to chaos: The National Glycohaemoglobin Standardization Program. Contempt Int Med. 1997; 9: 27-33. |
[15]
. This product formed is fructoselysine, a reaction between glucose and lysine which may occur on 59 lysine sites present in albumin.
| [12] | Hall V, Thomsen RW, Henriksen O, Lohse N. Diabetes in Sub Saharan Africa 1999-2011: Epidemiology and public health implications. A systematic review. BMC public health. 2011; 11(1): 1-2. https://doi.org/10.1186/1471-2458-11-564 |
[12]
Lysine 525 has been identified as the largest albumin glycation site, which is evidenced both in vivo and invitro.
| [11] | Kohzuma T, Yamamoto T, Uematsu Y, Shihabi ZK, Freedman BI. Basic performance of an enzymatic method for glycated albumin and reference range determination. Journal of diabetes science and technology. 2011; 5(6): 1455-62. https://doi.org/10.1177/193229681100500628 |
| [18] | Freitas PA, Ehlert LR, Camargo JL. Glycated albumin: a potential biomarker in diabetes. Archives of endocrinology and metabolism. 2017; 61: 296-304. https://doi.org/10.15386/mpr-1743 |
[11, 18]
The ketoamines formed by non-enzymatic glycation of proteins is chemically called “fructosamine”. Therefore, fructosamine refers to all the glycated serum proteins. Of the serum fructosamines, Glycated Albumin (GA) is the main constituent comprising about 80% of the glycations in plasma
| [15] | Goldstein DE, Little RR. Bringing order to chaos: The National Glycohaemoglobin Standardization Program. Contempt Int Med. 1997; 9: 27-33. |
[15]
. Albumin glycation rates are 9 to 10 times greater than those of haemoglobin.
| [17] | Garlick RL, Mazer JS. The principal site of nonenzymatic glycosylation of human serum albumin in vivo. Journal of Biological Chemistry. 1983; 258(10): 6142-6. Available from: http://dx.doi.org/10.1016/S0021-9258(18)32384-6 |
| [18] | Freitas PA, Ehlert LR, Camargo JL. Glycated albumin: a potential biomarker in diabetes. Archives of endocrinology and metabolism. 2017; 61: 296-304. https://doi.org/10.15386/mpr-1743 |
[17, 18]
However in an invitro experiment by a study, it was evidenced that GA production was about 4.5 times greater than A1C after adding known and equal concentration of glucose in previous treated samples from healthy volunteers
| [26] | Takei I, Hoshino T, Tominaga M, Ishibashi M, Kuwa K, Umemoto M et al. A committee on diabetes mellitus indices of Japan Society of Clinical Chemistry-recommended reference measurement procedure for glycated albumin determination. Ann Clin Biochem. 2016; 53(pt 1): 124-132. https://doi.org/10.1177/0004563215599178 |
[26]
.
1.2. Glycated Albumin for DM Diagnosis and Monitoring
Glycated albumin is considered an intermediate marker of glycaemia for diabetes. Due to the shorter half-life of albumin compared to haemoglobin, glycated albumin measurements are representative of a far shorter period of exposure to circulating glucose than HbA1c; (about 2-3 weeks), like that of fructosamine. But unlike fructosamine, GA is not affected by other serum proteins, results are expressed as a ratio of glycated albumin to total albumin concentration, thus minimizing differences in protein concentration between individuals and its assay methods are better standardized.
| [11] | Kohzuma T, Yamamoto T, Uematsu Y, Shihabi ZK, Freedman BI. Basic performance of an enzymatic method for glycated albumin and reference range determination. Journal of diabetes science and technology. 2011; 5(6): 1455-62. https://doi.org/10.1177/193229681100500628 |
| [20] | Koga M, Kasayama S. Clinical impact of glycated albumin as another glycemic control marker. Endocrine journal. 2010; 57(9): 751–62. https://doi.org/10.1507/endocrj.K09-139 |
| [22] | Nathan DM, McGee P, Steffes MW, Lachin JM. DCCT/EDIC Research Group. Relationship of glycated albumin to blood glucose and HbA1c values and to retinopathy, nephropathy, and cardiovascular outcomes in the DCCT/EDIC study. Diabetes. 2014; 63(1): 282-290. https://doi.org/10.2337/db13-0836 |
[11, 20, 22]
It is also less affected by the presence of reducing substances in plasma like bilirubin and uric acid.
| [11] | Kohzuma T, Yamamoto T, Uematsu Y, Shihabi ZK, Freedman BI. Basic performance of an enzymatic method for glycated albumin and reference range determination. Journal of diabetes science and technology. 2011; 5(6): 1455-62. https://doi.org/10.1177/193229681100500628 |
[11]
Glycated albumin levels change more rapidly compared to HbA1c because of its high glycation speed (about 4.5 times that of hemoglobin) and its half-life in serum. Therefore, it is more useful as an indicator of glycaemic status in all those conditions requiring short term control of changes in glycaemia, such as after the start or modification of diabetes treatment
| [19] | Masumoto N, Otsuki H, Iwakawa S, Inada S, Koga M. Usefulness of glycated albumin in decisions regarding the discontinuation of a diabetes drug and factors associated with poor glycemic control following discontinuation in patients with type 2 diabetes mellitus. Diabetology international. 2017; 8(1): 39-44. |
[19]
. When intensive insulin therapy was performed as the initial treatment in 8 patients with type 2 diabetes mellitus with poor glycaemic control, there was only a mild decrease in average HbA1c from 10.9% to 10.0% while average GA decreased markedly from 35.6% to 25.0%. The changes of HbA1c and GA during the 2 weeks were – 0.9% and 10.6% respectively; and the decrease of GA was approximately 10 times greater than that of HbA1c
| [22] | Nathan DM, McGee P, Steffes MW, Lachin JM. DCCT/EDIC Research Group. Relationship of glycated albumin to blood glucose and HbA1c values and to retinopathy, nephropathy, and cardiovascular outcomes in the DCCT/EDIC study. Diabetes. 2014; 63(1): 282-290. https://doi.org/10.2337/db13-0836 |
[22]
.
A study looked at the ability of GA to detect short term changes of glycaemic control in a group of 500 patients with newly diagnosed type 2 DM or needing a change in therapeutic regimen because of poor glycaemic control (defined as having HbA1c >7% after at least 2 months of treatment) found that, in patients with improved glycaemic control, GA declined to a greater extent than HbA1c at the early stages of treatment indicating the higher sensitivity of GA than HbA1c for detecting short term changes of glycaemic control. Importantly, GA at day 14 was the strongest predictor of HbA1c variation at day 90, indicating that GA after two weeks could detect the efficacy of therapy confirmed by HbA1c after a longer time
| [19] | Masumoto N, Otsuki H, Iwakawa S, Inada S, Koga M. Usefulness of glycated albumin in decisions regarding the discontinuation of a diabetes drug and factors associated with poor glycemic control following discontinuation in patients with type 2 diabetes mellitus. Diabetology international. 2017; 8(1): 39-44. |
[19]
. Another study reported that GA may serve for guiding diabetes treatment, for example in deciding to switch to a more intensive therapeutic regimen or to discontinue hypoglycaemic drugs based on GA values.
| [11] | Kohzuma T, Yamamoto T, Uematsu Y, Shihabi ZK, Freedman BI. Basic performance of an enzymatic method for glycated albumin and reference range determination. Journal of diabetes science and technology. 2011; 5(6): 1455-62. https://doi.org/10.1177/193229681100500628 |
[11]
Another study reported that measured HbA1c and GA in subjects on peritoneal and hemodialysis and non-nephropathy controls showed that, mean glucose levels and GA were higher in patients on dialysis whereas HbA1c was paradoxically lower. The study also showed that HbA1c was inversely associated with eGFR in advance CKD, but GA was not significantly associated with GRF. These differences appear to translate to outcomes, as higher GA concentrations but not HbA1c has been associated with development of cardiovascular disease in diabetic patients and as a predictor of mortality and cardiovascular morbidity
| [14] | Lu JM, Ji LN, Li YF, Li QM, Lin SS, Lv XF et al. Glycated albumin is superior to glycated hemoglobin for glycemic control assessment at an early stage of diabetes treatment: A multicenter, prospective study. Journal of Diabetes and its Complications. 2016; 30(8): 1609-13. |
[14]
. A study evaluated GA and FA as alternatives to HbA1c in detecting glycaemic control among diabetics with CKD and haemodialysis, and reported GA was a stronger indicator of poor glycaemic control assessed with a 7-day long continuous glucose monitoring when compared to FA and HbA1c
| [21] | Inaba M, Okuno S, Kumeda Y, Yamada S, Imanishi Y, Tabata T et al. Glycated albumin is a better glycemic indicator than glycated hemoglobin values in hemodialysis patients with diabetes: effect of anemia and erythropoietin injection. Journal of the American Society of Nephrology. 2007; 18(3): 896-903. https://doi.org/10.1681/ASN.2006040381 |
[21]
. A study assessed outcomes using HbA1c and GA and found that high GA measurements were consistently associated with increased mortality in patients with diabetes mellitus.
| [23] | Selvin E, Francis LM, Ballantyne CM, Hoogeveen RC, Coresh J, Brancati FL et al. Nontraditional markers of glycemia: associations with microvascular conditions. Diabetes care. 2011; 34(4): 960-7. https://doi.org/10.2337/dc10-2070 |
[23]
Several studies suggest that GA is superior to HbA1c for monitoring diabetes in pregnancy as it reflects more immediate blood glucose and is not affected by anaemia. The GA study group of Japanese Society of Diabetes and Pregnancy analysed the association between outcomes (neonatal complications and birth weight) and indicators of glycaemic control (HbA1c and GA) and found that the incidences of neonatal hypoglycaemia, polycythaemia, respiratory disorders and large for gestational age were found to be significantly higher in women with GA >15.7% compared with GA <15.7%. Whereas there was no significant increase in the incidence in women with HbA1c of more than 5.7% compared with the group of women HbA1c of <5.7% which suggests that GA is preferable
| [30] | Hashimoto K, Koga M. Indicators of glycemic control in patients with gestational diabetes mellitus and pregnant women with diabetes mellitus. World journal of diabetes. 2015; 6(8): 1045. |
[30]
. While GA may be better than HbA1c for monitoring, GA does not appear to perform better when used for screening
| [22] | Nathan DM, McGee P, Steffes MW, Lachin JM. DCCT/EDIC Research Group. Relationship of glycated albumin to blood glucose and HbA1c values and to retinopathy, nephropathy, and cardiovascular outcomes in the DCCT/EDIC study. Diabetes. 2014; 63(1): 282-290. https://doi.org/10.2337/db13-0836 |
[22]
.
Albumin is more sensitive to glycation than other serum proteins because of its high concentration and large number of lysine and arginine residues that may be involved in the formation of early and advanced glycation products
. Research has reported that albumin is ten times more sensitive to glycation than hemoglobin
. Glycation of albumin therefore induces irreversible damage in the different organs and tissues that are the main target of complications in diabetes mellitus such as the kidneys and retina
| [18] | Freitas PA, Ehlert LR, Camargo JL. Glycated albumin: a potential biomarker in diabetes. Archives of endocrinology and metabolism. 2017; 61: 296-304. https://doi.org/10.15386/mpr-1743 |
[18]
. In a sub-group of subjects in the DCCT study, HbA1c and GA were highly correlated and GA paralleled HbA1c over the course of the study. In addition, both HbA1c and GA were strongly associated with progression of retinopathy and nephropathy
| [24] | Furusyo N, Koga T, Ai M, Otokozawa S, Kohzuma T, Ikezaki H et al. Utility of glycated albumin for the diagnosis of diabetes mellitus in a Japanese population study: results from the Kyushu and Okinawa Population Study (KOPS). Diabetologia. 2011; 54(12): 3028-36. https://doi.org/10.1007/S00125-011-2297-7 |
[24]
. It was reported that FA and GA were strongly associated with incident diabetes and its micro-vascular complications with prognostic value comparable to HbA1c in adults attending the Atherosclerosis Risk in Communities (ARIC) study.
| [13] | Ding N, Kwak L, Ballew SH, Jaar B, Hoogeveen RC, Ballantyne CM et al. Traditional and nontraditional glycaemic markers and risk of peripheral artery disease: The Atherosclerosis Risk in Communities (ARIC) study. Atherosclerosis 2018; 274: 86-93. https://doi.org/10.1016/j.atherosclerosis.2018.04.042 |
[13]
A study has reported that GA adds value to HbA1c in the assessment of β-cell secretory dysfunction, post-prandial glucose excursion, unstable fluctuating glycaemia and hypoglycaemic episodes
. Worsening of β-pancreatic cell function was associated with the time duration of DM and with GA and GA/HbA1c ratio but not with HbA1c alone58. A South African study reported that GA appears to be a better indicator of post-prandial glucose, which may be a better indicator of cardiovascular risk, and that it may serve as a complementary marker with HbA1c in pre-diabetes.
| [6] | George JA, Erasmus RT. Haemoglobin A1c or Glycated Albumin for Diagnosis and Monitoring Diabetes: An African Perspective. Ind J Clin Biochem. 2018; 33(3): 255-261. https://doi.org/10.1007/s12291-018-0755-9 |
[6]
Data evaluating the clinical utility of GA in T2DM patients are scarce in our environment. This study therefore assessed the utility of GA as an index of glycaemia, by estimating GA in a group of patients with T2DM and healthy controls; and compared it with the traditional/established markers of blood glucose control (i.e HbA1c and FPG).
2. Materials and Methods
The study was a hospital based cross-sectional study conducted in the diabetic clinic of Jos University Teaching Hospital, a tertiary Hospital in North Central Nigeria over a period of 12 months (November 2020-October 2021). Ethical approval was obtained from the Institutional Ethical committee of the Hospital. A hundred pre-diagnosed cases of T2DM along with 100 age and sex-matched controls were recruited for the study.
The control group consisted of normoglycaemic healthy volunteers who are aged 18years and above without any apparent acute or chronic condition who came for routine medical checkups, medical fitness or were accompanying patients visiting the outpatient department of the Hospital. The case group consisted of T2DM patients attending the diabetic clinic. The diagnostic criteria were as per the cut offs set by WHO/ADA (World Health Organization/ American Diabetes Association) i.e. FPG values ≥ 7.0mmol/L, Hba1c ≥ 6.5% or Ranom Plasma Glucose (RPG) ≥ 11.1mmol/L. An HbA1c value between 5.7% to 6.4%, fasting plasma glucose of 5.6 to 6.9mmol/l, or two-hour plasma glucose between 7.8 to 11 mmol/L during an oral glucose tolerance test (OGTT) indicated an increased risk of DM i.e., the pre-diabetes state.
Participants who are pregnant, or those known to have haemoglobinopathies, chronic kidney disease, chronic liver disease, thyroid disease, on steroid therapy or those with history of recent blood transfusion (within the preceding three months) were excluded. Taking all necessary precautions, venous blood samples were collected from the cubital fossa in the morning hours between 8-10am after an overnight fast of 8-12 hours, from all study participants and transferred to labeled ethylenediamine tetraacetic acid (EDTA), plain and fluoride vacutainer tubes respectively. The EDTA samples were processed for HbA1c on Cobas C311 chemistry autoanalyzer based on Turbidimetric Inhibition Immunoassay (TINIA) method for haemolysed whole blood. The plasma obtained on the centrifugation of fluoride vacutainers at 4000 rpm for 5 minutes was separated and processed for fasting plasma glucose based on Hexokinase method on Cobas c311 autoanalyzer. Serum obtained on centrifugation of plain vacutainers at 4000 rpm for 5 minutes was aliquoted and stored at −80°C until further analysis for serum GA levels on (Biobase BK200) autoanalyzer using an Enzymatic colorimetric method which has been standardized to established reference material (JCCRM 611) via JSCC
| [11] | Kohzuma T, Yamamoto T, Uematsu Y, Shihabi ZK, Freedman BI. Basic performance of an enzymatic method for glycated albumin and reference range determination. Journal of diabetes science and technology. 2011; 5(6): 1455-62. https://doi.org/10.1177/193229681100500628 |
| [12] | Hall V, Thomsen RW, Henriksen O, Lohse N. Diabetes in Sub Saharan Africa 1999-2011: Epidemiology and public health implications. A systematic review. BMC public health. 2011; 11(1): 1-2. https://doi.org/10.1186/1471-2458-11-564 |
| [13] | Ding N, Kwak L, Ballew SH, Jaar B, Hoogeveen RC, Ballantyne CM et al. Traditional and nontraditional glycaemic markers and risk of peripheral artery disease: The Atherosclerosis Risk in Communities (ARIC) study. Atherosclerosis 2018; 274: 86-93. https://doi.org/10.1016/j.atherosclerosis.2018.04.042 |
| [14] | Lu JM, Ji LN, Li YF, Li QM, Lin SS, Lv XF et al. Glycated albumin is superior to glycated hemoglobin for glycemic control assessment at an early stage of diabetes treatment: A multicenter, prospective study. Journal of Diabetes and its Complications. 2016; 30(8): 1609-13. |
[11-14]
The principle of this test is based on endogenous glycated amino acids first being eliminated by ketoamine oxidase and peroxidase. GA is then hydrolyzed to amino acid or peptide by an albumin-specific proteinase and then glycated amino acid or peptide is oxidized by Ketoamine oxidase producing hydrogen peroxide, which is measured colorimetrically at 546/700nm; the concentration of which is directly proportional to that of GA present in the sample. Albumin concentration Is measured simultaneously in a separate reaction, where sample reacts with pretreatment solution to convert reduced albumin to oxidized albumin. The treated solution reacts with Bromocresol Green (BCG) forming a blue conjugate of albumin and BCG. The absorbance of this blue conjugate is measured to quantify albumin concentration at 600/660nm. GA% = GA concentration/Albumin concentration *100
| [11] | Kohzuma T, Yamamoto T, Uematsu Y, Shihabi ZK, Freedman BI. Basic performance of an enzymatic method for glycated albumin and reference range determination. Journal of diabetes science and technology. 2011; 5(6): 1455-62. https://doi.org/10.1177/193229681100500628 |
| [26] | Takei I, Hoshino T, Tominaga M, Ishibashi M, Kuwa K, Umemoto M et al. A committee on diabetes mellitus indices of Japan Society of Clinical Chemistry-recommended reference measurement procedure for glycated albumin determination. Ann Clin Biochem. 2016; 53(pt 1): 124-132. https://doi.org/10.1177/0004563215599178 |
[11, 26]
.
Data collected was entered into Microsoft Excel sheet and thereafter imported into statistical package for social sciences (SPSS) version 23 for analysis. Parameters (FPG, HbA1c, GA and Albumin) were evaluated for normality using the Kolmogorov – Smirnov test. Chi-square was used to compare categorical variables between case and control groups. Mean were compared using students t-test and where the data was skewed, Mann Whitney u-test was used to compare median between cases and control. Spearman’s test was used for correlation analysis between GA and HbA1c/FPG. Receiver operating characteristic (ROC) curves were plotted to determine the diagnostic performance of glycaemic markers (GA, HbA1c and FPG). P-values of <0.05 was considered statistically significant and a confidence interval of 95% was used.
3. Results
The demographic and biochemical characteristics of the study participants are represented in
Tables 1-2 and
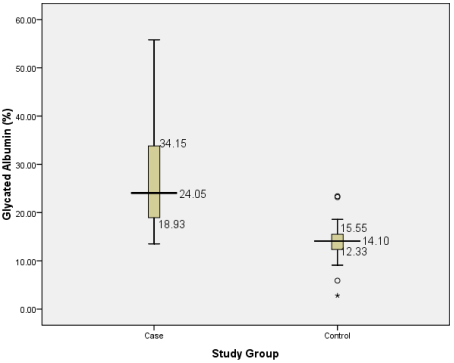
Figure 1. 36% were males, with mean age of 57±10 and 48±10 for the case and control groups respectively. The mean values of GA, FPG and HbA1c are significantly higher among the case group (27.3%, 8.0mmol/L and 9.0% respectively) compared to the control group (14.0%, 4.4mmol/L and 5.5%). Albumin concentration was however higher in the control group.
Table 1. Sex and Age distribution of study participants.
Variable | Study Group | Total | Test | P-value |
Case | Control |
Sex | | | | X2= 0.000 | 1.000 |
Female | 63 (63.0) | 63 (63.0) | 139 (63.6) | | |
Male | 37 (37.0) | 37 (37.0) | 81 (36.4) | | |
Age group (years) | | | | X2=87.130 | <0.001* |
<40 | 16 (16.0) | 45 (37.5) | 61 (27.7) | | |
40-50 | 18 (18.0) | 37 (30.8) | 55 (25.0) | | |
50-59 | 38 (38.0) | 33 (27.5) | 71 (32.0) | | |
60 | 28 (28.0) | 5 (4.2) | 33 (15.0) | | |
Mean±SD | 57.29±10.35 | 48.98±10.52 | | T-11.052 | <0.001* |
SD= Standard deviation X2=chi-square test *=statistically significant
Table 2. Median and Interquartile Range of Biochemical Parameters of Study Participants.
Parameter | Study group Median (IQR)) | U-test | p-value |
Case | Control | Total |
HbA1c (%) | 7.85 (6.93-10.50) | 5.55 (4.80-5.98) | 6.50 (5.50-7.85) | 465.000 | <0.001* |
FPG (mmol/L) | 5.95 (4.73-8.58) | 4.40 (4.10-4.78) | 4.75 (4.3-5.98) | 1737.000 | <0.001* |
ALBUMIN (g/L) | 38.0 (36.0-40s.0) | 40.0 (38.0-44.0) | 39.0 (37.0-41.0) | 2535.000 | <0.001* |
GA (%) | 24.05 (18.93-34.15) | 14.1 (12.33-15.55) | 16.85 (14.10-24.13) | 407.500 | <0.001* |
IQR= Interquartile range *= statistically significant
U=Mann-Whitney test HbA1c = Glycated haemoglobin FPG = Fasting Plasma Glucose
Figure 1. Box-plot showing distribution of GA in Study Participants.
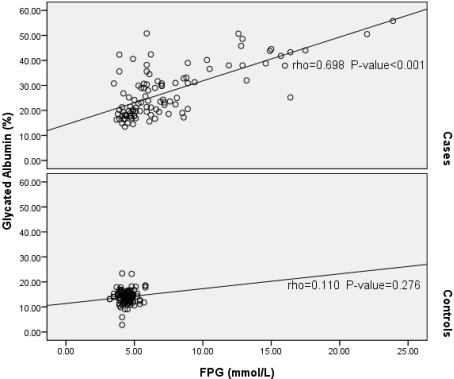
Figure 2. Scatter-plot showing correlation between GA and FPG.
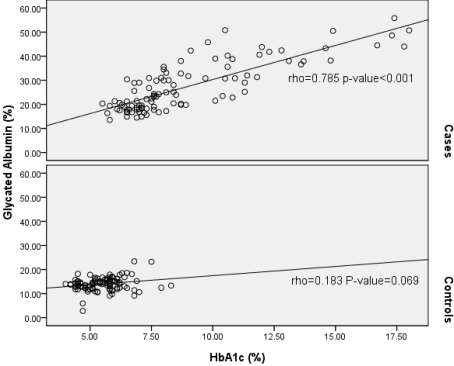
Figure 3. Correlation between GA with HbA1c.
On correlation analysis, GA had significant and positive correlation with FPG levels (rho = 0.698 p-value <0.001) among T2DM. However, the correlation in the control group was positive but insignificant (rho = 0.110, p-value = 0.276). GA showed a significant positive correlation with HbA1c among T2DM patients (rho = 0.785, p-value <0.001), and a positive but weak correlation among the control group (rho = 0.183; p-value = 0.069).
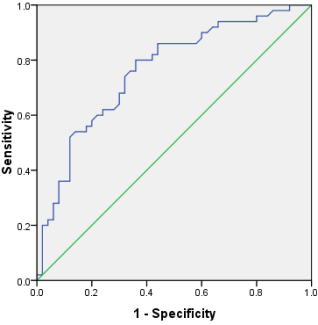
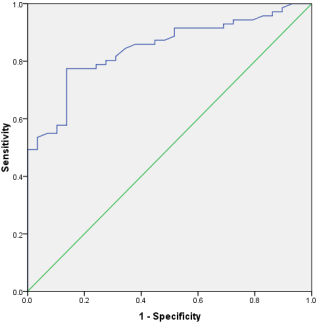
Figure 4. ROC Curve of GA with FPG as Reference Test.
Table 3. Sensitivity and specificity for GA.
| Area under the curve | p-value |
| 0.762 | <0.001 |
Cut-off | Sensitivity | 1-specificity |
12.33 | 1.000 | 1.000 |
14.10 | 1.000 | 0.980 |
15.55 | 1.000 | 0.920 |
Table 4. Sensitivity and specificity for HbA1c.
| Area under the curve | p-value |
| 0.845 | <0.001 |
Cut-off | Sensitivity | 1-specificity |
12.33 | 1.000 | 1.000 |
14.10 | 1.000 | 0.966 |
15.55 | 0.986 | 0.897 |
12.33=25th percentile 1 4.10=50thpercentile 15.55=75th percentile
Figure 5. ROC Curve for HbA1c with FPG as Reference Test.
ROC analysis was performed to assess the diagnostic efficiency of GA in comparison to FPG and HbA1c. GA had an AUC of 0.672 (0.712 – 0.832) 95% CI, P<0.001) when FPG was used as reference. The AUC for GA was higher with HbA1c as reference; AUC 0.845 at 95% CI (0.795 – 0.895) p<0.001). A regression analysis showed that a unit increase (1%) in HbA1c will result in a corresponding 2.83 times increase in GA.
4. Discussion
We have been unable to lay hands on any study done to evaluate the clinical utility of GA in T2DM in a Nigerian population. Several studies have revealed that GA is a useful alternative to HbA1c under conditions wherein the latter does not reflect glycaemic status accurately
| [11] | Kohzuma T, Yamamoto T, Uematsu Y, Shihabi ZK, Freedman BI. Basic performance of an enzymatic method for glycated albumin and reference range determination. Journal of diabetes science and technology. 2011; 5(6): 1455-62. https://doi.org/10.1177/193229681100500628 |
| [20] | Koga M, Kasayama S. Clinical impact of glycated albumin as another glycemic control marker. Endocrine journal. 2010; 57(9): 751–62. https://doi.org/10.1507/endocrj.K09-139 |
| [21] | Inaba M, Okuno S, Kumeda Y, Yamada S, Imanishi Y, Tabata T et al. Glycated albumin is a better glycemic indicator than glycated hemoglobin values in hemodialysis patients with diabetes: effect of anemia and erythropoietin injection. Journal of the American Society of Nephrology. 2007; 18(3): 896-903. https://doi.org/10.1681/ASN.2006040381 |
| [22] | Nathan DM, McGee P, Steffes MW, Lachin JM. DCCT/EDIC Research Group. Relationship of glycated albumin to blood glucose and HbA1c values and to retinopathy, nephropathy, and cardiovascular outcomes in the DCCT/EDIC study. Diabetes. 2014; 63(1): 282-290. https://doi.org/10.2337/db13-0836 |
| [23] | Selvin E, Francis LM, Ballantyne CM, Hoogeveen RC, Coresh J, Brancati FL et al. Nontraditional markers of glycemia: associations with microvascular conditions. Diabetes care. 2011; 34(4): 960-7. https://doi.org/10.2337/dc10-2070 |
[11, 20-23]
. However, majority of the studies are those carried out in Asian subjects reporting on the validity of GA test in monitoring and diagnosis of T2DM
| [30] | Hashimoto K, Koga M. Indicators of glycemic control in patients with gestational diabetes mellitus and pregnant women with diabetes mellitus. World journal of diabetes. 2015; 6(8): 1045. |
| [32] | Ciaccio M. Introduction of glycated albumin in clinical practice. J Lab Precis Med. 2019; 4: 28. https://doi.org/10.21037/jlpm.2019.08.02 |
| [33] | Hsu P, Ai M, Kanda E. A compasrison of glycated albumin and glycosylated haemoglobin for the screening of diabetes in Taiwan. Atherosclerosis 2015; 242: 327-333. https://doi.org/10.1016/j.atherosclerosis.2015.07.037 |
[30, 32, 33]
, very few studies have been done in African population with none existing for Nigeria
.
In this study, GA showed a strong positive correlation with both HbA1c and Fasting Plasma Glucose in patients with T2DM (rho = 0.785, p<0.001 and rho = 0.689, p<0.001 respectively). This significant correlation confirms that GA as an indicator of protein glycation is comparable to HbA1c in its ability to evaluate mean glucose control and that GA formation is directly dependent on protein (albumin) exposure to glucose
| [9] | Danese E, Montagnana M, Nouvenne A, Lippi G. Advantages and pitfalls of fructosamine and glycated albumin in the diagnosis and treatment of diabetes. Journal of diabetes science and technology. 2015 14; 9(2): 169-76. https://doi.org/10.1177/193229681462227 |
| [19] | Masumoto N, Otsuki H, Iwakawa S, Inada S, Koga M. Usefulness of glycated albumin in decisions regarding the discontinuation of a diabetes drug and factors associated with poor glycemic control following discontinuation in patients with type 2 diabetes mellitus. Diabetology international. 2017; 8(1): 39-44. |
[9, 19]
, supporting further the stronger correlation of GA and HbA1c compared to that with FPG. GA and HbA1c are glycaemic markers that reflect mean blood glucose control but over different time periods. HbA1c measurement is considered the gold standard in the monitoring of mean glycaemic control over the preceding 2–3 months, whereas GA reflects glycaemic control over the preceding 2–3 weeks
| [7] | International Expert Committee Report on the Role of A1c Assay in the Diagnosis of Diabetes. Diabetes care. 2009; 32(1): 1327-1334. https://doi.org/10.2337/dc09-9033 |
| [9] | Danese E, Montagnana M, Nouvenne A, Lippi G. Advantages and pitfalls of fructosamine and glycated albumin in the diagnosis and treatment of diabetes. Journal of diabetes science and technology. 2015 14; 9(2): 169-76. https://doi.org/10.1177/193229681462227 |
| [13] | Ding N, Kwak L, Ballew SH, Jaar B, Hoogeveen RC, Ballantyne CM et al. Traditional and nontraditional glycaemic markers and risk of peripheral artery disease: The Atherosclerosis Risk in Communities (ARIC) study. Atherosclerosis 2018; 274: 86-93. https://doi.org/10.1016/j.atherosclerosis.2018.04.042 |
| [16] | Arasteh A, Farahi S, Habibi-Rezaei M, Moosavi-Movahedi AA. Glycated albumin: an overview of the in Vitro models of an in Vivo potential disease marker. J Diabetes Metab Disord. 2014; 13:(49): 2251-6581. |
| [18] | Freitas PA, Ehlert LR, Camargo JL. Glycated albumin: a potential biomarker in diabetes. Archives of endocrinology and metabolism. 2017; 61: 296-304. https://doi.org/10.15386/mpr-1743 |
[7, 9, 13, 16, 18]
.
The significant and positive correlation from this study is in keeping with results from several studies where GA showed good correlation with HbA1c in T2DM patients. Testa et al
| [27] | Testa R, Ceriotti F, Guerra E, Bonfigli AR, Boemi M, Cucchi M et al. Glycated albumin: correlation to HbA1c and preliminary reference interval evaluation. Clinical Chemistry and Laboratory Medicine (CCLM). 2017; 55(2): e31-3. https://doi.org/10.1515/cclm-2016-0512 |
[27]
, in a cohort study involving T2DM patients reported that GA correlated well with HbA1c (r = 0.95, p<0.001). Similar report was given by Nathan et al when samples from the DCCT/EDIC study were analysed showing a significant and positive correlation of GA with HbA1c (r =0.75, p<0.001)
| [22] | Nathan DM, McGee P, Steffes MW, Lachin JM. DCCT/EDIC Research Group. Relationship of glycated albumin to blood glucose and HbA1c values and to retinopathy, nephropathy, and cardiovascular outcomes in the DCCT/EDIC study. Diabetes. 2014; 63(1): 282-290. https://doi.org/10.2337/db13-0836 |
[22]
A weak correlation was however observed between GA and HbA1c in the control group, and this is at variance with previous studies that reported a strong correlation between GA and HbA1c even in normal healthy control
. Mo et al in a multicenter cross-sectional study in a Chinese population involving 953 diabetics and non-diabetics found that GA had a significant and positive correlation with HbA1c both in T2DM patients and non-diabetics (r = 0.832, p<0.001)
| [28] | Mo Y, Max M, Li H, Ran X, Yang W, Li Q et al. Relationship between Glycated Albumin and Glycated Haemoglobin according to Glucose Tolerance status: A multicenter study. Diabetes Res. Clin Pract. 2016; 115: 17-23. https://doi.org/10.1016/j.diabres.2016.04.021 |
| [31] | Ciobanu DM, Bogdau F, Patrut CI, Roman G. Glycated albumin is correlated with glycated haemoglobin in Type 2 diabetes. Med Pharm Rep. 2019; 929(2): 134-138. |
[28, 31]
. Furthermore, such data in subjects without diabetes are scarce in literature. However, since healthy individuals are supposed to have low glucose variations, a weak association between GA and FPG may be expected.
The linear regression analysis showed that GA level could be estimated by multiplying HbA1c by 2.83. This simple calculation can be useful by clinicians for the interpretation of conflicting results among glycaemic markers. Based on the proposed equation of GA=2.83*HbA1c, the HbA1c target of good control set at less than 7.0% can be converted into 19.8% GA, which can be used in the monitoring of DM patients. The clinical utility of GA is however not limited to glycaemic control monitoring but has been extended to screening and diagnosis of DM. Several studies have reported on the use of GA in the diagnosis of DM. Furusyo et al in a large population-based cohort study involving 1500 subjects reported that GA showed good diagnostic performance with AUC=0.9, with the diagnosis of diabetes made based on HbA1c and FPG
| [24] | Furusyo N, Koga T, Ai M, Otokozawa S, Kohzuma T, Ikezaki H et al. Utility of glycated albumin for the diagnosis of diabetes mellitus in a Japanese population study: results from the Kyushu and Okinawa Population Study (KOPS). Diabetologia. 2011; 54(12): 3028-36. https://doi.org/10.1007/S00125-011-2297-7 |
[24]
. They suggested a cut-off value of GA for DM diagnosis as 15.5% with sensitivity and specificity of 83.3% and 83.3% respectively. Mo et al in their study reported similar AUC for GA in 1971 patients undergoing OGTT
| [28] | Mo Y, Max M, Li H, Ran X, Yang W, Li Q et al. Relationship between Glycated Albumin and Glycated Haemoglobin according to Glucose Tolerance status: A multicenter study. Diabetes Res. Clin Pract. 2016; 115: 17-23. https://doi.org/10.1016/j.diabres.2016.04.021 |
[28]
. They used FPG>6.1mmol/L and found that GA > 17.1% had a sensitivity and specificity of 84.7% and 95% respectively in screening DM and that the introduction of GA could lead to 76% reduction in additional need for OGTT for DM diagnosis.
In this study, GA showed diagnostic performance comparable with the above studies. When HbA1c was used as a reference test, GA presented an AUC=0.845 at a cut-off value of 15.55%, with sensitivity and specificity of 98.6% and 87.7% respectively. Based on the proposed equation GA=HbA1c*2.83, the cut-off value for HbA1c 6.5% used in the diagnosis of DM can be converted to 18.3%, which is above the proposed cut-off value of 15.55% translating to having 20 cases in the normal control group having high values of GA. This discrepancy in the result for the diagnosis of DM in the normal control group may be due to the fact that GA is yet to be included as a standard diagnostic parameter for DM
| [23] | Selvin E, Francis LM, Ballantyne CM, Hoogeveen RC, Coresh J, Brancati FL et al. Nontraditional markers of glycemia: associations with microvascular conditions. Diabetes care. 2011; 34(4): 960-7. https://doi.org/10.2337/dc10-2070 |
| [25] | Yang C, Li H, Wang Z, Zhang W, Zhou K, Meng J et al. Glycated albumin is a potential diagnostic tool for diabetes mellitus. Clin Med (Lond). 2012; 12(6): 568-571. https://doi.org/10.7861/clinmedicine.12-6-568 |
| [29] | Elizabeth S, Michael WS, Frederick LB. Racial differences in glycaemic markers: a cross-sectional analysis of community-based data. Ann Intern Med. 2011; 154(5): 303-309. https://doi.org/10.7326/0003-4819-154-5-201103010-00004 |
[23, 25, 29]
. This therefore calls for more in-depth research on this promising marker.
Based on FPG, GA presented an AUC=0.762 at an optimal cut-off of 15.6%, with a sensitivity and specificity of 100% and 92% respectively. GA was able to identify all patients with hyperglycaemia (FPG>7mmol/L). Erasmus et al
| [6] | George JA, Erasmus RT. Haemoglobin A1c or Glycated Albumin for Diagnosis and Monitoring Diabetes: An African Perspective. Ind J Clin Biochem. 2018; 33(3): 255-261. https://doi.org/10.1007/s12291-018-0755-9 |
[6]
in their study reported that GA was a strong and better predictor of postprandial glucose levels compared with HbA1c. Similar finding was reported by another study where GA showed an AUC=0.86 for the diagnosis of DM based on 2HPG with an optimal cut-off of 15%
.
5. Conclusion / Recommendation
This study showed that GA correlates significantly with both HbA1c and FPG in patients with T2DM. GA also had diagnostic performance comparable to those of HbA1c and FPG in discriminating patients with hyperglycaemia and normoglycaemia. Even though HbA1c has been established as the gold standard in the long-term monitoring of diabetes mellitus control, GA might be a useful complementary biomarker for short to intermediate term blood glucose monitoring, and it will be particularly important in situations when HbA1c test may be unreliable (e.g. haemoglobinopathies, anaemia, CKD, pregnancy, etc.) or when faster clinical decisions are required e.g. when a change of therapy is considered. GA assay is also cheaper compared with that of HbA1c and can be ordered together with other routine chemistry tests since it is assayed from serum/plasma without the need for separate collection bottle.
There is however a need, to further investigate the potential of GA as an alternative marker of glycaemic especially given the discrepancies in the cut-off values from various studies and in our environment, using larger studies cutting across all regions and ethnic groups. This will enable the incorporation of GA for routine use in monitoring and possibly for diagnosis of DM.
Author Contributions
Solomon Mercy Luka: Conceptualization, Investigation, Methodology, Writing – original draft, Writing – review & editing
Ayuba Affi Ishaku: Supervision, Writing – review & editing
Odoh Gabriel: Conceptualization, Supervision, Writing – review & editing
Abdulazis Longwap Saleh: Resources, Validation
Imoh Chidiebere Lucius: Supervision, Writing – review & editing
Lukden Mawun Stephen: Resoutces, Validation
Isichei Christian Ogoegbunem: Supervision, Writing- review and editing