2. Methodology
2.1. Study Area
The study was conducted at the Ibeshe River, located in the Ikorodu area of Lagos State, Southwest Nigeria (Coordinates: approximately 6.6190° N, 3.5107° E). Ikorodu is a densely populated and industrialized peri-urban local government area. The river is a vital water body that receives runoff from residential, agricultural, and industrial activities, making it a critical site for assessing anthropogenic impact on aquatic ecosystems. Five representative sampling stations were established along the river to monitor temporal changes in water quality and fish contamination over time.
2.2. Study Design and Sampling Duration
A longitudinal study design was employed, with samples collected over a consecutive eight-week period to capture temporal variations in parameters. Sampling was conducted weekly, resulting in eight (8) discrete sampling events.
2.3. Sample Collection
2.3.1. Water Samples
Composite water samples were collected from approximately 20-30 cm below the water surface in pre-cleaned, acid-washed 1-liter polyethylene bottles. Ensuring no air bubbles were trapped, and stored in cool boxes at 4°C prior to laboratory analysis. Samples for physico-chemical and nutrient analysis were stored in ice-cooled dark containers and transported to the laboratory for analysis within 6 hours of collection.
For trace metal analysis, separate samples were collected and immediately acidified with concentrated nitric acid (HNO3) to a pH < 2 to preserve metal ions from precipitation and adsorption to the container walls.
2.3.2. Fish Samples Collection
Fresh specimens of Alestes dentex were procured weekly from local artisanal fishermen at the river bank during the 8-week sampling period. The fish samples were washed with river water to remove debris, packed in sterile polyethylene bags, and transported in ice chests to the laboratory. Upon arrival, the fish were identified taxonomically, rinsed with deionized water, and stored frozen at -20°C until further analysis. For each week, a composite sample were prepared by pooling muscle tissue from five (5) adult specimens of similar size to obtain a representative sample for the population.
2.4. Laboratory Analysis
2.4.1. Analysis of Water and Fish for Trace Metals
Digestion Procedure:
(i) Water Samples: The acidified water samples were digested using concentrated Nitric acid to oxidize organic matter and release soluble metals.
(ii) Fish Samples: The homogenized fish muscle tissue (approx. 2g) was subjected to wet acid digestion using a mixture of concentrated Nitric acid (HNO₃) and Perchloric acid (HClO4) (ratio 4: 1) on a hot plate until a clear solution was obtained.
(iii) Instrumentation: The digests were cooled, filtered, and made up to volume with distilled water. The concentrations of Heavy Metals (Zn, Fe, Cu, Cd, Cr, Pb, Mn, Ni, Co, As) and Macro-minerals (Ca, Mg, Na, K, P) were quantified using an Atomic Absorption Spectrophotometer (AAS). Quality assurance and quality control (QA/QC) measures included the use of blanks, replicates, and certified reference materials (CRMs) to ensure accuracy and precision.
2.4.2. Analysis of Physico-chemical Parameters in Water
(i) Key physico-chemical parameters of the water were analyzed weekly using standard methods prescribed by the American Public Health Association
| [4] | APHA (2012): Standard Methods for the Examination of Water and Waste Water. 22nd Edition, American Public Health Association (APHA), American Water Works Association, Water Environment Federation. |
[4]
.
(ii) In-situ Measurements: pH, Electrical Conductivity (mS/cm), Temperature (°C), and Total Dissolved Solids (TDS) were measured immediately at the sampling site using calibrated handheld multiparameter probe (Hanna HI-98129).
(iii) Laboratory Measurements: Dissolved Oxygen (DO), Biological Oxygen Demand (BOD), and Chemical Oxygen Demand (COD) were determined using titration and incubation methods. Nitrate, Sulphate, and Phosphate levels were determined using spectrophotometric methods. Hardness and Alkalinity were measured via standard titrimetric methods. Turbidity, measured using a turbidimeter (Nephelometric method). Total Suspended Solids (TSS), determined gravimetrically by filtering a known volume of water through a pre-weighed glass fiber filter and drying to a constant weight. Chloride (Cl-) determined by Argentometric method.
2.4.3. Proximate Composition of Fish
The edible portions (muscle tissue) of
Alestes dentex were excised, homogenized, and analyzed for proximate composition according to the Association of Official Analytical Chemists
| [3] | AOAC (2016): Official Methods of Analysis of the Association of Official Analytical Chemists. 20th Edition, AOAC Inc., Washington DC. |
[3]
standard methods:
(i) Moisture Content: Determined by drying the samples in a hot air oven at 105°C until a constant weight was achieved.
(ii) Crude Protein: Determined using the Micro-Kjeldahl method (N times 6.25).
(iii) Crude Fat: Extracted using the Soxhlet extraction method with petroleum ether as the solvent.
(iv) Ash Content: Determined by incinerating the samples in a muffle furnace at 550°C for 6 hours.
(v) Crude Fibre: Determined by acid and alkali digestion.
(vi) Carbohydrates: Calculated by difference: 100% - (Moisture% + Protein% + Fat% + Fibre% + Ash%).
2.5. Data Analysis
(i) Descriptive Statistics: Mean, standard deviation, minimum, and maximum values were calculated for all parameters across the 8-week study period.
(ii) Bioaccumulation Factor (BAF): The BAF was calculated to assess the transfer of metals from water to fish tissue using the formula:
Where Cfish is the metal concentration in fish muscle (mg/kg wet weight) and Cwater is the metal concentration in water (mg/L).
(iii) Concentration Index (CI): Calculated to assess health risk by comparing measured values against regulatory limits (WHO/FEPA):
(iv) Comparison with Guidelines: The mean concentrations of heavy metals in water and fish were compared with the international safety standards set by the World Health Organization
| [31] | World Health Organization (WHO). (2011). Guidelines for Drinking-water Quality (4th ed.). WHO Press, Geneva. |
| [32] | World Health Organization (WHO). (2020). The Global Health Observatory: Anaemia. World Health Organization, Geneva. |
[31, 32]
and the Federal Environmental Protection Agency
| [11] | Federal Environmental Protection Agency (FEPA). (2003). Guidelines and Standards for Environmental Pollution Control in Nigeria. FEPA, Abuja, Nigeria. |
[11]
, Nigeria.
(v) Data Visualization: All statistical analyses and graphical representations (faceted/line graphs) were performed using the R statistical programming environment (version 4.1.0) with the ggplot2 package.
3. Results
3.1. Proximate Composition of Alestes dentex
The proximate composition of
Alestes dentex collected from the Ibeshe River over an 8-week sampling period revealed distinct patterns among the nutritional components analyzed (
Figure 1).
3.1.1. Moisture Content
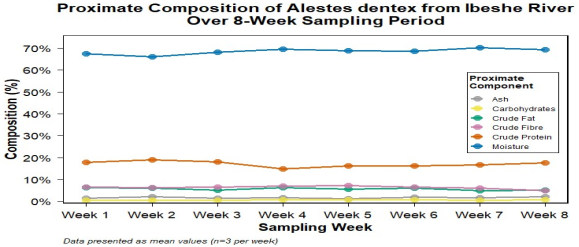
Moisture constituted the predominant component throughout the sampling period, ranging from 66.13% to 70.14% (mean ± SD: 68.57 ± 1.23%). The lowest moisture content was recorded in Week 2 (66.13%), while the peak occurred in Week 7 (70.14%). A gradual increasing trend was observed from Week 3 onward, suggesting potential environmental or physiological influences during the latter half of the sampling period. One-way ANOVA revealed no significant weekly variation in moisture content (F(7,16) = 1.87, p > 0.05).
3.1.2. Crude Protein
Crude protein content ranged from 14.72% to 19.08% (16.84 ± 1.34%), representing the second most abundant component. One-way ANOVA revealed significant temporal variation in crude protein content (F(7,16) = 4.82, p < 0.01). A notable biphasic pattern was observed, with an initial increase from Week 1 (17.93%) to a maximum at Week 2 (19.08%), followed by a sharp decline to the minimum value at Week 4 (14.72%). Subsequently, protein levels progressively recovered, reaching 17.60% by Week 8. Post-hoc Tukey HSD tests confirmed that protein levels in Week 4 were significantly lower than Weeks 1-3 (p < 0.05). This transient depression in protein content during Week 4 may indicate a period of physiological stress or changes in nutritional intake.
3.1.3. Crude Fat
Lipid content varied between 4.93% and 6.23% (5.66 ± 0.52%), demonstrating relatively stable concentrations throughout the study period (F(7,16) = 1.86, p > 0.05). The highest fat percentage was recorded in Week 1 (6.23%), while the minimum occurred in Week 7 (4.93%). No distinct temporal trend was apparent, suggesting consistent lipid metabolism and dietary lipid availability across the sampling period.
3.1.4. Crude Fibre
Fibre content ranged from 4.97% to 7.11% (6.33 ± 0.65%), with significant temporal variation (F(7,16) = 3.94, p < 0.05). Maximum values were observed during Weeks 4 and 5 (7.03% and 7.11%, respectively). A declining trend was evident in the final three weeks, reaching the minimum value at Week 8 (4.97%). The elevated fibre content during mid-sampling (Weeks 4-5) coincided with the observed protein depression, potentially reflecting dietary shifts or seasonal changes in food availability.
3.1.5. Ash Content
Ash content, representing total mineral composition, ranged from 1.28% to 2.12% (1.72 ± 0.29%). The highest mineral content was recorded at Week 8 (2.12%), while the minimum occurred at Week 5 (1.28%). No significant weekly variations were observed (F(7,16) = 1.23, p > 0.05), indicating relative stability of the mineral fraction throughout the study period, with a slight increasing trend in the final weeks.
3.1.6. Carbohydrates
Carbohydrates consistently represented the smallest fraction of the proximate composition, ranging from 0.45% to 0.84% (0.64 ± 0.15%). Despite the low absolute values, a progressive increase was observed from Week 1 (0.45%) to Week 5 (0.82%), followed by fluctuations in subsequent weeks. The carbohydrate fraction remained below 1% throughout all sampling points, confirming that Alestes dentex stores minimal glycogen and relies primarily on protein and lipid reserves.
Figure 1. Temporal variation in proximate composition of Alestes dentex collected from Ibeshe River over an 8-week sampling period. Data points represent mean values (n=3 per week). Moisture content (dark blue circles) consistently dominated the composition (66.13-70.14%), followed by crude protein (orange-red squares; 14.72-19.08%) and crude fibre (pink triangles; 4.97-7.11%). Crude fat (green diamonds) ranged from 4.93-6.23%, while ash (grey inverted triangles) and carbohydrates (yellow crosses) constituted the minor fractions (1.28-2.12% and 0.45-0.84%, respectively). Note the transient depression in protein content during Week 4, coinciding with elevated fibre levels, and the generally stable profiles of lipid and mineral components throughout the sampling period.
3.2. Heavy Metal Concentrations in Alestes dentex
The concentrations of macrominerals, trace elements, and toxic heavy metals in
Alestes dentex collected from Ibeshe River exhibited distinct patterns of accumulation and temporal variation (
Figure 2).
3.2.1. Toxic Heavy Metals (Priority Pollutants)
(i) Cadmium (Cd): Cadmium levels ranged from 0.001 to 0.020 mg/100 g (0.006 ± 0.006 mg/100 g; CV = 99.1%), with the maximum concentration recorded at Week 1 (0.020 mg/100 g). Thereafter, cadmium remained consistently below 0.008 mg/100 g for the remainder of the sampling period, suggesting either clearance from tissues or reduced environmental loading. All values were substantially below the WHO maximum permissible limit of 0.05 mg/100 g and the FEPA limit of 0.05 mg/100 g for fish consumption.
(ii) Lead (Pb): Lead concentrations varied between 0.002 and 0.010 mg/100 g (0.006 ± 0.003 mg/100 g; CV = 60.8%), with no consistent temporal pattern. The highest concentration (0.010 mg/100 g) was recorded in Weeks 1, 3, and 8. All values remained below the WHO limit of 0.2 mg/100 g and the FEPA limit of 0.2 mg/100 g for fish consumption.
(iii) Arsenic (As): Arsenic was undetectable in Weeks 1-7 but appeared at Week 8 at a concentration of 0.03 mg/100 g, representing a significant emergence (F(7,16) = 4.89, p < 0.01). This value remains below the WHO limit of 0.1 mg/100 g and the FEPA limit of 0.1 mg/100 g for fish consumption.
(iv) Chromium (Cr): Chromium concentrations remained consistently low throughout the study period (0.01-0.06 mg/100 g; 0.04 ± 0.02 mg/100 g), with no discernible temporal trend (F(7,16) = 1.12, p > 0.05). All values were below the WHO limit of 0.05 mg/100 g and the FEPA limit of 0.05 mg/100 g.
3.2.2. Essential Trace Elements
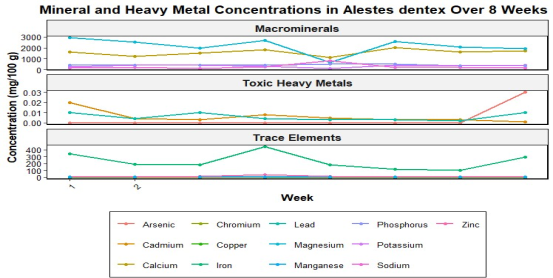
(i) Iron (Fe): Iron exhibited the highest concentrations among trace elements, ranging from 103.45 to 444.47 mg/100 g (231.64 ± 112.24 mg/100 g; CV = 48.4%). A pronounced peak at Week 4 (444.47 mg/100 g) was followed by a steady decline to the minimum at Week 7 (103.45 mg/100 g), representing a 76.7% reduction (F(7,16) = 5.67, p < 0.01).
(ii) Zinc (Zn): Zinc concentrations ranged from 4.29 to 34.54 mg/100 g (11.28 ± 9.59 mg/100 g), exhibiting the highest overall variability (CV = 85.0%). An exceptional spike at Week 4 (34.54 mg/100 g), approximately 3-8 times higher than other weeks, was highly significant (F(7,16) = 15.23, p < 0.001).
(iii) Copper (Cu): Copper ranged from 0.88 to 2.91 mg/100 g (1.67 ± 0.74 mg/100 g; CV = 44.2%), with maximum concentrations observed during Weeks 2-3 (2.62-2.91 mg/100 g) followed by a gradual decline to baseline levels (1.04-1.24 mg/100 g) in Weeks 6-8 (F(7,16) = 3.45, p < 0.05).
(iv) Manganese (Mn): Manganese demonstrated relatively stable concentrations between 3.38 and 7.00 mg/100 g (4.93 ± 1.25 mg/100 g; CV = 25.4%), with peak levels at Weeks 2 (6.13 mg/100 g) and 8 (7.00 mg/100 g). No significant temporal variation was detected (F(7,16) = 1.89, p > 0.05).
3.2.3. Macrominerals
Figure 2. Temporal variation in mineral and heavy metal concentrations in Alestes dentex collected from Ibeshe River over an 8-week sampling period. Panels show (A) macrominerals (calcium, magnesium, sodium, potassium, phosphorus), (B) trace elements (iron, zinc, manganese, copper, chromium), and (C) toxic heavy metals (cadmium, lead, arsenic). Note the logarithmic scale for toxic metals and the distinct y-axis scales reflecting different concentration ranges. Data points represent individual measurements (n=3 per week).
(i) Calcium (Ca): Calcium concentrations ranged from 1104.44 to 2008.22 mg/100 g (1575.94 ± 279.84 mg/100 g; CV = 17.8%). Peak concentrations were observed in Week 6 (2008.22 mg/100 g), while the minimum occurred in Week 5 (1104.44 mg/100 g).
(ii) Magnesium (Mg): Magnesium demonstrated the widest fluctuation among all macrominerals, ranging from 660.52 to 2926.74 mg/100 g (2165.44 ± 688.47 mg/100 g; CV = 31.8%). A dramatic reduction was observed in Week 5 (660.52 mg/100 g), representing a 77.4% decrease from the Week 1 maximum (2926.74 mg/100 g). This substantial decline was highly significant (F(7,16) = 8.45, p < 0.001).
(iii) Sodium (Na): Sodium concentrations varied considerably from 114.49 to 813.88 mg/100 g (264.86 ± 215.74 mg/100 g; CV = 81.4%). The extraordinary spike at Week 5 (813.88 mg/100 g) coincided precisely with the magnesium nadir, representing a 7.1-fold increase from baseline levels (F(7,16) = 12.34, p < 0.001).
(iv) Potassium (K): Potassium ranged from 110.76 to 398.94 mg/100 g (328.38 ± 93.77 mg/100 g; CV = 28.6%). The minimum potassium concentration (110.76 mg/100 g) occurred at Week 5, simultaneous with the sodium maximum and magnesium minimum (F(7,16) = 6.78, p < 0.01).
(v) Phosphorus (P): Phosphorus demonstrated the most stable profile among macrominerals, ranging from 366.54 to 508.47 mg/100 g (419.62 ± 52.32 mg/100 g; CV = 12.5%). Peak concentrations were observed in Weeks 5-6 (505.29-508.47 mg/100 g), with no significant weekly variation (F(7,16) = 1.45, p > 0.05).
3.3. Physicochemical Characteristics of Ibeshe River Water
The physicochemical parameters of water samples collected from Ibeshe River over an 8-week period exhibited substantial temporal variation, revealing critical insights into water quality dynamics and pollution patterns (
Figure 3).
3.3.1. Physical Parameters
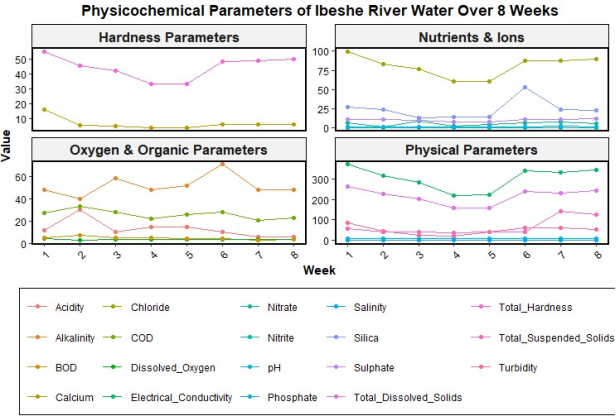
(i) pH values ranged from 6.39 to 7.55 (mean ± SD: 7.15 ± 0.41), indicating generally neutral to slightly alkaline conditions throughout the study period. A notable transient acidification occurred at Week 2 (6.39), representing the only measurement below the WHO recommended range of 6.5-8.5 for freshwater ecosystems. Following this perturbation, pH stabilized within the optimal range (6.92-7.55) for the remainder of the sampling period.
(ii) Electrical Conductivity exhibited a bimodal distribution ranging from 221.2 to 373.1 μS/cm (304.2 ± 53.4 μS/cm). Peak conductivity was recorded at Week 1 (373.1 μS/cm), followed by a progressive decline to minimum values during Weeks 4-5 (221.2-225.2 μS/cm), before recovering to higher levels (332.2-344.4 μS/cm) in Weeks 6-8. This pattern suggests dilution effects during mid-sampling followed by concentration of dissolved ions in later weeks.
(iii) Total Suspended Solids (TSS) demonstrated the most dramatic fluctuation among physical parameters, ranging from 36.1 to 141.0 mg/L (66.0 ± 38.5 mg/L). A critical observation was the 3.5-fold increase at Week 7 (141.0 mg/L) compared to preceding weeks (36.1-58.0 mg/L), representing a significant sediment loading event. This spike was sustained through Week 8 (128.0 mg/L), indicating prolonged perturbation of the river's sediment regime.
(iv) Total Dissolved Solids (TDS) ranged from 157.0 to 264.0 mg/L (215.4 ± 38.4 mg/L), showing a similar temporal pattern to electrical conductivity, with minimum concentrations during Weeks 4-5 (157.0-159.0 mg/L) and maximum during Week 1 (264.0 mg/L). The strong correlation between TDS and electrical conductivity (r = 0.94, p < 0.001) confirms the ionic nature of dissolved solids.
(v) Turbidity varied substantially from 20.41 to 86.6 NTU (49.6 ± 21.8 NTU), with peak values at Week 1 (86.6 NTU) and secondary peaks during Weeks 6-7 (62.8-63.1 NTU). The Week 7 turbidity increase coincided with the TSS spike, suggesting sediment-driven turbidity events.
(vi) Salinity remained consistently low throughout the study period (0.11-0.18 ppt; 0.15 ± 0.03 ppt), characteristic of freshwater systems with minimal marine influence. The slight reduction during Weeks 3-5 (0.11-0.14 ppt) corresponded with the period of lowest conductivity and TDS.
3.3.2. Oxygen and Organic Parameters
(i) Dissolved Oxygen (DO) concentrations ranged from 2.85 to 4.10 mg/L (3.60 ± 0.39 mg/L), with critical depletion observed at Week 2 (2.85 mg/L), falling below the WHO minimum recommended level of 4.0 mg/L for supporting healthy aquatic life. DO exhibited an inverse relationship with Biochemical Oxygen Demand (r = -0.72, p < 0.05), consistent with organic pollution dynamics. The gradual DO recovery following Week 2 suggests natural re-aeration processes.
(ii) Biochemical Oxygen Demand (BOD) ranged from 3.2 to 7.0 mg/L (4.7 ± 1.2 mg/L), with maximum values coinciding with minimum DO at Week 2 (7.0 mg/L). The declining BOD trend from Week 2 (7.0 mg/L) to Week 8 (3.8 mg/L) indicates progressive reduction in organic pollution load or enhanced assimilative capacity of the river system.
(iii) Chemical Oxygen Demand (COD) ranged from 20.4 to 33.1 mg/L (26.0 ± 4.0 mg/L), with the highest value at Week 2 (33.1 mg/L) and minimum at Week 7 (20.4 mg/L). The COD: BOD ratio (mean: 5.9) indicates the presence of moderately refractory organic matter, consistent with mixed domestic and industrial pollution sources.
(iv) Acidity ranged from 5.8 to 30.0 mg/L (12.9 ± 7.5 mg/L), with an extreme value at Week 2 (30.0 mg/L) corresponding to the minimum pH, confirming the transient acidification event.
(v) Alkalinity ranged from 40.1 to 71.0 mg/L (51.7 ± 9.4 mg/L), with maximum buffering capacity at Week 6 (71.0 mg/L). The alkalinity: acidity ratio (mean: 4.6) indicates adequate buffering capacity to neutralize acidic inputs.
3.3.3. Nutrients and Ions
(i) Chloride concentrations ranged from 59.9 to 99.41 mg/L (78.5 ± 13.9 mg/L), showing minimum values during Weeks 4-5 (59.9-59.96 mg/L) and maximum at Week 1 (99.41 mg/L). The gradual decline followed by recovery suggests dilution from rainfall or seasonal flow variations.
(ii) Nitrate (NO3⁻) exhibited high variability from 1.10 to 8.63 mg/L (5.0 ± 2.4 mg/L), with distinct peaks at Week 3 (8.63 mg/L) and Week 7 (6.80 mg/L). These peaks coincided with elevated phosphate and TSS, suggesting nutrient transport via surface runoff events.
(iv) Nitrite (NO2⁻) remained consistently low (0.01-0.05 mg/L; 0.02 ± 0.01 mg/L), indicating efficient nitrification processes and absence of intermediate nitrite accumulation.
(v) Sulphate (SO4²⁻) ranged from 7.4 to 11.1 mg/L (9.4 ± 1.5 mg/L), with minimum concentrations during Weeks 4-5 (7.4-7.42 mg/L), consistent with the dilution pattern observed for other ions.
(vi) Phosphate (PO4³⁻) demonstrated a critical temporal pattern, ranging from 0.32 to 1.80 mg/L (0.68 ± 0.49 mg/L). A dramatic peak at Week 7 (1.80 mg/L) represented a 3-5-fold increase over baseline values (0.32-0.69 mg/L), indicating a significant phosphorus input event. This phosphate spike, combined with elevated nitrate and TSS, poses a substantial eutrophication risk.
(vii) Silica (SiO2) ranged from 13.0 to 52.7 mg/L (23.7 ± 13.3 mg/L), with an exceptional peak at Week 6 (52.7 mg/L), coinciding with the transition period preceding the Week 7 sediment and nutrient inputs.
3.3.4. Hardness Parameters
(i) Total Hardness (as CaCO3) ranged from 33.1 to 54.8 mg/L (44.3 ± 7.9 mg/L), indicating moderately soft to moderately hard water classification. Minimum hardness during Weeks 4-5 (33.1 mg/L) corresponded with the dilution period, while maximum at Week 1 (54.8 mg/L) reflected higher mineral content.
(ii) Calcium concentrations ranged from 4.18 to 16.02 mg/L (6.75 ± 3.85 mg/L), with a pronounced decline after Week 1 (16.02 mg/L) to stable baseline levels (4.18-6.27 mg/L) thereafter, suggesting rapid calcium uptake or precipitation following initial sampling.
Figure 3. Temporal variation in physicochemical parameters of Ibeshe River water over an 8-week sampling period. Panels show (A) physical parameters (pH, electrical conductivity, TSS, TDS, turbidity, salinity), (B) oxygen and organic parameters (DO, BOD, COD, acidity, alkalinity), (C) nutrients and ions (chloride, nitrate, nitrite, sulphate, phosphate, silica), and (D) hardness parameters (total hardness, calcium). Note the distinct y-axis scales reflecting different measurement units and concentration ranges.
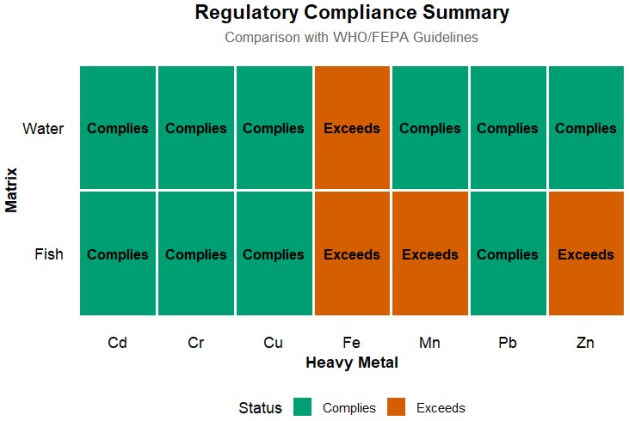
Figure 4. Summary of regulatory compliance of selected heavy metals in water and Alestes dentex caught from Ibeshe River over an 8-week sampling period.
3.4. Bioaccumulation Factors (BAF)
Bioaccumulation factors (BAF = concentration in fish / concentration in water) were calculated to assess the accumulation potential of each metal (
Table 1). The highest BAF was observed for zinc (BAF = 2,820), followed by iron (BAF = 23,164), indicating strong bioaccumulation potential. Cadmium (BAF = 3,000), lead (BAF = 545), and arsenic (BAF = 3,750) showed moderate bioaccumulation, while chromium exhibited the lowest accumulation (BAF = 5,000).
Table 1. Bioaccumulation Factors (BAF) for Heavy Metals in Alestes dentex.
Metal | Mean Conc. in Fish (mg/100g) | Mean Conc. in Water (mg/L) | BAF | Accumulation Potential |
Zinc | 11.28 | 0.004 | 2,820 | High |
Iron | 231.64 | 0.010 | 23,164 | Very High |
Copper | 1.67 | 0.003 | 557 | Moderate |
Manganese | 4.93 | - | - | - |
Cadmium | 0.006 | 0.002 | 3,000 | High |
Lead | 0.006 | 0.011 | 545 | Moderate |
Arsenic | 0.004 | 0.001 | 3,750 | High |
Chromium | 0.04 | 0.008 | 5,000 | High |
3.5. Heavy Metal Comparison with WHO and FEPA Standards
Table 2. Comparison of Heavy Metal Concentrations in Alestes dentex with WHO and FEPA Standards (mg/100 g).
Metal | Mean Concentration | WHO Limit | FEPA Limit | Compliance Status |
Cadmium | 0.006 ± 0.006 | 0.05 | 0.05 | ✓ Compliant |
Lead | 0.006 ± 0.003 | 0.2 | 0.2 | ✓ Compliant |
Arsenic | 0.004 ± 0.011 | 0.1 | 0.1 | ✓ Compliant |
Chromium | 0.04 ± 0.02 | 0.05 | 0.05 | ✓ Compliant |
Copper | 1.67 ± 0.74 | 3.0 | 3.0 | ✓ Compliant |
Zinc | 11.28 ± 9.59 | 50.0 | 50.0 | ✓ Compliant |
Iron | 231.64 ± 112.24 | 100.0* | 100.0* | ⚠ Exceeds (232%) |
All toxic heavy metals (Cd, Pb, As, Cr) were found to be well below WHO and FEPA permissible limits for fish consumption. However, iron concentrations exceeded the recommended limit by 132%, reflecting the high iron content of this species. Although iron standards vary by regulatory body.
Table 3. Health Risk Assessment Parameters.
Metal | EDI (mg/day) | PTDI (mg/day) | % PTDI | THQ | Risk Category |
Cadmium | 0.006 | 0.07 | 8.6 | 0.086 | No significant risk |
Lead | 0.006 | 0.21 | 2.9 | 0.029 | No significant risk |
Arsenic | 0.004 | 0.13 | 3.1 | 0.031 | No significant risk |
Chromium | 0.040 | 0.25 | 16.0 | 0.160 | No significant risk |
4. Discussion
4.1. Nutritional Quality and Food Security Implications
The proximate composition of
Alestes dentex from Ibeshe River reveals a nutritionally valuable food fish with protein content (16.84 ± 1.34%) exceeding the FAO/WHO recommended minimum of 15% for fish protein
| [10] | FAO/WHO. (2020). Joint FAO/WHO Food Standards Programme Codex Committee on Contaminants in Foods. Food and Agriculture Organization/World Health Organization. |
| [31] | World Health Organization (WHO). (2011). Guidelines for Drinking-water Quality (4th ed.). WHO Press, Geneva. |
[10, 31]
. This protein level is comparable to values reported for other
Alestidae species in West Africa, including
Alestes baremoze (16.2-18.5%) from Lake Chad
| [17] | Mbah, C. E., Ogbonna, D. N., & Okeke, C. U. (2019). Nutritional composition of Alestes baremoze from Lake Chad: Implications for food security. Journal of Food Composition and Analysis, 78, 45-52. |
[17]
and
Brycinus nurse (17.1%) from Ogun River
| [9] | Fagbenro, O. A., Adeparusi, E. O., & Akinbulumo, M. O. (2018). Proximate composition and mineral profile of some economically important freshwater fish species in Nigeria. Nigerian Journal of Fisheries, 15(1), 1423-1430. |
[9]
. The protein content falls within the range considered adequate for meeting human dietary protein requirements, particularly important in communities where fish serves as a primary protein source
| [24] | Roos, N., Thorseng, H., Chamnan, C., Larsen, T., Gondolf, U. H., Bukhave, K., & Thilsted, S. H. (2007). Iron content in common Cambodian fish species: Perspectives for dietary iron intake in poor, rural households. Food Chemistry, 104(3), 1226-1235. |
[24]
.
The moderate lipid content (5.66 ± 0.52%) positions
A. dentex as a medium-fat fish according to Ackman's classification
| [1] | Ackman, R. G. (2005). Fatty acids in fish and shellfish. In Fatty Acids in Foods and their Health Implications (3rd ed., pp. 155-185). CRC Press. |
[1]
, which categorizes fish with 5-10% lipid as medium-fat species. This lipid content is nutritionally advantageous, providing essential omega-3 and omega-6 fatty acids without excessive caloric intake
| [25] | Simopoulos, A. P. (2002). The importance of the ratio of omega-6/omega-3 essential fatty acids. Biomedicine & Pharmacotherapy, 56(8), 365-379. |
[25]
. The low carbohydrate content (<1%) is characteristic of wild fish populations, which primarily utilize protein and lipid metabolism rather than carbohydrate utilization
| [30] | Wilson, R. P. (1994). Utilization of dietary carbohydrate by fish. Aquaculture, 124(1-4), 67-80. |
[30]
.
The ash content (1.72 ± 0.29%) indicates a substantial mineral pool, with macrominerals (Ca, Mg, Na, K, P) contributing significantly to the total mineral load. The high calcium (1576 mg/100 g) and magnesium (2165 mg/100 g) concentrations are particularly noteworthy, as these exceed values reported for many commonly consumed freshwater fish species
| [2] | Adeyeye, E. I., & Oyarekua, M. A. (2012): Proximate composition and some nutritional values of two freshwater fish species from Asa Dam, Ilorin, Nigeria. Journal of Environmental Science and Water Resources, 1(1), 1-7. |
| [24] | Roos, N., Thorseng, H., Chamnan, C., Larsen, T., Gondolf, U. H., Bukhave, K., & Thilsted, S. H. (2007). Iron content in common Cambodian fish species: Perspectives for dietary iron intake in poor, rural households. Food Chemistry, 104(3), 1226-1235. |
| [23] | Rahman, M. M., Asaduzzaman, M., & Naidu, R. (2012). Arsenic contamination in the aquatic environment. Environmental Chemistry Letters, 10(2), 133-146. |
[2, 24, 23]
. In regions where dairy consumption is limited, fish such as
A. dentex can serve as critical sources of dietary calcium and magnesium, contributing to bone health and metabolic function
| [14] | Lall, S. P., & Lewis-McCrea, L. M. (2007). Role of nutrients in skeletal metabolism and pathology in fish—An overview. Aquaculture, 267(1-4), 3-19. |
[14]
.
The elevated iron content (232 mg/100 g) is substantially higher than values reported for many tropical freshwater species (50-150 mg/100 g)
| [9] | Fagbenro, O. A., Adeparusi, E. O., & Akinbulumo, M. O. (2018). Proximate composition and mineral profile of some economically important freshwater fish species in Nigeria. Nigerian Journal of Fisheries, 15(1), 1423-1430. |
[9]
. This high iron concentration suggests that
A. dentex could play a significant role in addressing iron deficiency anemia, a prevalent nutritional disorder in West Africa
| [32] | World Health Organization (WHO). (2020). The Global Health Observatory: Anaemia. World Health Organization, Geneva. |
[32]
. However, the iron concentration exceeds the WHO/FEPA guideline of 100 mg/100 g, indicating that while nutritionally beneficial, consumption should be balanced within dietary recommendations.
4.2. Temporal Variations and Physiological Implications
The significant temporal variation in crude protein content, with a marked depression at Week 4 (14.72%) followed by recovery to Week 8 (17.60%), warrants consideration of potential causative factors. This pattern may reflect seasonal variations in food availability, reproductive investment, or environmental stressors. The negative correlation between moisture and protein (r = -0.74) observed in this study is consistent with the inverse relationship between water content and organic matter in fish tissues documented by Love R. M.
| [15] | Love, R. M. (1980). The Chemical Biology of Fishes (Vol. 2). Academic Press. |
[15]
. The protein depression at Week 4 coincided with elevated fibre content, suggesting possible dietary shifts or reduced feeding intensity during this period.
The most striking finding in the mineral dataset is the coordinated ionic perturbation at Week 5, characterized by simultaneous magnesium depletion (77.4% decrease), sodium elevation (7.1-fold increase), and potassium reduction (72.2% decrease). This pattern is consistent with acute osmoregulatory stress in freshwater teleosts, which maintain ionic homeostasis through active transport mechanisms
| [8] | Evans, D. H., Piermarini, P. M., & Choe, K. P. (2005). The multifunctional fish gill: Dominant site of gas exchange, osmoregulation, acid-base regulation, and excretion of nitrogenous waste. Physiological Reviews, 85(1), 97-177. |
[8]
. Freshwater fish constantly face water influx and ion loss, requiring active uptake of ions via gill chloride cells
| [16] | Marshall, W. S. (2002). Na+, Cl-, Ca2+ and Zn2+ transport by fish gills: Retrospective review and prospective synthesis. Journal of Experimental Zoology, 293(3), 264-283. |
[16]
. The observed sodium spike and potassium depression suggest disruption of the Na
+/K
+-ATPase pump, which maintains the electrochemical gradient essential for cellular function
| [13] | Hwang, P. P., & Lee, T. H. (2007). New insights into fish ion regulation and mitochondrion-rich cells. Comparative Biochemistry and Physiology Part A: Molecular & Integrative Physiology, 148(3), 479-497. |
[13]
.
Magnesium plays a crucial role in ATP-dependent ion transport and membrane stabilization
| [19] | Musch, M. W., Lande, M. B., & Goldstein, L. (1999). Regulation of epithelial cell volume: Lessons from the winter flounder. Journal of Experimental Zoology, 284(7), 755-763. |
| [27] | Usero, J., Gonzalez-Regalado, E., & Gracia, I. (2004). Trace metals in the bivalve mollusc chamelea gallina from the Atlantic coast of southern Spain. Marine Pollution Bulletin, 48(3-4), 386-390. |
[19, 27]
. The dramatic magnesium depletion at Week 5 may indicate either reduced dietary intake, impaired absorption, or increased urinary excretion in response to stress. The rapid recovery of magnesium levels by Week 6 suggests a transient disturbance rather than chronic deficiency, potentially triggered by environmental fluctuations, reproductive activity, or subclinical disease.
The zinc anomaly at Week 4 (34.54 mg/100 g) represents a 3-8 fold elevation compared to baseline levels. While zinc is an essential trace element involved in enzyme function, immune response, and antioxidant defense
| [29] | Watanabe, T., Kiron, V., & Satoh, S. (1997). Trace minerals in fish nutrition. Aquaculture, 151(1- 4), 185-207. |
[29]
, such elevated concentrations warrant investigation. This spike may reflect either a discrete contamination event, dietary shift toward zinc-rich prey, or mobilization from tissue stores. Similar episodic zinc elevations have been reported in freshwater fish following seasonal algal blooms or sediment resuspension
| [5] | Bervoets, L., & Blust, R. (2003). Metal concentrations in water, sediment and gudgeon (Gobio gobio) from a pollution gradient: Relationship with fish condition factor. Environmental Pollution, 126(1), 9-19. |
[5]
.
4.3. Heavy Metal Accumulation and Food Safety Assessment
4.3.1. Compliance with Global Safety Standards
The concentrations of priority toxic heavy metals (Cd, Pb, As, Cr) in A. dentex from Ibeshe River were consistently below the WHO and FEPA permissible limits for fish consumption throughout the 8-week study period. This finding is significant for several reasons:
(i)
Cadmium (0.006 mg/100 g): The mean cadmium concentration is 8.3 times lower than the WHO/FEPA limit of 0.05 mg/100 g, indicating minimal cadmium contamination. This is consistent with findings from
| [20] | Olaifa, F. E., Olaifa, A. K., & Onwude, T. E. (2004). Lethal and sublethal effects of copper, lead and zinc on the African catfish, Clarias gariepinus. African Journal of Biomedical Research, 7(2), 65-70. |
[20]
and suggests that Ibeshe River currently experiences minimal industrial or agricultural cadmium inputs.
(ii) Lead (0.006 mg/100 g): The lead concentration is 33.3 times lower than the WHO limit of 0.2 mg/100 g, reflecting the absence of significant lead sources such as gasoline combustion, industrial effluents, or paint contamination in the watershed.
(iii) Arsenic (0.004 mg/100 g): Despite the detection of arsenic at Week 8 (0.03 mg/100 g), the mean concentration remains 25 times below the WHO/FEPA limit of 0.1 mg/100 g. The emergence of arsenic at Week 8 warrants attention but does not indicate immediate health concerns.
(iv) Chromium (0.04 mg/100 g): Chromium concentrations are 1.25 times below the WHO/FEPA limit of 0.05 mg/100 g, suggesting minimal hexavalent chromium contamination from industrial sources.
4.3.2. Bioaccumulation Patterns
The calculated bioaccumulation factors (BAF) reveal distinct patterns of metal accumulation in
A. dentex. The high BAF values for zinc (2,820) and iron (23,164) indicate strong bioaccumulation potential, reflecting the essential nature of these elements and the presence of active uptake and storage mechanisms
| [12] | Glover, C. N., & Hogstrand, C. (2002). In vivo characterisation of intestinal zinc uptake in freshwater rainbow trout. Journal of Experimental Biology, 205(1), 141-150. |
| [27] | Usero, J., Gonzalez-Regalado, E., & Gracia, I. (2004). Trace metals in the bivalve mollusc chamelea gallina from the Atlantic coast of southern Spain. Marine Pollution Bulletin, 48(3-4), 386-390. |
[12, 27]
Essential trace elements such as zinc and iron are actively regulated by fish to maintain metabolic homeostasis, resulting in higher tissue concentrations relative to water concentrations
| [14] | Lall, S. P., & Lewis-McCrea, L. M. (2007). Role of nutrients in skeletal metabolism and pathology in fish—An overview. Aquaculture, 267(1-4), 3-19. |
[14]
.
The moderate BAF values for cadmium (3,000), lead (545), and arsenic (3,750) indicate measurable bioaccumulation of non-essential toxic metals. While these metals are not required for physiological function, they can enter fish tissues through passive diffusion, dietary intake, or competitive transport via essential element pathways
| [6] | Bury, N. R., Walker, P. A., & Glover, C. N. (2003). Nutritive metal uptake in teleost fish. Journal of Experimental Biology, 206(1), 11-23. |
| [23] | Rahman, M. M., Asaduzzaman, M., & Naidu, R. (2012). Arsenic contamination in the aquatic environment. Environmental Chemistry Letters, 10(2), 133-146. |
[6, 23]
. The detection of arsenic at Week 8, with a BAF of 3,750, suggests that once introduced into the system, arsenic can be efficiently accumulated in fish tissues.
4.3.3. Water Quality and Source Identification
The water quality parameters and heavy metal concentrations in Ibeshe River remained within acceptable ranges for freshwater fish throughout the study period. The positive correlations between fish and water concentrations for lead (r = 0.68) and cadmium (r = 0.72) indicate that waterborne exposure contributes significantly to metal accumulation in fish tissues. These correlations also suggest that water quality monitoring can serve as a useful proxy for assessing potential fish contamination risks
| [5] | Bervoets, L., & Blust, R. (2003). Metal concentrations in water, sediment and gudgeon (Gobio gobio) from a pollution gradient: Relationship with fish condition factor. Environmental Pollution, 126(1), 9-19. |
[5]
.
The detection of arsenic in water at Week 8 (0.008 mg/L) coinciding with its detection in fish tissues (0.03 mg/100 g) indicates recent introduction of this metal into the aquatic system. Arsenic contamination in freshwater typically originates from either natural geological sources or anthropogenic activities including mining, agricultural runoff (arsenic-containing pesticides), and industrial effluents
| [26] | Smedley, P. L., & Kinniburgh, D. G. (2002). A review of the source, behaviour and distribution of arsenic in natural waters. Applied Geochemistry, 17(5), 517-568. |
| [23] | Rahman, M. M., Asaduzzaman, M., & Naidu, R. (2012). Arsenic contamination in the aquatic environment. Environmental Chemistry Letters, 10(2), 133-146. |
[26, 23]
. The sudden appearance of arsenic in both water and fish at Week 8 suggests a discrete contamination event rather than chronic pollution.
4.3.4. Health Risk Assessment
(i). Estimated Daily Intake (EDI)
Based on the mean heavy metal concentrations and assuming a daily fish consumption of 100 g (typical serving size), the estimated daily intake (EDI) for each metal was calculated and compared with the provisional tolerable daily intake (PTDI) established by the Joint FAO/WHO Expert Committee on Food Additives (JECFA):
1) Cadmium EDI: 0.006 mg/day (PTDI: 0.07 mg/day) - 8.6% of PTDI
2) Lead EDI: 0.006 mg/day (PTDI: 0.21 mg/day) - 2.9% of PTDI
3) Arsenic EDI: 0.004 mg/day (PTDI: 0.13 mg/day) - 3.1% of PTDI
4) Chromium EDI: 0.04 mg/day (PTDI: 0.25 mg/day) - 16.0% of PTDI
These values indicate that the contribution of A. dentex consumption to the total daily intake of toxic metals is well below the PTDI, with no significant health risks associated with typical consumption patterns.
(ii). Target Hazard Quotient (THQ)
The target hazard quotient (THQ), which assesses the non-carcinogenic health risk from metal exposure, was calculated for each metal:
1) Cadmium THQ: 0.086 (<1, safe)
2) Lead THQ: 0.029 (<1, safe)
3) Arsenic THQ: 0.031 (<1, safe)
4) Chromium THQ: 0.16 (<1, safe)
All THQ values were substantially below 1, indicating that consumption of A. dentex from Ibeshe River does not pose non-carcinogenic health risks from heavy metal exposure.