2. Literature Review
Many economists have demonstrated a positive relationship between investment in human capital and economic growth. For instance, Barro und that the growth rate is positively correlated with the initial amount of human capital. Therefore, if poor countries were to have higher human capital per capita, they would tend to catch up with rich countries
| [1] | R. J. Barro, "Economic growth in a cross section of countries.," The quarterly journal of economics, vol. 106(2), pp. 407-443, 1991. |
[1]
.
Additionally, Mankiw and others concluded that a higher saving rate leads to higher income in the steady state, resulting in a higher level of human capital, even if human capital accumulation is not affected. Therefore, higher savings lead to increased total factor productivity
| [2] | Mankiw, N. Gregory, David Romer, and David N. Weil, "A contribution to the empirics of economic growth," The quarterly journal of economics,, vol. 107(2), pp. 407-437, 1992. https://doi.org/10.2307/2118477 |
[2]
. And Benhabib and others developed a model based on the growth rate that depends on the stock of human capital in the country. Tests indicated a positive relationship between human capital and growth
| [3] | Benhabib, Jess, and Mark M. Spiege, "The role of human capital in economic development evidence from aggregate cross-country data.," Journal of Monetary economics, Vols. 143-173., pp. 143-173., 1994. https://doi.org/10.1016/0304-3932(94)90047-7 |
[3]
.
In the same vein, Gundlach confirmed this finding using a growth model, the results of which showed that human capital formation has a positive effect on output per worker twice as high as the effect of physical capital formation
| [4] | E. Gundlach, "The role of human capital in economic growth: New results and alternative interpretations," Weltwirtschaftliches Archiv, pp. 383-402, 1995. https://doi.org/10.1007/BF02707441 |
[4]
. And Anoruo and others developed a model that supported a positive two-way causal relationship between economic growth and human capital
| [5] | Anoruo, Emmanuel, and Uchenna Elike, "Human Capital-Economic Growth Nexus in Africa: Heteregeneous Panel Causality Approach," International Journal of Economics and Financial Issues, Vols. 5-4, pp. 1017-1023, 2015. |
[5]
. And Siddiqui and others found that differences in growth rates between countries are attributed to differences in levels of educational progress
.
Moreover, education is one of the most important fundamental determinants in building human capital. This notion is evident in studies conducted by numerous scholars, including Adam Smith, who elucidated this concept in his writings, particularly in the book 'The Wealth of Nations.' One of his most renowned contributions was the theory of the Division of Labor and Capital Accumulation
| [7] | W. Eltis, The Classical Theory of Economic Growth, vol. Second Edition, Oxford: PAlGRAVE, 2000. |
[7]
. And Lucs emphasized the importance of human capital, considering the inadequacy of physical capital alone to achieve growth. He explained that investing in education and training results in increased productivity of workers at the individual level and fosters long-term economic growth at the macro level
| [8] | E. m. ebraheem, “The role of human capital in achieving economic growth:,” drasaat, pp. 42-43, jan 2021. |
[8]
.
An educated workforce is necessary and essential for enhancing the well-being of individuals and achieving a high social level. Therefore, education stands out as one of the most critical determinants of economic growth.
This is evident from the literature, whether employing panel data or time series analysis, as we review in the following paragraphs.
2.1. Panel Data Literature Review
literature review based on Benhabib, and others conducted an examination of cross-country evidence regarding the determinants of economic growth. They utilized estimates of physical and human capital stocks in 78 countries spanning the period 1965-1985, employing panel data analysis. Their study employed per capita income as the dependent variable and considered human capital, physical capital, population, labor force, literacy, and political instability as independent variables, applying the Ordinary Least Squares (OLS) method. The results indicated that human capital played a significant role in attracting physical capital, and there was a positive correlation between human capital and economic growth
| [3] | Benhabib, Jess, and Mark M. Spiege, "The role of human capital in economic development evidence from aggregate cross-country data.," Journal of Monetary economics, Vols. 143-173., pp. 143-173., 1994. https://doi.org/10.1016/0304-3932(94)90047-7 |
[3]
.
Akpolat examined the long-term impact of physical and human capital on Gross Domestic Product (GDP) in two groups of countries. The first group comprised 11 developing countries, while the second group consisted of 13 developed countries. This study covered the period from 1970 to 2010, with GDP as the dependent variable and Gross Fixed Capital Formation (GFCF) serving as an indicator of physical capital. Additionally, education expenditures and life expectancy at birth were used as indicators of human capital. Panel Dynamic Ordinary Least Squares (DOLS) and panel Fully Modified Ordinary Least Squares (FMOLS) were applied in the analysis. The study found that the effect of physical capital and education expenditures in developed countries was higher compared to that in developing countries. Conversely, the proxy for life expectancy at birth had a higher effect in developing countries
| [9] | A. G. Akpolat, "The long-term impact of human capital investment on GDP: a panel cointegrated regression analysis.," Economics Research International, pp. 1-10, 2014. https://doi.org/10.1155/2014/646518 |
[9]
.
Pelinescu utilized data from 2002 to 2012 in EU countries, with GDP as the dependent variable. Independent variables included spending on education as a percentage of GDP, the number of patents, exports of goods, and the number of employees in high school. The study applied the Pooled Least Squares method, and the results supported the positive role of human capital, as represented by patents and worker qualifications. Interestingly, the study found a negative relationship between education spending and GDP growth. This unexpected result was attributed to the problem of heterogeneity among countries in the sample
.
Liao investigated the causal relationship between sustainable economic growth and investment in education from 2000 to 2016 in 21 cities in Guangdong Province. The study applied the Unit Root Test, Panel Cointegration Test, and Granger Causality Test. Real GDP was used as the dependent variable, while independent variables included investment in physical capital (fixed assets), the number of people employed, real educational investment (public spending on education), and electricity consumption for each city. The study revealed an inverse causal relationship between education and economic growth and suggested that investing in local education has a positive impact depending on different areas
| [11] | L. e. a. . Liao, ""The impact of educational investment on sustainable economic growth in Guangdong, China: A cointegration and causality analysis."," Sustainability, pp. 1-16, 2019. https://doi.org/10.3390/su11030766 |
[11]
.
Bloom and others endeavored to underscore the role of higher education in economic growth within Sub-Saharan Africa from 1960 to 2000. They used enrollment numbers in higher education, population figures, investment in physical capital, and average life expectancy as independent variables. The analysis incorporated certain country-specific variables that could impact the long-term productivity of production factors, such as ethnic and linguistic differences, institutional quality, trade openness, and others. The total output was measured by multiplying the population by real GDP per capita, measured in 1985 international purchasing power parity dollars, serving as the dependent variable. They applied a non-linear estimator with lagged input growth rates and lagged output growth as instruments for current growth rates. The results affirmed that higher education offers benefits for both the public and private sectors. Additionally, investment in higher education may lead to improvements in and hastening of technology diffusion, thereby reducing the poverty gap
| [12] | Bloom, David Elliot and Kevin Chan, Higher education and economic development in Africa., Washington,: World Bank, 2006. |
[12]
.
Gyimah-Brempong and others examined the impact of human capital, particularly higher education, on economic growth in 34 African countries during the period 1960-2000. The study incorporated the following variables: GDP growth rate, Investment/GDP, Initial income, Civil war, Population growth, technical progress, and average number of years of primary, secondary, and higher education. The results revealed a strong positive relationship between human capital at all levels of education, particularly higher education, and the growth rate of per capita income. Moreover, the effect of physical capital was found to be half the effect of higher education on individual income growth
.
Seetanah investigated the relationship between education and the economic performance of countries worldwide, focusing on 40 African countries over the periods 1980-2000 and 1985-2000, respectively. The study employed both static and dynamic panel data analysis using Generalized Method of Moments (GMM), with the following variables: secondary enrollment ratio, enrollment in primary education, trade openness (total exports and imports divided by the country's gross domestic product), Financial Development (FD), and political risk rating as independent variables. Real per capita GDP served as the dependent variable. The study demonstrated that education plays an effective and essential role in economic growth
.
Deme, Mamit, and Ali MA Mahmoud examined the impact of the quantity of primary education, the quantity of secondary education, and the quality of education on economic growth in 34 African countries from 2003 to 2016. This study utilized school enrollment (primary and secondary) as an indicator of the quantity of education and the quantity of articles published in technical and scientific journals as an indicator of the quality of education. Independent variables included investment in physical capital, trade openness, the role of institutions, and population growth, while Per Capita Real GDP Growth and log. Real GDP served as dependent variables. By applying Dynamic Generalized Method of Moments (DGMM), the results indicated that the quantity of secondary and primary education exerted a positive and statistically significant effect on the growth of real GDP per capita. However, the relationship between the quality of education and economic growth was found to be weak but robust. Additionally, the quantity of education demonstrated a stronger positive effect compared to the quality of education
| [15] | Deme, Mamit and. A. MA Mahmoud, "Effect of quantity and quality of education on per capita real-GDP growth: evidence from low-and middle-income African countries." Applied Economics, pp. 6248-6264, 2020. https://doi.org/10.1080/00036846.2020.1789058 |
[15]
.
Ogundari and others investigated the impact of human capital on economic growth in 35 African countries from 1980 to 2008, focusing on human capital components such as health and education. The study utilized a System-Generalized Method of Moments (SGMM). Independent variables included real GDP per capita, physical capital (investment in physical capital as a share of PPP), trade openness, democracy index, average years of school, expenditure on education, life expectancy at birth, primary, secondary, and tertiary enrollment, and population size. The findings revealed that human capital has a positive impact on economic growth, with health contributing more significantly than education
| [16] | Ogundari, Kolawole and. T. Awokuse, "Human capital contribution to economic growth in Sub-Saharan Africa: does health status matter more than education?."," Economic Analysis and Policy, pp. 131-140, 2018. https://doi.org/10.1016/j.eap.2018.02.001 |
[16]
.
Kinyondo and others focused on examining the impact of human capital on economic growth in 33 African countries using data from 2000 to 2016, employing the GMM method. The study model incorporated the following variables: trade openness, population growth, HIV prevalence (as a percentage of the population aged 15 to 49), total health expenditures (private and public), and growth in Fixed Capital Formation (FCF). The findings revealed that both life expectancy and education have positive effects on economic growth in sub-Saharan Africa. However, the impact of population health was found to be greater than the effect of education on economic growth
| [17] | Kinyondo, Abel and Mwoya Byaro, "Human capital contribution to the economic growth of sub-saharan Africa: Does health status matter? Evidence from dynamic panel data," in Challenges of Globalization and Prospects for an Inter-civilizational World Order, Cham, Springer, 2020, pp. 713-724. https://doi.org/10.1007/97 |
[17]
.
Petrakis and others examined the impact of human capital on growth in three different groups of 28 countries exhibiting varying levels of development. They found that the relationship between growth and education varies across countries due to differences in their developmental stages. Additionally, they observed that primary and secondary education play a more significant role in less developed countries, whereas higher education is of greater importance in developed countries. The study utilized gross domestic product, physical capital, level of average human capital employed in the economy, technological state, number of workers, and enrollment in primary, secondary, and higher education, along with the composite development index found in the United Nations Development Programs. The Weighted Least Squares (WLS) regression method was applied for analysis
.
2.2. Time Series Literature Review
Pegkas and others estimated the impact of higher education on growth in Greece during the period 1960-2009. The study employed cointegration and an Error-Correction Model (ECM). Student enrollment rates in higher education were used as a proxy for human capital. The study found a long-term cointegration relationship between higher education, physical capital investment, and economic growth. Additionally, it identified a unidirectional causal relationship extending from higher education and physical capital to economic growth
| [19] | Pegkas, Panagiotis and Constantinos Tsamadias, "Does higher education affect economic growth? The case of Greece.," International Economic Journal, Vols. 28-3, pp. 425-444, 2014. https://doi.org/10.1080/10168737.2014.894551 |
[19]
.
Mariana investigated the long-term causal relationship between education, particularly higher education, and economic growth in Romania during the period 1980 to 2013, utilizing an ECM and conducting Augmented Dickey-Fuller (ADF) and Phillips-Perron (PP) tests. The study employed the following variables to represent economic growth and education, respectively: GDP per capita, number of students enrolled in higher education institutions, and the volume of public expenditures on education. The results confirmed the presence of a positive effect of education on economic growth in Romania
.
Taşel, Fulya, and others investigated the effects of human capital on economic sustainability in Turkey's economic growth from 2000 to 2012. They argued that human capital is stimulated through education and examined the relationship between economic growth and human capital. GDP was used as a proxy for sustainable economic growth, while enrollment rates at different levels of schooling served as a proxy for human capital. The study employed Two-Stage Least Squares (2SLS) analysis. Ultimately, the study confirmed the positive relationship between economic growth and human capital, indicating that any increase in the volume of investments, especially in education, will positively affect economic growth in the long term
| [21] | Taşel, Fulya, and E. Beyza Bayarcelik, "The effect of schooling enrolment rates on economic sustainability," Procedia-Social and Behavioral Sciences, vol. 99, pp. 104-111, 2013. https://doi.org/10.1016/j.sbspro.2013.10.476 |
[21]
.
Ganegodage and others examined the contribution of investment in education to economic growth in Sri Lanka during the period 1959-2008. The study evaluated the impact of education through a quality-adjusted human capital stock measure. The results were positive, although significantly lower than those found in other developing economies. The study utilized ARDL to test and estimate the data, with aggregate output as the dependent variable and physical capital, human capital (enrollment in secondary and higher education), trade openness, and war as independent variables
.
Tamang examined the relationship between spending on education and economic growth in India from 1980 to 2008. GDP served as the dependent variable, while Gross Domestic Capital Formation and government expenditure on education were used as independent variables. The study employed various statistical tests including the ADF Unit Root Test, Breusch-Godfrey Serial Correlation LM Test, Johansen Co-integration Test (Trace Statistic), and ECM Estimates. The results indicated the importance of spending on education and revealed a strong long-term relationship between expenditure on education and economic growth
| [23] | P. . Tamang, ""The impact of education expenditure on India’s economic growth."," Journal of International Academic Research, pp. 14-20., 2011. |
[23]
.
Zhang and others examined the effects of human capital composition on economic growth in China during the period 1997–2006. The study utilized the "GMM" method to manage and analyze the data, focusing on human capital structure (specifically, the percentage of human capital with tertiary education), GDP, and physical investment. The results revealed that primary and secondary education played a less significant role than tertiary education in economic growth in China. Additionally, the composition of human capital was found to be closely related to the levels of economic development. Specifically, the more developed provinces benefited more from higher education than from primary education
| [24] | Zhang, Chuanguo and Lihuan Zhuang, "The composition of human capital and economic growth: Evidence from China using dynamic panel data analysis.," China Economic Review, Vols. 22-1, pp. 165-171, 2011. https://doi.org/10.1016/j.chieco.2010.11.001 |
[24]
.
Boztosun and others examined the causal relationship between economic growth and human capital in Turkey during the period 1961-2011 by employing cointegration. They used returns to education and average years of schooling to express human capital, and real GDP growth to express economic growth. The study demonstrated the existence of a two-way causal relationship between economic growth and human capital: An initial increase in human capital of 1% led to an increase in economic growth of 3.2%
.
Nowak, A. Z. and Gangadhar Dahal examined the long-term relationship between economic growth and education in Nepal from 1995 to 2013 by applying the Johansen Cointegration technique and OLS regression analysis. The study revealed that secondary and higher education significantly contribute to the growth of real GDP per capita, while primary education has a positive impact that is less significant compared to higher and secondary education. The study utilized GDP as the dependent variable and Gross Enrollment Ratio at primary, secondary, and university levels as independent variables
| [26] | Nowak, A. Z and Gangadhar Dahal., ""The contribution of education to economic growth: Evidence from Nepal."," International Journal of Economic Sciences, pp. 22-41., 2016. https://doi.org/10.20472/ES.2016.5.2.002 |
[26]
.
Sherawat and others elucidated the impact of investment in female human capital on economic growth in India over the period 1970 to 2014. Employing the Ng Perron unit root test, ARDL-bounds testing approach, and the unrestricted ECM, the study utilized a composite variable of human capital for both males and females (averages of education index and health index). Additionally, education and health were considered as proxies for human capital, GFCF was used as a proxy for physical capital, and per capita real GDP was used as a proxy for economic growth. The study revealed that female human capital is significantly and positively correlated with economic growth, whereas male human capital has a positive but non-significant effect
| [27] | Sehrawat, Madhu, and A. K. Giri, "Does female human capital contribute to economic growth in india?: an empirical investigation.," International Journal of Social Economics., vol. 44, pp. 1506-1521, 11 2017. https://doi.org/10.1108/IJSE-10-2015-0272 |
[27]
.
Ehigiamusoe examined the interrelationship between education, economic growth, and poverty in Nigeria during the period 1980-2012. Human capital and literacy rate, spending on education, physical capital, and labor were treated as independent variables, while real GDP was considered the dependent variable. The study applied OLS, ECM, and utilized both the PP and ADF tests. The results revealed a long-term relationship between education, poverty, and economic growth. Additionally, the study found the absence of a clear effect of total spending on education and the literacy rate on poverty. However, government spending on education was found to have a significant impact on economic growth in both the short and long term, while the literacy rate had a positive but weak effect on economic growth
| [28] | E. Ehigiamusoe, ""Education, Economic Growth & Poverty Rate in Nigeria: Any Nexus?."," Journal of Social and Development Sciences, pp. 544-553, 2013. https://doi.org/10.22610/jsds.v4i12.797 |
[28]
.
Otieno examined the relationship between economic growth and the volume of investment in education in Kenya from 1967 to 2010. The study investigated the relationship between government expenditure on education per worker and economic growth in Kenya by applying unit root and Granger-causality tests. Real GDP was utilized as the dependent variable, while Education expenditure per worker, Physical Capital, and the number of workers served as independent variables. The results supported the positive role of education, indicating that a 1% increase in education leads to a 5% increase in worker productivity
| [29] | O. D. . Otieno, "Role of educational investment on economic growth and development in Kenya.," Journal of Education and Practice, pp. 68-81, 2016. |
[29]
.
Abel and others examined the relationship between human capital development and economic growth in Zimbabwe covering the period 1980-2015. They applied the joint integration technique, ECM, and Granger causality test. The study used GDP per capita as the dependent variable, and GCF as a percentage of GDP, Government Expenditure on Education as a percentage of GDP, Government Expenditure on Health as a percentage of GDP, Tertiary Education Enrollment, Life Expectancy Rate, and an Economic Crisis Dummy Variable as independent variables. The study found a relationship in both the short and long term between human capital development and economic growth. There was a positive relationship between spending on health and economic growth, while public expenditures on education negatively affected growth in Zimbabwe
| [30] | Abel, Sanderson, Nyasha Mhaka, and Pierre Le Roux, "Human capital development and economic growth Nexus in Zimbabwe," Southern African Business Review, vol. 23(1), p. 18, 2019. https://doi.org/10.25159/1998-8125/5128 |
[30]
.
Ragoobur and others investigated the relationship between economic growth and investment in human capital in Mauritius from 1983 to 2019. The study applied the VECM together with the impulse response function and variance decomposition to differentiate between the long-term and short-term effects of human capital. The study utilized GDP per capita, labor factor (unemployment as a percentage of total labor force), physical capital (GFCF), the pupil–teacher ratio in pre-primary education, and life expectancy at birth as variables to measure this effect. The study demonstrated that public investment in early childhood education and health improves educational and health outcomes and promotes economic growth
| [31] | Ragoobur, Verena Tandrayen and Jason Narsoo;, "Early human capital: the driving force to economic growth in island economies," International Journal of Social Economics, Vols. 49 No. 11, 2022, pp. 1680-1695, 2022. https://doi.org/10.1108/IJSE-11-2021-0674 |
[31]
.
Qutb investigated the relationship between spending on public education and economic growth in Egypt during the period 1980-2014. The study utilized the following variables: government expenditure on education as a percentage of GDP, the size of physical capital, GDP at fixed prices, and the size of the labor force. The study employed the VECM and applied the Johansen Cointegration technique. The findings revealed a negative relationship, attributed to the increase in the number of unemployed individuals
| [32] | R. Qutb, ""Exploring the Impact of Public Education Expenditure on the Economic Growth in Egypt.," International Research Journal of Finance and Economics, 2016. |
[32]
.
Elbanna and others examined the impact of education and human capital on comprehensive growth in Egypt during the period 1990-2020. The study applied the ARDL approach. Using the following variables: GDP per worker as the dependent variable, labor force participation rate, GCF, primary and secondary school enrollments, FDI, inflation rate, government consumption as a percentage of GDP, average of exports and imports in goods and service as a percentage of GDP, Final consumption expenditure as a percentage of GDP, and life expectancy at birth. The results indicated that the school enrollment rate has a positive impact on comprehensive growth in both the short and long term
| [33] | Elbanna,, Islam Mohamed and Mamdouh Abdelmoula., "Effect of Education and Human Capital on inclusive growth in Egypt During period 1990-2020," Journal of Financial, Administrative Studies and Research, USC, university of sadat city pp. 1-26, 2, pp. 1-26, 2021. https://doi.org/10.21608/masf.2021.223242 |
[33]
.
Most of the literature, as previously mentioned, relied on the panel data method, overlooking the variations that exist among countries. Additionally, this research specifically focuses on the state of education in Egypt rather than examining a group of countries, resulting in a limited number of studies addressing the issue individually.
3. Egyptian Education
3.1. Overview of the Egyptian Education System
Education after kindergarten, or what is called the early education stage in Egypt, is organized into three stages. The first stage begins when the child turns six years old on October 1st and continues for six years. This stage was shortened to five years for several years and then returned to six years again. The second stage is called the preparatory stage, and it lasts for three years. The student then advances to the final school stage, where they choose either to enroll in general secondary education, after which they qualify for university education, or to choose one of the technical education schools. The first and second stages are compulsory education, and the student’s choice between types of education in this third stage is linked to the total grades they obtain in the final year of this stage.
Basic education in the Egyptian educational system is considered compulsory and free for every child between the ages of six and fifteen. This means that students are obligated to complete their primary studies from the first to the sixth grade, followed by their preparatory studies from the seventh to the ninth grade. Typically, basic stage students attend government schools, which, alongside private schools, adhere to a specific curriculum set by the Ministry of Education. However, there are also international schools that follow their own curricula.
In the sixth grade, basic stage students take a competitive test that they must pass to progress to the middle stage, which begins in seventh grade. At the end of the preparatory stage, students undergo another exam to determine the nature of their study path in the secondary stage. If a student fails to pass this test after a maximum of two attempts, they have the option to transfer to technical schools.
Additionally, there is what is known as a one-semester school, which provides a second opportunity for those who have not enrolled in basic education, exceeded the age of enrollment, or dropped out of primary education. These schools are overseen by the Ministry of Education and the local community
.
There is a parallel path to education through the Al-Azhar Foundation and its affiliated schools and universities. Students in these schools follow the same system as their peers in public or private schools and study the same curricula. However, Al-Azhar schools also incorporate additional Islamic sciences into their curriculum. If students graduate successfully, they are automatically accepted into Al-Azhar University.
University education in Egypt is divided into institutes that last for two years, referred to as upper-intermediate education, and programs that last at least four years, known as higher education.
Higher education in the Arab Republic of Egypt encompasses public universities, Al-Azhar University, and private universities. The higher education system also includes various other institutions such as military and police institutes. Students are admitted to specific universities based on their performance in the high school exam
| [35] | Stopikowska, Malgorzata and y. Mohamed El-Dea, ""The education system of Egypt: contexts, frames and structures."," Problems of Education in the 21st Century, 2012. |
[35]
.
Two ministries are allocated to the administration of education in Egypt. The first is the Ministry of Education, which is concerned with students from the age of 6 to 18 years. The other is the Ministry of Higher Education, which is concerned with education in institutes and universities.
3.2. Educational Competitiveness
Competitive indicators for education show a clear decline in the status of Egyptian education and its outcomes at the global level during 2005 to 2015. Where Egyptian education was ranked 52nd out of 117 countries in 2005, then dropped to 81st out of 139 countries in 2010. The decline continued sharply in 2011, with Egypt falling to 94th place, dropping 13 places in one year. Subsequently, it fell to 116th out of 140 countries in 2015
| [36] | K. . Schwab, "The global competitiveness report 2018."World Economic Forum,," 2018. |
[36]
.
The General Knowledge Index (GKI), as a comprehensive concept closely related to the various dimensions of contemporary human life, provides a more accurate vision of the development of competitiveness in the field of education. It establishes a more objective link between the concepts of knowledge in its multidimensionality and sustainable human development as adopted by the United Nations Development Program.
The index in question comprises seven key indicators, each comprising sub-indices that collectively evaluate a country's knowledge infrastructure. These indicators include Pre-University Education, which assesses the quality and accessibility of education at the primary and secondary levels. Technical and Vocational Education and Training gauge the availability and effectiveness of vocational training programs. Higher Education evaluates the standards and accessibility of tertiary education institutions. Research, Development, and Innovation measure a country's investment and capability in scientific research and innovation. Information and Communications Technology focuses on the accessibility and utilization of digital technologies. Economy examines the economic factors that contribute to knowledge creation and dissemination. Lastly, Enabling Empowerment assesses the inclusivity and empowerment of marginalized groups within the knowledge ecosystem. These indicators provide a comprehensive framework for evaluating and benchmarking a country's knowledge infrastructure across various dimensions.
Egypt's position in GKI reflects a mixed trajectory over the years. In 2017, it held the 90th spot among 131 countries, with a modest score of 40. By 2020, there was a slight improvement as Egypt climbed to the 72nd position out of 138 countries while maintaining the same score. However, the most notable achievement occurred in 2021 when Egypt reached its highest rank, standing at 53rd out of 154 countries with a significantly improved score of 52.3. Nevertheless, in 2023, Egypt's ranking regressed back to the 90th spot, this time among 133 countries, accompanied by a score of 42.5. These fluctuations underscore Egypt's ongoing efforts to strengthen its knowledge infrastructure but also highlight the challenges it faces in maintaining consistent progress in this domain.
Table 1. Egypt's competitive position in the General Knowledge Index.
GKI SCORE | 2023 | 2022 | 2021 | 2020 | 2017 |
133 | 132 | 154 | 138 | 131 |
Rank | Value | R | V | R | V | R | V | R | V |
90 | 42,5 | 95 | 40,5 | 53 | 52,3 | 72 | 45 | 95 | 40 |
Pre-University Education | 80 | 64,8 | 79 | 65 | 72 | 67,1 | 83 | 57,2 | 106 | 44,9 |
Technical And Vocational Education and Training | 46 | 55,9 | 81 | 50.2 | 68 | 53,4 | 80 | 47,6 | 113 | 44 |
Higher Education | 94 | 37,7 | 95 | 38,2 | 35 | 54,6 | 42 | 45,6 | 54 | 42,1 |
Research, Development, and Innovation | 90 | 24 | 99 | 19,5 | 58 | 32,7 | 74 | 19,9 | 101 | 16,5 |
Information and Communications Technology | 85 | 39,8 | 85 | 37,9 | 57 | 50 | 74 | 52,4 | 86 | 44,2 |
Economy | 85 | 45,9 | 89 | 46,2 | 56 | 56,7 | 41 | 41,8 | 88 | 40,5 |
Enabling Empowerment | 115 | 42,1 | 112 | 42,6 | 88 | 51,2 | 92 | 53,4 | 120 | 47,4 |
Source: GKI 2017 – 2023
Table 1 shows Egypt's competitive position in GKI. additionally, the data indicates Egypt's specific performance values within the index. In 2017, Egypt achieved a score of 40 percentage points, which notably fell below the global average of 47 for that year. Despite fluctuations in subsequent years, Egypt maintained a relatively consistent performance, with values of 40, 52.3, 40.5, and 42.5 recorded for 2020, 2021, 2022, and 2023, respectively. These figures provide a quantitative insight into Egypt's progress within the framework of the index, offering a basis for understanding its relative strengths and areas requiring improvement in its knowledge infrastructure.
Egypt's competitive position in GKI
:
Egypt's competitiveness in the ranking of countries with high human development has seen a notable decline in recent years, with exceptions such as 2021 when it achieved the fourth position out of 39 countries. However, this positive trend was not sustained, as evidenced by its rankings of 24th out of 28 countries in 2023 and 26th out of 28 countries in 2022. In 2020, Egypt held the 15th position out of 36 countries, indicating a significant shift in its competitive standing within this category over the years.
3.3. Initiatives for Elevating Educational Standards
Egypt is striving hard to advancement of basic and higher education. The Egyptian Constitution issued in 2014 stipulates in Article 19 that "education is compulsory until the end of secondary school or its equivalent, and the state guarantees free education at its various levels in state educational institutions." The constitution also mandates the state's obligation to allocate a percentage of government spending on education, not less than 4% of the gross national product, gradually increasing until it is consistent with global rates. Additionally, the state is committed to supervising all public and private schools and institutes to ensure adherence to educational policies.
Article 25 of the Constitution also stipulates that the state is committed to developing a comprehensive plan to eliminate illiteracy, both alphabetical and digital, among citizens of all ages. Additionally, it is committed to developing mechanisms for its implementation with the participation of civil society institutions according to a specific time plan.
According to "Egypt Vision 2030," education should be "of high quality, available to all without discrimination, and within the framework of an efficient and fair institutional system that contributes to building an integrated personality of a self-respecting citizen."
Egypt's Vision 2030 also affirmed the goal of eradicating alphabetical and digital illiteracy and promoting a reduction in the dropout rate from basic education
| [38] | A. R. o. Egypt, Issuing the amended Constitution of the Arab Republic of Egypt for the year 2014, Cairo: Official Gazette - Issue 3a, 2014. |
[38]
.
The efforts resulted in a decrease in the dropout rate in the primary stage from about 0.56% in 2013/2014 to about 0.23% in 2021/2022. Similarly, the dropout rate in the preparatory stage decreased from about 4.47% in 2013/2014 to about 1.73% in 2021/2022. Regarding the illiteracy rate, it also decreased from about 25.7% in 2017/2018 to about 20.7% in 2022/2023.
The state was able to increase the number of schools and classrooms, bringing the number of pre-university schools to about 60.3 thousand schools in 2022/2023, compared to about 49.4 thousand schools in 2013/2014.
The Egyptian state's strategy also included attention to technical education, as allocations for technical education were increased by 233.3% to reach 50 billion pounds during the fiscal year 2021/2022 compared to 15 billion pounds during the fiscal year 2014/2015. Furthermore, the demand for technical education increased by about 53.3%, from 1.5 million students in 2013/2014 to 2.3 million students in 2022/2023
| [39] | E. s. i. servace, "Various reports," 2013-2023. |
[39]
.
The number of technical education schools also increased by 84.6% from 1.7 thousand schools in 2013/2014 to 3.1 thousand schools in 2022/2023. Additionally, the number of technical education school classes increased by 51.4%, reaching 54.2 thousand classes in 2022/2023 compared to 35.8 thousand in the semester 2013/2014.
Moreover, the "Strategic Plan for Pre-University Education 2014-2030" stipulated the development of curricula. The state's strategy for developing curricula and improving the quality of the educational system included four main axes: developing the education system, modifying the general secondary system, opening Japanese schools, and opening technological schools in technical education. Accordingly, 49 curricula were developed up to the sixth grade of primary school, and 80% of the technical education curricula were developed using the competency methodology, which includes vocational and technical skills accompanied by advanced knowledge, behaviors, and attitudes. The number of schools in which the competency system was applied reached 325 schools in the academic year 2021/2022.
Egypt's Vision 2030 focused on the need to enhance the efficiency of teachers, restructure the budget, and maximize financial allocations supporting the qualitative aspects of the educational process. This was translated into a plan to appoint 150,000 teachers over a period of five years, at a rate of 30,000 teachers annually. In 2023, 30,000 teachers were appointed in the first phase, with a cost amounting to about 1.8 billion pounds. Additionally, about 639,800 teachers in the first grades and primary education were trained. Furthermore, 41,000 secondary school teachers and mentors were trained in the methods and techniques of drafting optional vocabulary. Approximately 180,000 school leaders were trained in values and respect for others, and 60,000 school principals and social workers were trained to activate the role of the school in developing the values of national belonging. In addition, about 54.3 thousand professional development programs were implemented for community education teachers
.
The state also paid attention to higher education and supporting scientific research. The most prominent efforts in the field of providing higher education included the expansion of establishing various types of universities, whether governmental, private, or civil, to accommodate more students. Additionally, there was an expansion of technological complexes to serve and support scientific research. The number of Egyptian universities reached 96 (including governmental, private, private, technological, and branches of foreign universities) compared to 50 Egyptian universities in 2014. Public universities witnessed an increase in their number by 16.6% to reach 28 universities during the fiscal year 2022/2023, up from 24 universities during the fiscal year 2013/2014. These efforts resulted in the inclusion of 49 Egyptian higher education institutions and universities in the Middle East and North Africa (SEMAGO) rankings for the year 2023. Additionally, the number of Egyptian universities listed in the Times Higher Education World University Rankings increased to 36 universities in 2023 compared to 3 in 2016. The number of Egyptian universities listed in the Chinese Shanghai Ranking for academic specializations also increased to 7 universities in 2023 compared to 5 in 2016
| [41] | E. s. informationservace, "diffrent years," 2010-2023. |
[41]
.
3.4. Development of Egypt’s Spending on Education and the Number of Students
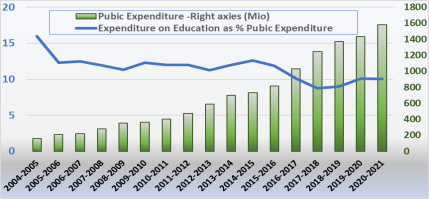
Figure 1 illustrates the relationship between expenditure on education and public expenditure. The blue line denotes expenditure on education as a percentage of public expenditure, while the green columns represent the volume of public spending from 2004 to 2021.
Figure 1. The Expenditure on Education as a Percentage of Public Expenditure in Egypt 2005-2021.
Despite the increasing volume of public expenditure over this period, there is a discernible trend of the percentage allocated to education gradually decreasing, particularly in recent years. This trend suggests that other sectors besides education are receiving attention and funding. Moreover, factors such as the high cost of education, elevated inflation rates, and the government's inability to sustain financing burdens contribute to the worsening of these financial constraints.
Figure 2. The Relationship Between Expenditure on Education and the Number of Students in Universities in Egypt from 2004-2021.
Figure 2 depicts the correlation between expenditure on education and the enrollment of students in universities from 2004 to 2021. Over this period, the number of enrolled students has steadily risen, reaching a peak of 2,660,789 in the academic year 2019-2020, marking the highest enrollment figure recorded. This surge in enrollment can be attributed to several factors, notably the increase in expatriates from abroad, facilitated by streamlined enrollment procedures for foreign students in Egyptian universities and higher institutes. Additionally, the proliferation of private and specialized universities has contributed to the influx of students, driven by a growing emphasis on tailoring education to meet labor market demands.
Concurrently, as the student population in universities expands, there is a noticeable trend of a gradual decrease in the percentage of spending on education, reaching its lowest point in the academic year 2017-2018. This decline can be attributed to escalating financial pressures, exacerbated by rising prices and inflation rates. Moreover, a reallocation of funds towards other sectors at the expense of education further exacerbates this trend.
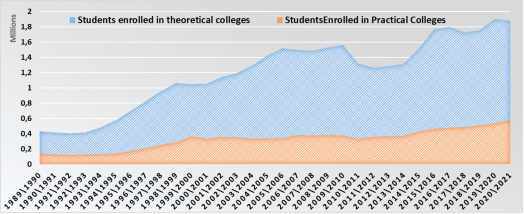
Figure 3. Development of Students Enrolled in Theoretical and Practical Colleges in Egypt from 1990-2021.
Figure 3 illustrates the evolution of students enrolled in theoretical and practical colleges from 1990 to 2021. Analysis of the data suggests a notable disparity in demand between theoretical and practical colleges, with several factors contributing to this trend.
Firstly, practical colleges typically entail a higher financial burden for parents and are often perceived as more challenging to study in, potentially deterring enrollment. Conversely, theoretical colleges offer shorter study durations, facilitating quicker entry into the workforce, and typically have lower tuition fees, thereby attracting a larger number of students.
Additionally, the state's apparent lack of focus on practical colleges may further exacerbate the discrepancy in enrollment figures between the two types of institutions. This could manifest in insufficient resources, limited investment, or inadequate support for practical colleges compared to their theoretical counterparts.
Overall, the data underscores a prevailing preference for theoretical colleges over practical ones, driven by a combination of financial, educational, and institutional factors.
This could involve mechanisms like scholarships, study loans, and other forms of financial support, thereby lessening reliance solely on government funding. Moreover, there may be a shift towards leveraging donations, endowments, and revenue from research services to supplement university funding. Alternatively, policymakers might consider implementing dedicated taxes for education purposes.
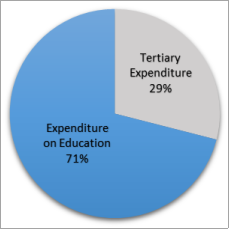
Figure 4 depicts the average expenditure on university education from 2000 to 2021, estimated at 29% of the total education spending volume. However, this allocation appears relatively modest when compared to the considerable number of university students. The decline in the proportion allocated to university education may stem from various factors Firstly, there could be diversification in funding sources, such as initiatives to encourage contributions from civil society organizations and businesses to a designated fund for higher education. Such as levies on commercial and industrial profits, to bolster funding for higher education initiatives.
Figure 4. The average expenditure on university education.
Source: Author’s computation using data from Central Agency for Public Mobilization and Statistics
Figure 5. The Relationship Nexus Expenditure on Education and Student Enrollment in Primary Education in Egypt 2004-2021.
Figure 5 illustrates the correlation between student enrollment in primary education and expenditure on education as a percentage of public expenditure from 2004 to 2021. The green line represents the steady increase in student enrollment in primary schools, while the blue line depict a concerning trend of decreasing expenditure on education relative to public expenditure over the same period.
This discrepancy between rising student numbers and declining education spending may indicate a gap between the demand for schools and the actual implementation of construction projects. Additionally, insufficient maintenance and a severe shortage in the number of schools exacerbate the issue. Consequently, classrooms become overcrowded, particularly at the primary level, due to factors such as population growth and the provision of free basic education.
These observations underscore the urgent need for increased investment in education infrastructure to accommodate the growing student population adequately. Failure to address this disparity may compromise the quality of education and hinder efforts to provide accessible and inclusive schooling for all children.
4. Empirical Study
The Cobb-Douglas function is often used as a basis and beginning to assess the role of human capital in economic growth, as this function has been expanded to include human capital as a basic determinant of growth, "which is now known as "The augmented Solow growth model".
The variable that represents human capital varies from one study to another. It expresses the accumulation of human capital in several forms, the most important is education, which appears in several forms also, such as school enrollment rates and attendance rates as well, or the amount of expenditure on education during its three stages, so this is what the study will use. First, the study uses number of classes in schools during the three educational stages (primary - preparatory - secondary) and second the number of students enrolled in theoretical and practical colleges to illustrate the impact of education on economic growth. The starting point for Vinod et al was the augmented Solow model by adding human capital as an essential factor for growth. Therefore, the production function includes human capital as Follows
| [2] | Mankiw, N. Gregory, David Romer, and David N. Weil, "A contribution to the empirics of economic growth," The quarterly journal of economics,, vol. 107(2), pp. 407-437, 1992. https://doi.org/10.2307/2118477 |
[2]
:
(1)
Where Y refers to output, K, H, A, L refer to physical capital, human capital, technology, and labor (augmented labor). The parameters, and represent the share of physical capital, human capital, and augmented labor in output. According to the assumptions of Solow model, and MRW (L, A) grow exogenously at the rate of (n+g) where
Therefore, the production function could be re-written per augmented unit of labor as
Where:
and(3)
Then, suppose that there is a constant fraction of the output invested in physical capital called and another fraction invested in human capital called according to the following equation for physical capital and the same for human capital:
Where: capital depreciation.
The model assumption includes diminishing marginal returns to scale in steady state convergence economy so the evolution of
and
tend to equal zero. So, we can find a direct relation between y (t) with
or
, and per capita output as
then rewriting equation (
1) with previous notes gives:
(5)
Because the accumulation of human capital is not line with diminishing returns MRW (1992)
| [2] | Mankiw, N. Gregory, David Romer, and David N. Weil, "A contribution to the empirics of economic growth," The quarterly journal of economics,, vol. 107(2), pp. 407-437, 1992. https://doi.org/10.2307/2118477 |
[2]
and Islam (1995)
started from the equation that explain speed of convergence to the economy steady state:
Where
the output is per capita at the steady state, y (t) is the output actual value, and
by solving the previous differential equation, MRW got the following endogenous growth equation:
(6)
However, the previous formula still examines convergence to economy steady state level. Therefore, by following the same procedures MRW had used before for examining economic growth regression on human capital level in a decreasing return to scale leads to the following equation
| [2] | Mankiw, N. Gregory, David Romer, and David N. Weil, "A contribution to the empirics of economic growth," The quarterly journal of economics,, vol. 107(2), pp. 407-437, 1992. https://doi.org/10.2307/2118477 |
[2]
:
(7)
The previous equation is formulated after subtracting lny0 from both sides of the equation, then rescaling y(t) and A(t) from equations (
4) and (
2) again and substituting them in equation (
8). However, the hardest of getting panel data for human capital accumulation rate forced MRW again, and many other as
, to transform their endogenous growth equation to include human capital level instead of human capital accumulation rate.
(8)
Following MRW our model, this paper tries to examine the impact of human capital development on economic growth in Egypt using the following endogenous growth model
| [2] | Mankiw, N. Gregory, David Romer, and David N. Weil, "A contribution to the empirics of economic growth," The quarterly journal of economics,, vol. 107(2), pp. 407-437, 1992. https://doi.org/10.2307/2118477 |
[2]
:
(9)
Where t = time period, n = country index
Y = the real per capita output
Sk = the fraction of output investigating in physical capital
h =the level of human capital
The random error term is
Represent time effect
The unobserved time invariant individual effect
(10)
Where t represents years, (Growth) represents economic growth, (xt) represents the endogenous variables that affect economic growth, (zt) represents the exogenous variables that affect the growth, andis the regression equation error term.
The research uses two different techniques respectively unit root test, and the Auto Regressive Distributed Lag (ARDL) bounds test developed by Pesaran and Shin to examine the effect of expenditure on education on economic growth in Egypt over the period (1990-2021)
| [43] | Pesaran, M. Hashem and Y. Shin. , "An autoregressive distributed lag modelling approach to cointegration analysis.," University of Cambridge, 1995. |
[43]
. The estimation method provides many supporting advantages, as it examines the short and long-term relationship between the dependent and independent variables. In addition, this estimation technique is suitable when variables are I (1) or I (0) or jointly cointegrated. ARDL also can capture the problems of endogeneity and serial correlation. Thus, it gives unbiased estimates
| [44] | Adusah-Poku, Frank and. W. Bekoe. , ""Does the Form Matter? Foreign Capital Inflows and Economic Growth.," Journal of Economics and Econometrics, pp. 39-74, 2018. |
[44]
.
This study uses annual time series data from 1990 to 2021 in Egypt. The selected period is included in terms of the data availability. In general, human capital has an influential role in economic growth. Therefore, this study will try to measure the effect of human capital on economic growth by using several measures. This paper uses two econometric models with six approaches and in the two models the dependent variable is the Average GDP per capita for workers (LGDP) which represents the economic growth in addition to two controlled variables: the Labor participation rate as a proxy of labor and Gross Capital Formation (GCF) as a proxy of capital. Where the first model (first three approaches) used the number of students enrolled in theoretical (LSTNA), practical colleges (DISTNS) and the total student in both theoretical and practical colleges (TUNI) respectively, the second model (the other three approaches) used the numbers of classes in schools during the three educational stages (primary - preparatory - secondary) respectively. the dependent variables: LGDP and the controlled variables (GCF, the Labor participation rate as a proxy of labor,) were obtained from world bank data (world development indicators) while data on enrollment numbers and numbers of classes were collected from the annual statistical book. (As shown in
table 2).
4.2.2. Descriptive Statistic
Table 3 shows the descriptive statistics of the dependent variable (Average per capita working income) and the independent variables employed in the regression model. The reported results indicate that the arithmetic mean of Average per capita working income is (10.39) and its standard deviation is (0.196), while its maximum Value is (10.769) and its minimum value is (10.119).
The mean values of LFPR, GCFP, LSTNA, DISTNS, TUNI, DCP, DCM, and LCS is (46.32, 18.33, 46786.3, 18110.1, 1870118, 4783.22, 1723.09 and 11.3799) respectively. The maximum values of LFPR, GCFP, LSTNA, DISTNS, TUNI, DCP, DCM, and LCS is (49.370, 23.733, 249860.0, 61922.00, 2892885, 34918.019502.0 and 11.655) respectively. The minimum values of LFPR, GCFP, LSTNA, DISTNS, TUNI, DCP, DCM, and LCS are (41.317, 13.643, -246939.0, -7269.000, 752482.0, -22597.00, -26651.00 and 10.78959) respectively. The Standard deviation values for LFPR, GCFP, LSTNA, DISTNS, TUNI, DCP, DCM, and LCS are (2.194, 2.49, 9159, 18831.5, 655047.1, 9739.67, 7507.46 and 0.1988) respectively.
Table 2. Shows the Abbreviations Used and the Data Source.
Abbr. | Variable names | Data source |
LGDP | Average per capita working income | World Bank- World Development Indicators |
LFPR | Labor participation rate force (labor force) |
GCFP | Growth fixed capital formation (ratio) |
LSTNA | Number of students enrolled in theoretical colleges | Central Agency for Public Mobilization and Statistics (capmas) - Statistical yearbook various years. |
DISTNS | Number of students enrolled in practical colleges |
TUNI | The total number of students registered in universities and institutes |
DCP | Number of primary classes |
DCM | Number of preparatory classes |
LCS | Number of secondary classes |
Source: the author's contribution
Table 3. Descriptive Statistics.
Variables | Mean | St. Dev | Max | Min | Obs |
LGDP | 10.39 | 0.196 | 10.769 | 10.119 | 31 |
LFPR | 46.32 | 2.194 | 49.37 | 41.317 | 31 |
GCFP | 18.33 | 2.49 | 23.733 | 13.643 | 31 |
LSTNA | 46786.3 | 9159 | 249860 | -246939 | 31 |
DISTNS | 18110.1 | 18831.5 | 61922 | -7269 | 31 |
TUNI | 1870118 | 655047.1 | 2892885 | 752482 | 31 |
DCP | 4783.22 | 9739.67 | 34918 | -22597 | 31 |
DCM | 1723.09 | 7507.46 | 19502 | -26651 | 31 |
LCS | 11.3799 | 0.1988 | 11.655 | 10.78959 | 31 |
Source: the author's estimation from e-views
4.3. Estimation of the ARDL Model
A group of different tests was used to verify the data and the extent of its validity and adequacy. The study aims to examine the short- and long-term relationship between variables, and the results were supportive of economic theory.
The study used ADF test and PP test to examine whether the data are stationary
| [45] | Dickey, David A and W. A. Fuller., ""Distribution of the estimators for autoregressive time series with a unit root."," Journal of the American statistical association, pp. 427-431, 1979. https://doi.org/10.1080/01621459.1979.10482531 |
| [46] | Phillips, Peter CB and P. Perron.", ""Testing for a unit root in time series regression.," biometrika 75.2, pp. 335-346, 1988. https://doi.org/10.1093/biomet/75.2.335 |
[45, 46]
. The null hypothesis is that there is a unit root, meaning the data is nonstationary, so when the P-value is more than 0.05 which means the data is nonstationary. If the opposite happens, the alternative hypothesis will be accepted, which is that the data is stationary.
Table 4 shows the results of the PP and the ADF tests at the natural level and first difference.
The results showed that LSTNA, DISTNS, DCP, LCS, and DCM are stationary at level. While LGDP, LFPR, GCFP, and TUNI are stationary at first difference.
4.3.2. Cointegration Test
To illustrate the long run relationship of cointegration between LGDP and explanatory variables, the research uses the bounds test. The null hypothesis of the Cointegration test shows that there is no cointegration. H0: β1 = β2 = β3 = β4 = β5 = β6 = β7 = β8= β9 =0
The alternative hypothesis of the Cointegration test means that there is cointegration. H1: β1 ≠ β2 ≠ β3 ≠ β4 ≠ β5 ≠ β6 ≠ β7 ≠ β8 ≠ β9 ≠0
The results of bounds test are shown in
table A1 in the appendix
,In approach (1) we can see that the value of the F-statistic is (15.58), which is above the lower and upper critical values at 10%, 5%, and 1%. So, we accept the alternative hypothesis and confirm that there is a cointegration (long-run relationship) between both the dependent and the independent variables. The t-statistic absolute value is (8.60) which is greater than the absolute value of both the lower and upper critical values at all levels of significance. Thus, the null hypothesis cannot be accepted which confirms that cointegration is sensical.
The same in approaches (2), (3), (4), (5) and (6) we can see that the values of the F-statistic are (17.58), (8.17), (8.11), (6.54), and (13.64). So, we accept the alternative hypothesis and confirm that there is a cointegration (long-run relationship) between both the dependent and the independent variables. The t-statistic absolute values are (9.375), (4.60), (4.611), (5.60) and (7.98) which is greater than the absolute value of both the lower and upper critical values at 1%, 5%, 5%, 1%, 1%. Thus, the null hypothesis cannot be accepted which confirms that cointegration is sensical
.
Table 4. Unit Root and Philips-Perron Test.
Variable | At level | At first difference |
With intercept | With intercept and trend | With intercept | With intercept and trend |
ADF | PP | ADF | PP | ADF | PP | ADF | PP |
LGDP | 1.1652 (0.99) | 1.14 (0.99) | -1.56 (0.78) | -1.74 (0.70) | -4.96 (0.000) | -4.95 (0.000) | -5.20 (0.001) | -5.20 (0.00) |
LFPR | -1.39 (0.57) | -0.87 (0.78) | -1.76 (0.69) | -1.33 (0.86) | -3.70 (0.008) | -3.70 (0.009) | -3.75 (0.033) | -3.77 (0.03) |
GCFP | -2.49 (0.12) | -3.02 (0.04) | -3.26 (0.09) | -3.20 (0.102) | -5.16 (0.000) | -6.98 (0.000) | -5.06 (0.001) | -6.73 (0.000) |
LSTNA | -3.60 (0.011) | -3.46 (0.01) | -3.56 (0.05) | -3.31 (0.08) | -6.15 (0.000) | -9.17 (0.000) | -6.07 (0.000) | -9.54 (0.000) |
DISTNS | -3.30 (0.023) | -3.28 (0.02) | -3.26 (0.09) | -3.23 (0.09) | -6.98 (0.000) | -8.12 (0.000) | -6.86 (0.00) | -8.02 (0.000) |
TUNI | -0.43 (0.89) | -0.48 (0.88) | -2.43 (0.35) | -1.74 (0.70) | -4.186 (0.002) | -4.04 (0.00) | -4.11 (0.014) | -3.95 (0.021) |
DCP | -7.34 (0.000) | -7.67 (0.000) | -7.22 (0.000) | -7.53 (0.000) | -5.60 (0.000) | -28.3 (0.000) | -5.60 (0.000) | -32.31 (0.000) |
DCM | -5.32 (0.0001) | -5.97 (0.00) | -5.25 (0.000) | -5.86 (0.000) | -10.16 (0.000) | -27.3 (0.000) | -10.0 (0.000) | -29.49 (0.000) |
LCS | -3.93 (0.004) | -4.21 (0.002) | -2.54 (0.30) | -3.48 (0.057) | -2.37 (0.15) | -3.94 (0.004) | -2.56 (0.29) | -4.42 (0.007) |
4.3.3. Long-Term Relationship
The following equations are long-run equations using the ARDL Bounds testing method for the following five variables (LSTNA, DISTNS, TUNI, DCP, DCM, and LCS) respectively.
(11)
Where β1, β2, β3 and β4, refer to the long-term coefficients, and (t) refers to years. GDP is the Explained variable. GCFP, LFPR and LSTANT are the explanatory variables and (ut) is the error term.
(12)
Where β1, β2, β3 and β5, refer to the long-term coefficients, and (t) refers to years. GDP is the explained variable. GCFP, LFPR and DISTNS are the explanatory variables and (ut) is the error term.
(13)
Where β1, β2, β3 and β6, refer to the long-term coefficients, and (t) refers to years. GDP is the Explained variable. GCFP, LFPR and TUNI are the explanatory variables and (ut) is the error term.
(14)
Where β1, β2, β3 and β7, refer to the long-term coefficients, and (t) refers to years. GDP is the Explained variable. GCFP, LFPR and DCP are the explanatory variables and (ut) is the error term.
(15)
Where β1, β2, β3 and β8, refer to the long-term coefficients, and (t) refers to years. GDP is the explained variable. GCFP, LFPR and DCM are the explanatory variables and (ut) is the error term.
(16)
Where β1, β2, β3 and β9, refer to the long-term coefficients, and (t) refers to years. GDP is the explained variable GCFP, LFPR and LCS are the explanatory variables and (ut) is the error term.
4.3.4. Short-Term Relationship
The following variables (LSTNA, DISTNS, TUNI, DCP, DCM, and LCS) can be formulated respectively according to the short-run equation using the Auto Regressive Distributed Lag (ARDL) Bounds testing method as follows:
(17)
Where Δ represents the first differences, ’s refers to short-run coefficients, GCFP, LFPR and are the explanatory variables, is the coefficients of the Error Correction Term, and is the disturbance terms at time (t).
(18)
Where Δ represents the first differences, ’s refers to short-run coefficients, GCFP, LFPR and are the explanatory variables, is the coefficients of the Error Correction Term, and is the disturbance terms at time (t).
(19)
Where Δ represents the first differences, ’s refers to short-run coefficients, GCFP, LFPR and are the explanatory variables, is the coefficients of the Error Correction Term, and is the disturbance terms at time (t).
(20)
Where Δ represents the first differences, ’s refers to short-run coefficients, GCFP, LFPR and are the explanatory variables, is the coefficients of the Error Correction Term, and is the disturbance terms at time (t).
(21)
Where Δ represents the first differences, ’s refers to short-run coefficients, GCFP, LFPR and are the explanatory variables, is the coefficients of the Error Correction Term, and is the disturbance terms at time (t).
(22)
Where Δ represents the first differences, ’s refers to short-run coefficients, GCFP, LFPR and are the explanatory variables, is the coefficients of the Error Correction Term, and is the disturbance terms at time.
4.3.5. ARDL Bounds Test Result
The results of the ARDL Bounds testing technique can be shown in the following two tables.
Table 5. The ARDL Model (1) Results.
Long Run |
Variable | |
Step | 1 | 2 (STNA) | 3 (STNS) | 4 (TUNI) |
GCFP | 0.00825*** (5.954) | 0.00970*** (5.187) | 0.0082*** (7.513) | 0.010*** (6.169) |
LFPR | -0.0131*** (17.17) | -0.0114*** (17.54) | -0.01117*** (19.696) | -0.0129*** (16.67) |
LSTNA | | 0.07063*** (4.706) | | |
DISTNS | | | 0.0000005 *** (4.611) | |
TUNI | | | | 0.037** (2.062) |
Short Run |
D (GCFP) | 0.00597*** (4.750) | -0.003*** (2.62) | 0.002*** (3.626) | 0.003** (3.000) |
D (FPR) | -0.0094*** (-4.1277) | -0.024*** (15.97) | -0.019*** (19.27) | -0.022*** (11.2) |
D (STNA) | | 0.045** (3.93) | | |
D (DISTNS) | | | -0.0000004*** (5.55) | |
D (TUNI) | | | | 0.00000002 (1.69) |
Coin t Eq (-1) | -0.7238*** | -0.6417*** | -1.002*** | -0.752*** |
R-square | 0.91286 | 0.9994 | 0.9996 | 0.9989 |
Normality test | 0.2020 | 0.7631 | 0.6726 | 0.1851 |
LM test (probability Chi-square) | 0.5743 | 0.1463 | 0.1451 | 0.555 |
Heteroscedasticity (probability Chi-square) | 0.6861 | 0.9615 | 0.9998 | 0.998 |
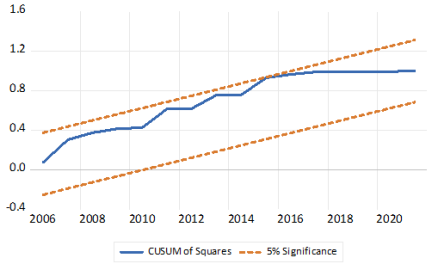
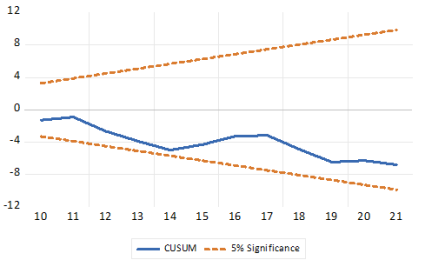
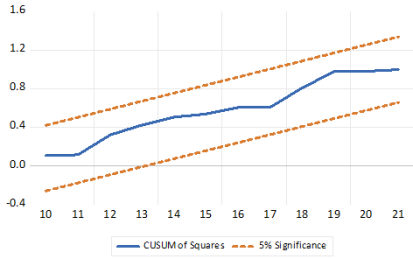
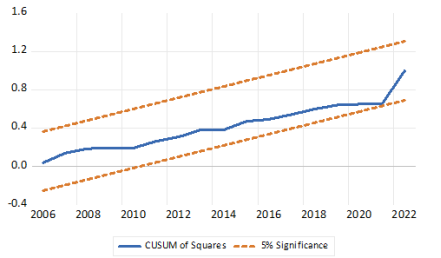
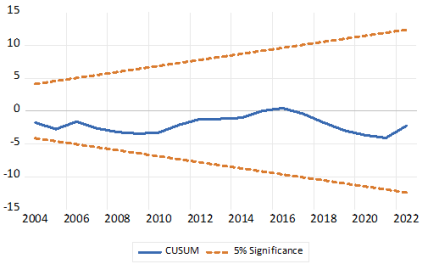
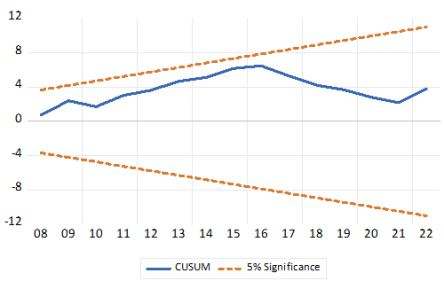
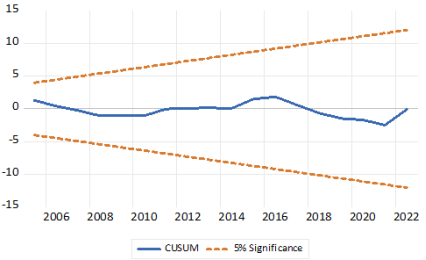
CUSUM (Figer) | (A-1) | (A-3) | (A-5) | (A-7) |
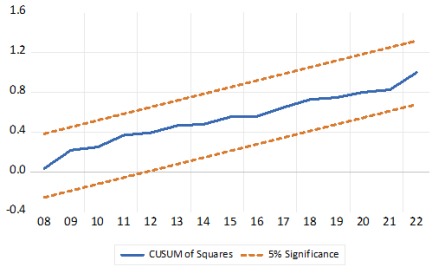
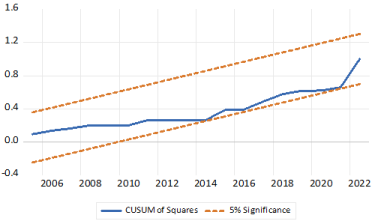
CUSUMSQ (Figer) | (A-2) | (A-4) | (A-6) | (A-8) |
Source: Author's estimation, the absolute t-statistic values are in parentheses () below the coefficients of the regressors. (***, **, *) denote significance level at 1%, 5%, 10%, respectively.
Table 6. The ARDL Model (2) Results.
Long Run |
Variable | |
Step | 1 | 2 (primary) | 3 (preparatory) | 4 (secondary) |
GCFP | 0.00825*** (5.954) | 0.008*** (5.797) | 0.0045** (2.82) | 0.008*** (6.003) |
LFPR | -0.0131*** (17.17) | -0.013*** (16.76) | -0.015*** (11.05) | -0.011*** (15.52) |
DCP | | -0.0000002 (1.08) | | |
DCM | | | 0.000001** (2.15) | |
LCS | | | | 0.106*** (5.607) |
Short Run |
D (GCFP) | 0.00597*** (4.750) | -0.002** (2.37) | -0.002** (2.45) | -0.002*** (3.43) |
D (LFPR) | -0.0094*** (-4.1277) | -0.019*** (13.69) | -0.021*** (15.79) | -0.020*** (16.457) |
D (DCP) | | -0.0000001 (0.72) | | |
D (DCM) | | | 0.0000001 (0.734) | |
D (LCS) | | | | 0.130** (3.844) |
Coin t Eq (-1) | -0.7238*** | -0.711*** | -0.707*** | -0.743*** |
R-square | 0.91286 | 0.998 | 0.999 | 0.999 |
Normality test | 0.2020 | 0.3140 | 0.9751 | 0.0435 |
LM test (probability Chi-square) | 0.5743 | 0.7008 | 0.1433 | 0.2409 |
Heteroscedasticity (probability Chi-square) | 0.6861 | 0.8217 | 0.9890 | 0.9803 |
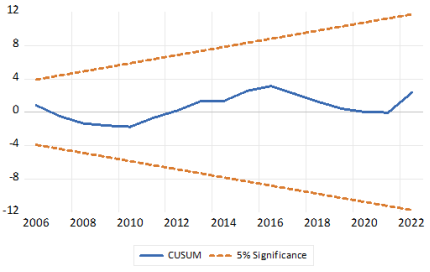
CUSUM (Figure) | (A-1) | (A-9) | (A-11) | (A-13) |
CUSUMSQ (Figure) | (A-2) | (A-10) | (A-12) | (A-14) |
Table 5 shows: The Model (1) with first three approaches results of the long-run relationships between the dependent (LGDP) and independent variables (GCFP, LFPR, LSTNA, DISTNS and TUNI), respectively.
In first approach, there is a positive relationship between economic growth and growth fixed capital formation at 1% significance level, with a coefficient equals 0.00970, which means that if the GCFP increase by one unit the economic growth will increase by the previous value of the coefficient, there is a positive relationship between economic growth and number of students enrolled in theoretical colleges at 1% significance level, with a coefficient equals 0.07063, which means that if the LSTNA increase by one unit the economic growth will increase by the previous value of the coefficient, finally there is a negative relationship between economic growth and labor participation rate force at 1% significance level, with a coefficient equals -0.0114, which means that if the LFPR increase by one unit the economic growth will decrease by the previous value of the coefficient and This may be due to the fact that each additional worker represents a burden on the current workers due to the difficulty of integrating with them, in addition to disrupting the production process.
In second approach, there is a positive relationship between economic growth and growth fixed capital formation at 1% significance level, with a coefficient equals 0.0082, which means that if the GCFP increase by one unit the economic growth will increase by the previous value of the coefficient, there is a positive relationship between economic growth and number of students enrolled in practical colleges at 1% significance level, with a coefficient equals 0.0000005, which means that if the DISTNS increase by one unit the economic growth will increase by the previous value of the coefficient. We note that the number of students in practical colleges has less impact on economic growth than theoretical colleges. This can be explained by the fact that interest in practical colleges is weak compared to theory because practical colleges need huge funding sources for practical application in those colleges, which is not found in theoretical colleges, finally there is a negative relationship between economic growth and labor participation rate force at 1% significance level, with a coefficient equals -0.01117, which means that if the LFPR increase by one unit the economic growth will decrease by the previous value of the coefficient.
The third approach, there is a positive relationship between economic growth and growth fixed capital formation at 1% significance level, with a coefficient equals 0.010, which means that if the GCFP increase by one unit the economic growth will increase by the previous value of the coefficient, there is a positive relationship between economic growth and the total number of students registered in universities and institutes at 5% significance level, with a coefficient equals 0.037, which means that if the TUNI increase by one unit the economic growth will increase by the previous value of the coefficient, finally there is a negative relationship between economic growth and labor participation rate force at 1% significance level, with a coefficient equals -0.0129, which means that if the LFPR increase by one unit the economic growth will decrease by the previous value of the coefficient. This result is consistent with
| [9] | A. G. Akpolat, "The long-term impact of human capital investment on GDP: a panel cointegrated regression analysis.," Economics Research International, pp. 1-10, 2014. https://doi.org/10.1155/2014/646518 |
| [48] | W. Blankenau, "Public schooling, college subsidies and growth.," Journal of economic dynamics and control, Vols. 29-3, pp. 487-507, 2005. https://doi.org/10.1016/j.jedc.2004.04.001 |
| [49] | Z. Tomić, "Analysis of the impact of public education expenditure on economic growth of European Union and BRICS.," Economic analysis, Vols. 48-1-2, pp. 19-38, 2015. |
| [50] | Kim, Soo‐Wan, and Sang‐Hoon Ahn, "Social investment effects of public education, health care, and welfare service expenditures on economic growth.," Asian Social Work and Policy Review, vol. 14.1, pp. 34-44, 2020. https://doi.org/10.1111/aswp.12190 |
| [51] | N. e. a. Rambeli, "The dynamic impact of government expenditure in education on economic growth.," ternational Journal of Business and Society, Vols. 22-3, pp. 1487-1507., 2021. https://doi.org/10.33736/ijbs.4318.2021 |
[9, 48-51]
.
Table 6 shows: The Model (2) with last three approaches results of the long-run relationships between the dependent (LGDP) and independent variables (GCFP, LFPR, DCP, DCM and LCS), respectively.
In first approach, there is a positive relationship between economic growth and growth fixed capital formation at 1% significance level, with a coefficient equals 0.008, which means that if the GCFP increase by one unit the economic growth will increase by the previous value of the coefficient, there non-significant relationship between economic growth and number of primary classes, That is, increasing the number of primary classes does not affect economic growth in Egypt, finally there is a negative relationship between economic growth and labor participation rate force at 1% significance level, with a coefficient equals -0.013, which means that if the LFPR increase by one unit the economic growth will decrease by the previous value of the coefficient.
In second approach, there is a positive relationship between economic growth and growth fixed capital formation at 5% significance level, with a coefficient equals 0.0045, which means that if the GCFP increase by one unit the economic growth will increase by the previous value of the coefficient, there is a positive relationship between economic growth and number of preparatory classes at 5% significance level, with a coefficient equals 0.000001, which means that if the DCM increase by one class the economic growth will increase by the previous value of the coefficient, finally there is a negative relationship between economic growth and Labor participation rate force at 1% significance level, with a coefficient equals -0.015, which means that if the LFPR increase by one unit the economic growth will decrease by the previous value of the coefficient.
The third approach, there is a positive relationship between economic growth and growth fixed capital formation at 1% significance level, with a coefficient equals 0.008, which means that if the GCFP increase by one unit the economic growth will increase by the previous value of the coefficient, there is a positive relationship between economic growth and number of secondary classes at 1% significance level, with a coefficient equals 0.106, which means that if the LCS increase by one class the economic growth will increase by the previous value of the coefficient, finally there is a negative relationship between economic growth and labor participation rate force at 1% significance level, with a coefficient equals -0.011, which means that if the LFPR increase by one unit the economic growth will decrease by the previous value of the coefficient. We note that increasing the number of classes in secondary school has a strong moral impact on economic growth compared to the educational stages that preceded it. This may be due to the increase in government spending on secondary education and the increasing interest in it because it qualifies for university admission, and then its impact appears in the labor market. These results are consistent with economic theory and consistent with empirical studies by
| [1] | R. J. Barro, "Economic growth in a cross section of countries.," The quarterly journal of economics, vol. 106(2), pp. 407-443, 1991. |
| [13] | Gyimah-Brempong, Kwabena and W. Mitiku, ""Higher education and economic growth in Africa," The Journal of Development Studies, pp. 509-529., 2006. https://doi.org/10.1080/00220380600576490 |
| [15] | Deme, Mamit and. A. MA Mahmoud, "Effect of quantity and quality of education on per capita real-GDP growth: evidence from low-and middle-income African countries." Applied Economics, pp. 6248-6264, 2020. https://doi.org/10.1080/00036846.2020.1789058 |
| [52] | V. T. a. J. N. Ragoobur, "Early human capital: the driving force to economic growth in island economies," International Journal of Social Economics, Vols. 49 No. 11, 2022, pp. 1680-1695, 2022. https://doi.org/10.1108/IJSE-11-2021-0674 |
| [53] | K. R. Keller, "Investment in primary, secondary, and higher education and the effects on economic growth.," Contemporary Economic Policy, pp. 18-34, 2006. https://doi.org/10.1093/cep/byj012 |
| [54] | B. Seetanah, "The economic importance of education: Evidence from Africa using dynamic panel data analysis.", Journal of Applied Economics, vol. 12.1, pp. 137-157., 2009. https://doi.org/10.1016/S1514-0326(09)60009-X |
[1, 13, 15, 52-54]
on Africa.
4.3.6. Error Correction Model
Table 5 shows that the coefficients of ECT are -0.6417, -1.002, and - 0.752 for the first three approaches in model 1 respectively, which are a negative signs and it is significant at 1% significance level which indicate that 64%, 100% and 72% for the first three approaches in model 1 of adjustment from short run to long run can happen each year, which means that the adjustment is taken place after about 1.5, 1, 1.7 years respectively.
Table 6 shows that the coefficients of ECT are -0.711, -0.707, and -0.743 for the second three approaches in model 2 respectively which are a negative signs and it is significant at 1% significance level which indicate that 71%, 70% and 74% for the second three approach in model 2 of adjustment from short run to long run can happen each year, which means that the adjustment is taken place after about 1.7 years for everyone.
Serial Correlation
The test of Breusch-Godfrey Serial Correlation LM is used to check the serial correlation of the residuals and it found that there is no serial correlation between residuals for both models., thus the null hypothesis can be accepted which says that there is no serial correlation, hence there is no serial correlation in the residuals of both models.
Heteroskedasticity
The null hypothesis cannot be rejected which says that there is no Heteroskedasticity, hence there is no Heteroskedasticity in both models.
Normality test
The normality test is The Jarque-Bera P-value is above 0.05 in the two models, this means that residuals follow the normal distribution.
Finally, the study draws the CUSUM and CUSUMQ graphs to test the stability of the model. According to
Figures A1 to A14 in appendix, coefficients are between the critical bounds which denotes that the model is stable.