1. Background
Geopolitical conflict refers to armed confrontation between state and/or non-state entities over territory, ideology, resources and influence in the international system, where geography and spatial factors are key determinants of power relations. Flint argued that these conflicts are played out through diplomatic stand-offs, economic warfare, proxy wars and military confrontation
| [10] | Flint, C. (2021). Introduction to geopolitics. Routledge. |
[10]
. Some of the most prominent examples of geopolitical wars include the 1973 Arab-Israeli War, the 1990-1991 Gulf War, the attacks of 9/11, the Libyan civil war, the war between Russia and Ukraine, and the war between Israel and Palestine and the escalation to the US-Israel-Iran war
.
In today's interconnected and global world, the link between geopolitical conflicts and energy markets is a key component of policy discourse. Oil is one of the most strategically significant depletable commodities in the global economy, providing more than 90% of the global transport energy
. Oil markets are therefore very sensitive to not only the traditional supply and demand factors, but also to wider political and strategic developments. Energy markets have also tended to become more volatile during times of geopolitical tension
| [35] | Verduzco Bustos, G., & Zanetti, F. (2026). The effects of geopolitical oil price shocks. CESifo Working Paper No. 12606. |
[35]
. A key outcome of such uncertainty is oil price volatility. This refers to the degree of fluctuation in oil prices over time. Unlike price levels, volatility captures the intensity and unpredictability of price movements
.
There is considerable evidence that geopolitical conflicts and oil price volatility have been closely linked in the past. In the Arab-Israeli war of 1973, for instance, Corbett noted that crude oil prices had risen from $2.90 to $11.65 per barrel from October of 1973 to January of 1974
| [8] | Corbett, M. (2013). Oil shock of 1973–74. Federal Reserve History, 22. |
[8]
. Likewise, Brent Crude oil prices have jumped 8% to hit $100 for the first time since the Russian invasion of Ukraine on 24 February 2022
. These events demonstrate the swiftness of oil markets' reaction to geopolitical conflicts. But it remains to be seen how such dynamics would work in the case of the 2026 US-Israel-Iran war.
The US–Israel–Iran war is a multi-state conflict involving direct military confrontation between Israel and Iran, with the US intervening in support of Israel. Huggard and Yadwad attribute the war to a series of rising tensions between Iran and the US-Israel bloc after a series of failed nuclear talks and growing regional turmoil in the Middle East involving Tehran-backed Hezbollah and Houthis
| [11] | Huggard K., & Yadwad, M. (2026). The road to the Israel-Iran war. Brookings. |
[11]
. On 1st April 2024, the direct confrontation between Israel and Iran was made apparent. In early 2025, there were some short-lived ceasefires and renewed diplomatic efforts, but negotiations failed. On 13th June 2025, Iran-US negotiations were suspended; Israel launched strikes on Iranian nuclear and military facilities. The situation significantly worsened on 21st June 2025 when the US bombed three Iranian nuclear facilities, Fordow, Isfahan, and Natanz
| [11] | Huggard K., & Yadwad, M. (2026). The road to the Israel-Iran war. Brookings. |
[11]
.
In response to the US-Israel attacks, Iran actively launched missiles and drone attacks across all the six Gulf Cooperation Council (GCC) states. The GCC states are of strategic significance for the world, due to their oil reserves. According to Worldometer (n.d.), GCC states accounts for over 48% of the world’s oil reserves: Qatar (1.43%), Kuwait (5.75%), United Arab Emirates (6.40%), Iraq (8.22%), Iran (11.82%) and Saudi Arabia (15.14%)
. Yet, the attacks on the GCC states have also been directed at commercial, shipping and energy infrastructure linked to the US. The damages to key energy infrastructure in the Iran-related attacks include United Arab Emirates (UAE) Ruwais refinery and Fujairah's petrochemical and storage complex; the Kuwaiti refineries, including the Mina Al Ahmedi refinery; and the transport and logistics infrastructure in Oman, including bypass routes to the Strait of Hormuz; refineries in Saudi Arabia, such as Yanbu and Ras Tanura
.
On 2nd March 2026, Iran closed the Strait of Hormuz, which is the world’s most critical chokepoints for oil transportation
. This Strait is a narrow sea passage, separating the Iran and Arabian Peninsula, and connecting the Persian Gulf with the Arabian Sea and the Gulf of Oman. It handles approximately 19% of global Liquefied Natural Gas (LNG) trade and about 25% of world’s seaborne oil trade; an average of 5 million barrels per day (mb/d) of oil products and 20 mb/d of crude oil were exported via the Strait of Hormuz in 2025 alone
.
Table 1 below provides a summary of the key events in the US-Israel-Iran war.
Table 1. A chronological summary of the major events in the war between the United States and Israel and Iran.
Year | Key Event in the US–Israel–Iran War |
1st April, 2024 | Iran and Israel exchange missile and air strikes for the first time |
September-December 2024 | Hezbollah-Israel war escalates |
March-May 2025 | Attempts to revive nuclear diplomacy fails |
13th June 2025 | Israel-Iran war breaks out; Israel attacks Iran’s nuclear facilities; Iran-US negotiations are suspended |
21st June 2025 | US bomb three Iranian nuclear facilities: Fordow, Isfahan, and Natanz |
February 2026 | US joins Isreal’s military operations in Iran |
March 2026 | Closure of the Strait of Hormuz |
2026-Present | The US-Israel-Iran war is ongoing |
Source: Adapted from Huggard & Yadwad
| [11] | Huggard K., & Yadwad, M. (2026). The road to the Israel-Iran war. Brookings. |
[11]
and No et al.
| [29] | No, S., Sam, R., Sokha, C., & Hour, R. (2026). The Global Economic Impact of the US–Israel–Iran Conflict. European Journal of Management, Economics and Business, 3(3), 1-15. |
[29]
.
Currently, the strait of Hormuz remains closed by Iran (despite a one-day reopening on 17th April 2026). In the meantime, the US has imposed a naval blockade on Iranian ports since 13th April, 2026. The closure of this Strait following the US-Israel war with Iran has brought about 10% dip in global oil supplies with a substantial outage in oil exports from the region; hardest hit countries being Bahrain, Kuwait, Qatar, and Iraq
| [20] | Krane, J. & Alexander, J. (2026). Gulf oil, gas exporters grapple with losses from closed Strait. Oil and Gas Journal. |
[20]
. A ceasefire has been in effect for about three weeks so far, but it is unclear whether it will last or whether the conflict will continue
.
Based on the above, the following two research questions were raised in this study. First, how do US–Israel–Iran conflict affect the oil price volatility? Second, what are the economic implications of oil price volatility caused by geopolitical conflicts in frontier oil importing countries such as Kenya? This study is one of the few studies that examines the oil volatility transmission effects of conflict in frontier African economies.
3. Methodology
In this study, the relationship between geopolitical conflict and the volatility of oil prices was analyzed during the period of the US–Israel–Iran conflict using a quantitative time-series research design. The analysis was centered on geopolitical tensions and their effect on oil market volatility and the resulting macroeconomic consequences for frontier oil-importing countries like Kenya. The secondary data for Brent crude oil prices and Geopolitical Risk (GPR) index were processed in Excel and analysed using the R software for statistical analysis.
Spot prices for Brent crude oil were used as a proxy for oil price volatility in the study. Daily Brent crude oil spot prices were sourced from the US Energy Information Administration (EIA) from the Federal Reserve Economic Data (FRED) database. Next, oil price returns were calculated with the help of the log transformations that estimated the conditional volatility. On the other hand, geopolitical conflict was operationalized using the Geopolitical Risk (GPR) Index developed by Caldara and Iacoviello
. It is an index reflecting geopolitical tensions, calculated from the prevalence of geopolitical-related terms in 10 major international newspapers. The index consists of sub-components in eight dimensions: geopolitical threats (GPRT) and geopolitical acts (GPRA). The GPRT is based on 5 dimensions: terror threats (dimension 5), nuclear threats (dimension 4), military buildups (dimension 3), peace threats (dimension 2) and war threats (dimension 1). On the other hand, GPRA covers commencement of war (dimension 6), escalation of war (dimension 7) and terror acts (dimension 8).
The study period began on 1st April 2024 after the first direct missile and air-strike exchange between Israel and Iran. This was the first time that the conflict had become direct between the states and not indirect through regional tensions and proxy wars. This study opted for daily observations because of the high frequency nature of geopolitical shocks and oil price volatility.
The study estimated an Exponential Generalized Autoregressive Conditional Heteroskedasticity (EGARCH) (1,1)-X model to examine the volatility dynamics of Brent crude oil returns and the influence of geopolitical risk (GPR) on oil market volatility. The model incorporated an Autoregressive Moving Average (ARMA) (1,1) process in the mean equation, an EGARCH (1,1) specification for the conditional variance, a student-t distribution to account for fat tails in financial returns, and the GPR Index as an exogenous regressor in the variance equation. The EGARCH framework was selected because it captures volatility clustering, accommodates asymmetric volatility effects, and avoids non-negativity constraints typical of standard GARCH models. The model was as follows;
Let denote the log return of Brent crude oil at time . The conditional mean equation is given by:
In this case, μ is a constant term, is the error term, ϕ represents autoregressive dynamics and θ represents moving-average dynamics. The error term is:
Here, is a conditional variance and is an independently and identically distributed (i.i.d.) random variable with a standardized Student-t distribution (mean of 0 and a variance of 1).
An EGARCH (1,1)-X involving the following specification was used to model volatility dynamics:
where: is a constant, captures volatility persistence, measures the magnitude (size) effect of shocks, captures asymmetric (leverage) effects, denotes the geopolitical risk index, measures the impact of geopolitical risk on conditional volatility.
The study made the following assumptions to address the excess kurtosis in oil returns:
where is the degrees-of-freedom parameter governing tail thickness. This specification breaks from the restrictive normality assumption, and provides more realistic models for extreme price moves.
The non-negativity constraints on parameters are not required since the exponential form of the variance equation guarantees that the that . The persistence of volatility is measured by β, and the asymmetric sensitivity to shocks by γ. is included so that direct tests can be performed to assess whether geopolitical risk has an incremental explanatory power on the volatility of the oil price beyond internal market dynamics.
4. Results and Discussion
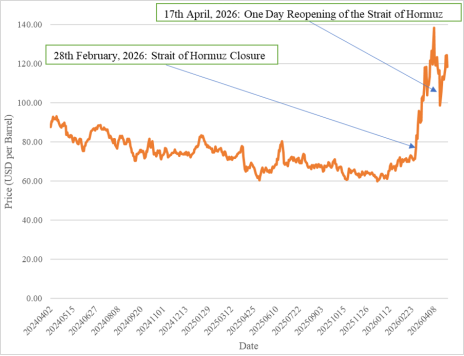
This section presents and discusses the study’s findings on the impact of the 2026 US–Israel–Iran conflict on Brent crude oil price volatility and how this impact shape economic outcomes in frontier oil-importing countries. The chart below (
Figure 1) shows how prices for Brent crude oil have changed over time during the US-Israel-Iran war.
Figure 1. Trends in Brent Crude Oil Prices Following US-Israel-Iran War.
From
Figure 1 above, Brent oil prices fluctuated moderately within the range of approximately $60–$90 per barrel between April 2024 and late 2025, despite key geopolitical events within the period. Some of these events included missile attacks between Israel and Iran, the escalation of the Hezbollah-Israel conflict, and the collapse of nuclear diplomacy in early 2025. This relative stability implies that markets saw these events as being contained risks in the region. But in early 2026, oil prices jumped significantly. The biggest rise was after 28 February 2026, when Iran closed the Strait of Hormuz. Markets responded to worries about significant supply shocks, with Brent prices climbing above $120 per barrel. The one-day reopening of Hormuz on 17th April 2026 briefly calmed prices but further closure and uncertainty kept global oil markets more volatile with higher risk premiums.
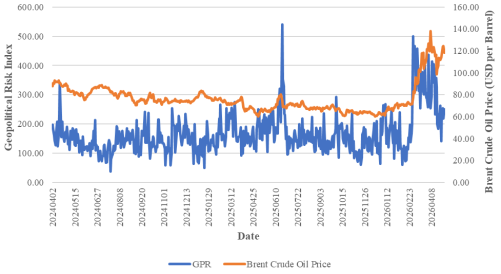
The graph in
Figure 2 below indicates that geopolitical risk and Brent crude oil prices move in a broadly positive direction, but not perfectly together.
Figure 2. Trends in Geopolitical Risk and Brent Crude Oil Prices Following US-Israel-Iran War.
The GPR index has been very volatile, peaking in highly uncertain periods, as seen in
Figure 2 above, whereas the prices of Brent have been fluctuating over the same timeframe but with lesser magnitude. The pattern suggests that a rise in geopolitical tension is associated with a rise in oil prices. At the same time, the relationship is not one-to-one. Brent oil prices do not rise every time geopolitical risk spikes, which means other forces also influence oil prices. Overall, the graph supports the conclusion that geopolitical risk has an important but partial effect on Brent crude oil price movement. This is consistent with the correlation coefficient of 0.414, which indicates a moderate positive relationship between GPR and Brent crude oil prices over the period studied.
4.1. Descriptive Statistics
Table 2. Descriptive Statistics for Brent Returns and GPR Index.
Variable | Mean | Variance | Skewness | Kurtosis |
Brent Returns | 6e-04 | 6e-04 | -0.4878 | 10.2462 |
GPR Index | 166.1284 | 4970.2559 | 1.7607 | 7.4491 |
4.1.1. Brent Crude Oil Returns
Mean: The average daily Brent crude oil return (Mean = 0.0006) is positive but very close to zero. This indicates that oil returns fluctuate around a relatively stable average; there is no strong persistent upward or downward daily movement during the sample period. Such small mean returns are typical in daily financial time series.
Variance: The variance measures the dispersion of returns around the mean. The relatively small variance (Variance = 0.0006) suggests a moderate day-to-day return fluctuation.
Skewness: The Brent return distribution is negatively skewed (Skewness = -0.4878). This implies that large negative returns occur more frequently than large positive returns, downside risk is slightly more pronounced. Negative skewness is common in oil and financial markets because adverse geopolitical events, supply disruptions, economic uncertainty, and market panic often generate stronger negative price movements than positive shocks.
Kurtosis: The kurtosis value (Kurtosis = 10.2462) is substantially greater than 3. This indicates that Brent returns are leptokurtic; the distribution has fat tails and extreme observations occur more frequently than under a normal distribution. Put differently, the oil market experience occasional extreme shocks, volatility spikes are more common than predicted by a normal distribution.
4.1.2. GPR Index
Mean: The average GPR level during the study period was approximately 166. This indicates a relatively elevated geopolitical tensions over the sample period. Given the 2024–2026 sample period, elevated GPR levels reflect the ongoing geopolitical conflict; the US-Irael-Iran war. The result suggests that geopolitical risk remained persistently relevant during the study horizon.
Variance: The very high variance (Variance = 4970.2559) indicates substantial fluctuations in geopolitical risk over time. This means that geopolitical conditions changed considerably across the sample period; periods of relative calm alternated with sharp geopolitical escalations. This variability reflects the episodic nature of geopolitical events.
Skewness: The GPR index is strongly positively skewed (Skewness = 1.7607). This implies most observations were moderate but there were occasional extreme spikes in geopolitical risk. The behavior is consistent with the structure of geopolitical events because geopolitical tensions are usually dormant or moderate but major crises generate sudden sharp increases in risk indicators. The positive skewness confirms the presence of rare but severe geopolitical shocks.
Kurtosis: The kurtosis (Kurtosis = 7.4491) exceeds the normal benchmark of 3, indicating that the GPR distribution is leptokurtic. This means extreme geopolitical events occur more frequently than under normality; geopolitical shocks are concentrated and episodic rather than evenly distributed. This finding aligns with real-world geopolitical behavior where wars or global crises occur irregularly but produce disproportionately large effects.
In conclusion, Brent returns exhibit negative skewness, extreme kurtosis, non-normality, heavy tails. On the other hand, the GPR index displays high average geopolitical tension, strong positive skewness, substantial volatility, and fat tails. These features are consistent with the theoretical expectation that geopolitical tensions occur in bursts. This confirms that geopolitical risk behaves as an irregular shock process characterized by occasional extreme escalations.
4.2. Econometric Analysis Results
4.2.1. Pre-estimation Results of Stationarity Tests
The Augmented Dickey-Fuller (ADF) test was conducted on Brent crude oil returns. The study found a p-value = 0.01<0.05. Consequently, the null hypothesis of a unit root at the 5% significance level was rejected. This finding implies that Brent return series was stationary; the statistical properties of the series remain stable over time and the return series is appropriate for volatility modelling.
The Autoregressive Conditional Heteroskedasticity Lagrange Multiplier (ARCH-LM) test was conducted on raw Brent returns and ARMA residuals. The ARCH-LM test rejects the null hypothesis of homoskedasticity at the 5% significance level (χ² = 141.71, p = 2.2e-16). This result confirmed the presence of ARCH effects and volatility clustering in Brent crude oil returns. The ARCH-LM test performed on the residuals of the ARMA (1,1) model strongly rejected the null hypothesis of no ARCH effects (χ² = 137.22, p = 2.2e-16). This indicated that conditional heteroskedasticity persists even after modelling the conditional mean. Therefore, these findings justify the estimation of an EGARCH-type volatility model.
4.2.2. Estimated Mean Equation (ARMA (1,1))
Based on ARMA (1,1) model estimation, the estimated coefficients give the conditional mean equation below for Brent crude oil returns:
where: = Brent crude oil return at time , = constant mean return (), = AR (1) coefficient, = MA (1) coefficient, = error term (innovation).
The constant term () is negative but statistically insignificant . This indicates that the average daily Brent crude oil return is not significantly different from zero over the sample period.
Autoregressive Component () is positive and highly significant . This result suggests the presence of short-run dependence in Brent crude oil returns. Put differently, past returns contain useful predictive information about current returns. Therefore, there is delayed market adjustment to geopolitical developments during the US–Israel–Iran conflict period.
Moving Average Component () is negative and highly significant . The negative sign suggests that part of the effect of past shocks is reversed in subsequent periods, reflecting short-term market correction dynamics.
The statistically significant AR (1) and MA (1) terms confirm that Brent crude oil returns exhibit meaningful short-run linear dependence. Including the ARMA (1,1) structure therefore improved the specification of the conditional mean process and ensured that the volatility captured by the EGARCH model is not driven by omitted autocorrelation effects. This supports the reliability of the subsequent volatility estimates obtained from the EGARCH-X framework.
4.2.3. EGARCH-X Model: Variance Equation Results
The variance equation estimated the dynamics of conditional volatility. The estimated EGARCH (1,1)-X Variance Equation yields.
where: denotes conditional oil price volatility, represents the persistence parameter (), is the ARCH effect coefficient (), captures asymmetry/leverage effects (), measures the effect of geopolitical risk on volatility (), and is the geopolitical risk index.
Volatility Persistence (0< β₁ <1)
The coefficient on β₁ (0.8701) was positive and highly significant (p-value =0.000100, which is less than 0.05). A value of 0.87 shows that about 87% of previous period volatility carried over into the current period. This finding implies that volatility shocks generated during the conflict period dissipated slowly over time, resulting in prolonged market uncertainty. Put differently, conditional volatility was largely driven by its own historical dynamics. Therefore, there is strong volatility persistence in Brent crude oil returns.
Short-Run Shock Effect (α₁)
The ARCH coefficient () is positive but statistically insignificant. Approximately 1.19% of current volatility is explained by new short-run shocks or recent innovations. This implies that immediate market shocks have limited short-run effects on Brent Crude oil price volatility. Therefore, volatility dynamics during the conflict period were largely driven by persistent market conditions rather than isolated daily innovations or transitory shocks. This indicates that oil market participants absorb new information relatively efficiently and oil price volatility evolves gradually.
Asymmetric/Leverage Effect
Asymmetric/Leverage Effect (γ₁) of 0.1093 implies that negative shocks increase volatility by approximately 10.93% more than positive shocks of the same magnitude. Nonetheless, there is insufficient statistical evidence (p-value = 0.28, which is greater than 0.05) to conclude that asymmetric effects actually existed during the US-Israel-Iran conflict period. The absence of a substantial leverage effect suggests that Brent price volatility responded similarly to favourable and unfavourable market news and that the sample period may not have contained sufficiently asymmetric oil market shocks.
Effect of GPR
The estimated coefficient on geopolitical risk (0.1245) suggests that a one-unit increase in the GPR index corresponds to an approximate 12.45% rise in conditional volatility. However, the coefficient is statistically insignificant (P-value =0.5 > 0.05). The insignificance could mirror market adaptation to geopolitical news, diversification of global oil supply chains, limited transmission of geopolitical shocks into oil volatility during the sample period, or even relatively short sample duration. Nonetheless, the empirical evidence in this study does not support a robust volatility transmission effect over the US-Israel-Iran conflict period.
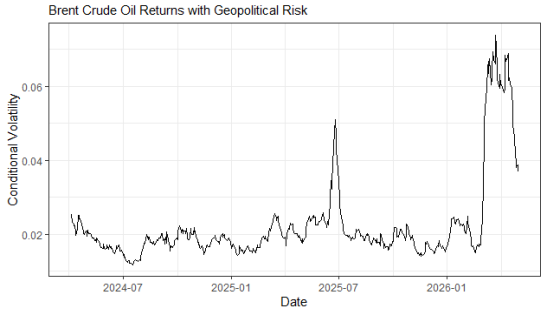
Figure 3. Estimated Conditional Oil Price Volatility from EGARCH-X Model.
From
Figure 3 above, the conditional volatility series exhibits pronounced clustering. Periods of relative stability are interrupted by sharp and persistent volatility spikes. In particular, volatility remains subdued during 2024–2025 but increases substantially in 2026 with the closure of the Strait of Hormuz. The persistence of elevated volatility following these shocks aligns with the estimated EGARCH parameter (
), confirming strong volatility persistence. Notably, while volatility spikes coincide with periods of geopolitical escalation, the pattern is episodic rather than continuously driven by geopolitical risk. This is consistent with the statistically insignificant GPR coefficient (0.1245). Therefore, geopolitical uncertainty influences oil price volatility through discrete shock episodes rather than a stable linear transmission mechanism.
Distributional Characteristics
The estimated shape parameter of the student-t distribution (ν = 9.652994) indicates the presence of fat tails in Brent crude oil returns. This finding suggests that extreme price movements occur more frequently than would be implied under a normal distribution, although the degree of tail heaviness is moderate. In practical terms, geopolitical shocks can still generate large price movements, but such events are relatively infrequent and not excessively extreme.
4.2.4. Diagnostic Tests
This study also conducted two post-estimation diagnostic tests: Ljung-Box test on standardized residuals and ARCH-LM test on standardized residuals. These tests evaluated whether the estimated EGARCH-X model adequately captured the underlying oil price volatility structure. In the Ljung-Box Test, the study found a p-value = 0.296; the null hypothesis of no serial correlation could not be rejected. On the other hand, the ARCH-LM Test showed a p-value = 0.958; the null hypothesis of no ARCH effects could not be rejected. The combined diagnostic tests indicate that the EGARCH-X model was well specified. This confirm that the EGARCH-X model adequately captured the volatility dynamics of Brent crude oil returns, producing statistically reliable and stable estimates.
In sum, the econometric findings from the EGARCH-X model showed that i) Brent oil volatility is primarily driven by its own persistence and ii) geopolitical risk arising from the US-Israel-Iran conflict plays a limited direct role in explaining short-run volatility fluctuations during the study period.
4.3. Economic Implications of Conflict-induced Oil Price Volatility in Kenya
Kenya is an East African lower middle-income country which is completely dependent on petroleum imports to meet its energy needs. About 90% of the petroleum imports are of refined white products such as diesel, super petrol and dual-purpose kerosene
. The estimated annual consumption of petroleum is around five million metric tons. The International Energy Agency attributes this consumption to 3 main sectors. These sectors comprise transport (75,4%), residential (7,7%) and industry (6%)
.
In 2013, Kenya Petroleum Refineries Limited (KPRL), stopped processing crude oil. The KPRL is currently a storage, handling, laboratory and distribution facility
. Kenya is reliant on imported refined petroleum products, despite plans to build another refinery in Lamu. In 2024, Kenya imported about 128.2% of its total oil product consumption in net terms. During this period, petroleum products made up of almost 83% of Kenya's total energy imports
. In addition, the import of oil products rose by around 276% from 2000 to 2024
. This surge demonstrates Kenya's increased vulnerability to international energy market shocks.
Kenya is also exposed to geopolitical oil market shocks due to its oil supply configuration. The country has a government-to-government (G2G) petroleum import deal with large petroleum companies from GCC states. These firms include Saudi Aramco, the Abu Dhabi National Oil Company (ADNOC), and the Emirates National Oil Company
. It is worth noting that all the petroleum shipments in this deal pass through the Strait of Hormuz. As such, the closure of the Strait has colossal implications for Kenya's fuel supply chain and energy security.
The earlier estimated EGARCH-X results suggested that geopolitical risk does not have a statistically significant direct impact on the volatility of Brent crude oil. However, the model showed high volatility persistence and significant volatility spikes in the 2026 US–Israel–Iran conflict period. The results indicate that oil markets reacted primarily to the perceived supply disruption risk from the closure of the Strait of Hormuz. In Kenya, transmission of these shocks is mainly through international trade channels. Disruptions in shipping routes through the Gulf increase the cost of importing refined petroleum products to Kenya. This has further implications discussed below.
4.3.1. Rise in Consumer Prices
The oil price volatility experienced in Kenya as a result of conflict has a macroeconomic impact on the country through the increase in consumer prices due to higher cost of refined petroleum products imports. The disruption of global oil supply chains and increased uncertainty regarding the closure of the Strait of Hormuz increases the cost of oil imports which is transferred to domestic fuel prices in oil importing countries. All refined petroleum products are imported into Kenya under a price build up mechanism which includes Free on Board (FOB) costs, freight, premiums and local currency factors. This pricing factors in shocks in global oil markets. This is consistent with the observation of Muggah that Iran is internationalizing costs of the war by imposing a global surcharge via insurance and shipping costs
.
The US-Israel–Iran conflict contributed to increased disruption of oil supply chains. This is evident in the surge in Global Supply Chain Pressure Index (GSCPI). Between January and April 2026, GSCPI increased from 0.44 to 1.82
. Further, the monthly Consumer Price Index (CPI) for Kenya increased from 148.96 to 152.15 over the same period
| [16] | KNBS (2026.) The Kenya Consumer Price Index and Inflation Report: April 2026. |
| [17] | KNBS (2026.) The Kenya Consumer Price Index and Inflation Report: March 2026. |
| [18] | KNBS (2026.) The Kenya Consumer Price Index and Inflation Report: February 2026. |
| [19] | KNBS (2026.) The Kenya Consumer Price Index and Inflation Report: January 2026. |
[16-19]
. This points to growing inflationary pressures. Subsequently, fuel prices also rose significantly as indicated in
Table 3 below. For example, petrol prices went up by 10.8% between March and April 2026. In addition, diesel prices increased by 17.9% in the same period
| [16] | KNBS (2026.) The Kenya Consumer Price Index and Inflation Report: April 2026. |
| [17] | KNBS (2026.) The Kenya Consumer Price Index and Inflation Report: March 2026. |
| [18] | KNBS (2026.) The Kenya Consumer Price Index and Inflation Report: February 2026. |
| [19] | KNBS (2026.) The Kenya Consumer Price Index and Inflation Report: January 2026. |
[16-19]
.
Table 3. Consumer Price Indices and Prices of Selected Petroleum Products for the January-April 2026 period.
| January | February | March | April |
Overall CPI | 148.96 | 149.2 | 150 | 152.15 |
Petrol (KSH per Litre) | 183.59 | 179.35 | 179.35 | 198.67 |
Diesel (KSH per Litre) | 171.64 | 167.72 | 167.72 | 197.81 |
Gas/LPG (KSH per 13 Kgs) | 3,146.51 | 3,134.75 | 3,132.34 | 3,361.56 |
Source: Kenya National Bureau of Statistics (KNBS)
| [16] | KNBS (2026.) The Kenya Consumer Price Index and Inflation Report: April 2026. |
| [17] | KNBS (2026.) The Kenya Consumer Price Index and Inflation Report: March 2026. |
| [18] | KNBS (2026.) The Kenya Consumer Price Index and Inflation Report: February 2026. |
| [19] | KNBS (2026.) The Kenya Consumer Price Index and Inflation Report: January 2026. |
[16-19]
.
The rise in fuel prices had significant second-round inflationary impacts on the economy, including in the transport sector, which consumes about 75.4% of refined petroleum in Kenya
. For instance, KNBS noted that items under the transport sector rose by 6.5% between March and April 2026 (coinciding with the closure of the Strait of Hormuz
| [19] | KNBS (2026.) The Kenya Consumer Price Index and Inflation Report: January 2026. |
[19]
. The urban public transport fares then jumped up by 7.1%, inter-town bus fares by 9.7% and motorcycle (boda boda) transport fares by 6.1%
| [19] | KNBS (2026.) The Kenya Consumer Price Index and Inflation Report: January 2026. |
[19]
.
Transportation costs are one of the major inputs in the distribution of food and other commercial activities, and thus higher transportation costs are a partial reason for the wider rise in consumer prices for other non-fuel items. The fiscal pressures already experienced in Kenya are high due to the high levels of public debt obligations, fiscal space, and limited access to affordable external financing
| [28] | National Treasury and Economic Planning (2026). 2026 Budget Policy Statement. |
[28]
. In this context, the spillover effect of oil price volatility due to the US-Israel-Iran conflict may put further pressure on the government's finances and household incomes. Higher fuel import prices raise inflationary pressures, raise cost of living and reduce household purchasing power on the one hand. On the other hand, the increasing import prices for fuels pose a challenge to the government's macroeconomic stability as mentioned in the next Section 4.2.2 of the study.
4.3.2. Increase in Import Bill and Exchange Rate Pressures
The high price of imported petroleum products has led to the increase in the national fuel import bill in Kenya. Kenya is an economy that is fully dependent on oil imports
. Consequently, any global increase in oil prices, stemming from geopolitical tensions or disruption of supply in the Strait of Hormuz, has a substantial impact on the country's fuel import spending. Increase in importation cost means that Kenya has to import the same quantity of petroleum products with more foreign currency, especially U.S dollars. This will result in more import spending than export revenue. This puts pressure on Kenya's balance of payments particularly in light of the high public debt burden and financing pressures of the Kenyan economy
| [28] | National Treasury and Economic Planning (2026). 2026 Budget Policy Statement. |
[28]
.
Kenya imports refined petroleum products in US dollars
. An increase in the cost of fuel imports leads to a higher demand for foreign exchange reserves, especially for US dollars. This exerts depreciation pressure on the Kenyan shilling. This vulnerability was more pronounced before the enactment of the G2G petroleum import framework in April 2023
. The Kenya had very tight US dollar liquidity during this time, partly due to the high cost of international fuel imports, high demand for foreign exchange and the tightening of international financial conditions after the US Federal Reserve hiked interest rates aggressively. The US dollar continued to be the settlement currency for petroleum imports under the G2G framework, but the framework changed the timing and the nature of foreign exchange demand for petroleum imports, by increasing the credit period from 30 to 180 days
| [23] | Mansour, H. (2026). Maritime Transport Disruptions and Oil Price Volatility: A GARCH-MIDAS Scenario Analysis of Strait of Hormuz Closure. Available at SSRN 6422678. |
[23]
. This has dampened the buying pressure on US dollars in the short term.
The G2G framework released around 30% of the foreign exchange to other sectors of the economy, which slowed down the shilling depreciation rate as per the National Treasury and Economic Planning
. But the closure of the Strait of Hormuz in the US-Israel-Iran conflict could undermine these stabilization gains. The closure of the Strait of Hormuz has heightened the supply disruption risks. Kenyans already face higher consumer prices and higher national import bills despite the existence of the G2G mechanism. In other words, the existing G2G framework is not sufficient to protect Kenya from external oil market shocks and import cost and inflationary spillovers.