Research Article | | Peer-Reviewed

Mobile Money and Population Well-Being in Sub-Saharan Africa: Evidence from Staggered Difference-in-Differences

Received: 7 October 2026     Accepted: 22 October 2026     Published: 11 November 2026
Views:       Downloads:
Abstract

Mobile money has spread faster in Sub-Saharan Africa than in any other region, yet its contribution to the non-monetary dimensions of well-being remains poorly documented at the regional scale. This paper assesses the effect of electronic money on population well-being in the forty-nine countries of Sub-Saharan Africa over 1995-2022. Following the capability approach, well-being is measured by the Human Development Index (HDI) and its health, education and standard-of-living components, complemented by the inequality-adjusted HDI and infant mortality. Electronic money is measured directly, by the launch date of the first mobile money service and by usage intensity from the IMF Financial Access Survey, rather than by mobile phone penetration. Identification relies on difference-in-differences estimators robust to staggered adoption and heterogeneous effects, complemented by system GMM and fixed-effects regressions on usage intensity. Averaged over the post-launch years, launch is associated with an increase in the health index of 0.020 to 0.029 points, i.e. 1.3 to 1.9 years of life expectancy at birth; the dynamic effect builds up gradually and reaches about 0.043 points after eight years. System GMM points to a long-run effect of about 0.021 points on the HDI. Active accounts transmit broader gains than registered accounts, whereas mobile phone penetration has no effect. No effect is found on education or infant mortality. Two results qualify the causal interpretation of the health effect: the pre-launch event-study coefficients, although small, are jointly significant, and the effect disappears when year effects are allowed to vary with initial HIV prevalence. The health estimates should therefore be read as an upper bound. Overall, the evidence is consistent with mobile money improving mainly the health dimension of well-being, and public policies should target the effective use of accounts rather than mere account ownership.

Published in International Journal of Economics, Finance and Management Sciences (Volume 14, Issue 6)
DOI 10.11648/j.ijefm.20261406.12
Page(s) 464-478
Creative Commons

This is an Open Access article, distributed under the terms of the Creative Commons Attribution 4.0 International License (http://creativecommons.org/licenses/by/4.0/), which permits unrestricted use, distribution and reproduction in any medium or format, provided the original work is properly cited.

Copyright

Copyright © The Author(s), 2026. Published by Science Publishing Group

Keywords

Mobile Money, Financial Inclusion, Human Development, Health, Staggered Difference-in-Differences, Sub-Saharan Africa

1. Introduction
In less than two decades, Sub-Saharan Africa has become the world's leading hub of electronic money. Since the launch of M-Pesa in Kenya in 2007, forty-six of the forty-nine countries of the region have seen at least one mobile money service emerge. By the end of 2023, the region accounted for about 835 million registered accounts, nearly half of the global total, and for almost two-thirds of the global value of transactions . According to the Global Findex survey, the share of adults in the region holding a mobile money account rose from 27% in 2021 to 40% in 2024 . In about twenty countries, all located in the region, more adults hold a mobile money account than a bank account . For a large part of the population, mobile money is therefore the first gateway into the financial system.
This diffusion is taking place in the region of the world where human development is the lowest. Despite considerable progress, including a gain of nearly twelve years of life expectancy between 1995 and 2022, more than one-third of the region's human development potential is still lost to inequality, and the number of people living in extreme poverty has increased, from about 282 million in 1990 to 464 million in 2024 . Whether electronic money improves population well-being is therefore a question of major interest for monetary and development policies.
The microeconomic literature suggests a positive answer. In Kenya, households using M-Pesa maintain their consumption after a negative shock thanks to transfers received from their network , and access to the service is estimated to have lifted about 2% of households out of extreme poverty . Comparable results have been obtained in Uganda , Tanzania , Mozambique and Cameroon . These studies nevertheless have three limitations. They cover a small number of countries, mainly in East Africa. They measure well-being through consumption or resilience rather than through its non-monetary dimensions, notably health and education. Finally, some experimental evaluations find weak effects in the most remote rural areas , which raises questions about the generality of the results.
Macroeconomic studies, which cover more countries, suffer from two weaknesses. First, they frequently measure mobile money by mobile phone penetration , although owning a phone guarantees neither access to a mobile money service nor its use. Second, they rely on two-way fixed-effects regressions or on the generalized method of moments, which ignore the staggered timing of launches. Yet when treatment is adopted at different dates and its effects build up gradually, the two-way fixed-effects estimator can be severely biased, and may even change sign, because it implicitly uses already-treated countries as controls .
This paper makes three contributions. First, it extends the evaluation of the effects of electronic money to all forty-nine countries of Sub-Saharan Africa and to the three dimensions of human development, complemented by the inequality-adjusted HDI and infant mortality. Second, it measures electronic money directly, by the launch date of the first mobile money service and by usage intensity drawn from the International Monetary Fund's Financial Access Survey (FAS), rather than by mobile telephony. Third, it relies on difference-in-differences estimators that are robust to staggered treatment adoption , complemented by system GMM and by regressions on usage intensity, so that its conclusions rest on the convergence of methods based on different identifying assumptions.
The results suggest that electronic money mainly affects the health dimension of well-being: averaged over the post-launch years, its launch is associated with an increase in the health index of 0.020 to 0.029 points, i.e. 1.3 to 1.9 years of life expectancy, and the dynamic estimates follow a gradual profile that reaches about 0.043 points eight years after launch. The estimate survives the inclusion of country-specific linear trends, linear controls for the HIV epidemic and the exclusion of the priority countries of the United States' AIDS relief programme. System GMM reveals a long-run effect on the HDI of about 0.021 points. Active accounts, which measure effective use, transmit broader gains than registered accounts, and mobile phone penetration has no effect on any dimension. By contrast, no effect is detected on education or infant mortality. Two findings limit the causal interpretation of the health result and are given full prominence in the paper: the pre-launch coefficients of the event study are jointly significant (p = 0.001), and a specification allowing for non-linear dynamics of the HIV epidemic eliminates the health effect. We therefore interpret the health estimates as an upper bound, and the evidence as consistent with, rather than proof of, a causal effect of mobile money on health.
The remainder of the paper is organized as follows. Section 2 presents the transmission channels and reviews the literature. Section 3 describes the data, the stylized facts and the empirical strategy. Section 4 presents the results, their robustness and their limitations. Section 5 discusses the results and draws policy implications, and Section 6 concludes.
2. Transmission Channels and Literature Review
2.1. Transmission Channels
Electronic money is monetary value stored in electronic form, issued against the receipt of funds and accepted as a means of payment by third parties . Being fully backed by bank deposits, it does not create new money; it changes the way money circulates. Four channels link this innovation to well-being.
The first channel is the reduction of transaction costs . Before mobile money, a transfer between two distant localities required a costly trip or recourse to an informal intermediary, with a high risk of loss or theft. Denoting by τ the proportional cost and by F the fixed cost of a transfer T, the amount received, 1-τT-F, increases when mobile money reduces these costs, and the fall in the fixed cost makes profitable small transfers that did not previously exist. The cost of sending remittances to Sub-Saharan Africa, the highest in the world, illustrates what is at stake: it averaged 7.9% in the fourth quarter of 2023, but mobile network operators are among the cheapest channels .
The second channel is risk sharing. In the absence of formal insurance, rural households rely on mutual-aid networks whose effectiveness is limited by the correlation of shocks within communities . By reducing the cost of remote transfers, mobile money extends these networks to relatives living in cities or abroad, whose incomes are less correlated . This channel is particularly relevant for health: health shocks are frequent and costly, and rapid financing of care prevents treatment from being delayed .
The third channel is the securing of savings. Poor households save through unsafe informal instruments , and access to a safe place to keep money increases savings devoted to health . Mobile money offers such an instrument. In the health capital model of Grossman , where the health stock evolves according to Ht+1=1-dHt+It, a lasting increase in health investment ΔI leads to a cumulative effect on the health stock, ΔHt=ΔI/d1-1-dt, which is small at the time of launch, increases thereafter and is asymptotically stable.
The fourth channel relates to women's decision-making power, as resources controlled by women are more often devoted to children's health and education .
These channels suggest a positive and gradual effect, more marked on health, which depends directly on households' ability to finance urgent expenditure, than on education, which depends mainly on the supply of schooling and evolves slowly. Usage costs, the digital divide and insufficient social services may nevertheless limit its scope .
2.2. Empirical Evidence
The microeconomic literature robustly establishes that mobile money improves household resilience to shocks , increases remittances received and reduces poverty . Its effects on savings , on health care use and on school enrolment are also documented, albeit less frequently. In Cameroon, mobile money increases financial resilience and household well-being . Mixed results nevertheless exist: the mere deployment of agents in remote rural areas of Uganda did not reduce poverty , and digital credit linked to mobile money exposes borrowers to high penalties . The reviews by Suri and Aron stress that almost all the causal evidence comes from a few East African countries.
Macroeconomic studies are fewer. Kpodar and Andrianaivo and Asongu associate the diffusion of mobile telephony with growth and financial development; Asongu and Odhiambo study the relationship between mobile banking, inequality and poverty; Sahay et al. show that digital finance has contributed strongly to financial inclusion. These studies rarely measure mobile money itself and do not exploit the staggered nature of its diffusion.
2.3. Positioning of the Study
This paper lies at the intersection of these two strands of literature. It retains the causal ambition of microeconomic studies by exploiting a quasi-natural experiment, the staggered launch of mobile money, and the ambition of generality of macroeconomic studies by covering the whole subcontinent. It differs from the latter through the direct measurement of mobile money and the use of recent difference-in-differences estimators, and from the former through the attention paid to the non-monetary dimensions of well-being.
3. Materials and Methods
3.1. Data and Stylized Facts
3.1.1. Sample and Measurement of Electronic Money
The sample covers the forty-nine countries of Sub-Saharan Africa from 1995 to 2022, i.e. 1,372 country-year observations. This period provides twelve years of observation before the first launch and sixteen years after it.
Electronic money is measured by mobile money, by far the dominant form in the region and the only one for which harmonized statistics are available. Two measures are used. The first is the launch date of the first service, taken from the GSMA deployment tracker and from the FAS; when the two sources diverge, the earliest date is retained. It is used to construct a treatment variable Dit, equal to one from the year of launch onwards. The second is usage intensity from the FAS, available from 2007: the number of registered accounts and of active accounts per 1,000 adults, and the value of transactions as a percentage of GDP. These indicators enter in the form ln1+x and are set to zero before launch.
3.1.2. Well-Being Measures and Control Variables
In line with the capability approach , well-being is measured by the UNDP Human Development Index and its three dimension indices: health (life expectancy normalized between 20 and 85 years), education (mean and expected years of schooling) and standard of living (logarithm of gross national income per capita at purchasing power parity). Two complementary measures are used: the inequality-adjusted HDI (IHDI), available since 2010, and the logarithm of the infant mortality rate, taken from the World Development Indicators.
The control variables influence both the diffusion of mobile money and well-being: the urbanization rate and the rate of access to electricity. For the health dimension, HIV prevalence among people aged 15-49 and antiretroviral therapy (ART) coverage are included, because the diffusion of mobile money coincided with that of HIV treatment. Income per capita is not controlled for, since it is both a component of well-being and a possible channel of the effect under study. Table 1 presents the descriptive statistics.
Table 1. Descriptive statistics.

Variable

Obs.

Mean

Std. dev.

Min.

Max.

HDI

1,256

0.488

0.111

0.235

0.808

Health index

1,372

0.576

0.110

−0.025a

0.871

Education index

1,316

0.503

0.147

0.127

0.838

Standard-of-living index

1,359

0.496

0.132

0.227

0.853

Inequality-adjusted HDI

540

0.336

0.087

0.184

0.720

Infant mortality (per 1,000)

1,372

62.94

28.38

9.90

239.90

Launch (0/1)

1,372

0.373

0.484

0

1

Registered accounts (ln), 2007-2022

632

3.318

3.154

0

8.244

Active accounts (ln), 2007-2022

569

2.545

2.769

0

7.502

Transaction value (ln), 2007-2022

576

1.006

1.509

0

5.196

Urbanization (%)

1,372

38.95

16.58

7.17

91.22

Electricity access (%)

1,255

38.32

26.16

0.80

100.00

HIV prevalence (%)

1,260

5.23

6.70

0.10

29.60

ART coverage (%)

1,035

26.82

26.43

0

93.00

aThe negative minimum of the health index corresponds to South Sudan in 1998, when life expectancy was below the 20-year lower bound used by UNDP.
Sources: UNDP, World Bank, UNAIDS, IMF (FAS), GSMA; authors' calculations.
3.1.3. Stylized Facts
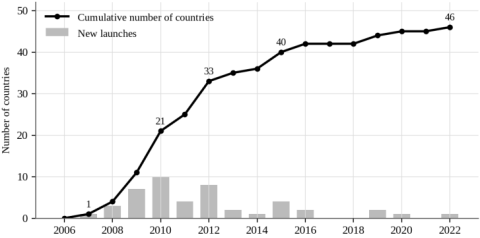
Three stylized facts emerge. The first is the rapid and staggered diffusion of mobile money (Figure 1). After the launch of M-Pesa in 2007, twenty-nine countries launched their first service between 2009 and 2012; the latest launches concern small or conflict-affected countries, such as the Comoros and South Sudan (2019), Djibouti (2020) and Cabo Verde (2022). Only Eritrea, Equatorial Guinea and São Tomé and Príncipe had not launched any service by 2022. Launches are spread over fourteen cohorts, which provides the variation exploited by the difference-in-differences design.
Sources: GSMA, IMF (FAS); authors' construction.

Download: Download full-size image

Figure 1. Diffusion of mobile money in Sub-Saharan Africa, 2006-2022.
The second stylized fact is the continuous intensification of use, which distinguishes access from effective use. In the median country, the number of registered accounts rose from about 13 per 1,000 adults in 2010 to nearly 1,500 in 2022, and the value of transactions represents about one-fifth of GDP. However, only one-third to two-fifths of accounts are active. The diffusion of the phone is not the same as that of mobile money: South Africa and Mauritius have more than 160 mobile subscriptions per 100 inhabitants but make very little use of mobile money.
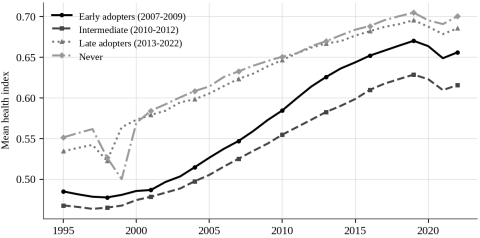
The third stylized fact is an improvement in well-being driven by health and education rather than by income: between 1995 and 2019, the health index rose by 0.17 points and the education index by 0.21 points, compared with 0.06 points for the standard-of-living index. Figure 2 shows that the countries that launched mobile money earliest started from lower health levels and experienced the fastest progress after 2007: their health index gained 0.109 points between 2007 and 2022, compared with 0.062 points for late adopters. This catching-up is consistent with an effect of mobile money, but it also coincides with the diffusion of antiretroviral therapy in the countries most affected by HIV. In the cross-section, the correlation between the number of accounts and life expectancy is in fact negative (−0.27 in 2022); it becomes positive (0.37) within countries, once country-specific and year-specific means are removed. Only a strategy that neutralizes permanent differences between countries and common trends can therefore isolate the effect of mobile money.
Figure 2. Health index by mobile money launch date, 1995-2022.
Note: early adopters (2007-2009), intermediate adopters (2010-2012), late adopters (from 2013) and countries without mobile money. Sources: UNDP, GSMA, IMF; authors' construction.
3.2. Empirical Strategy
3.2.1. Difference-in-Differences with Staggered Treatment
The baseline two-way fixed-effects (TWFE) model is written as follows:
Yit=αi+λt+δDit+Xit'γ+εit(1)
where Yit is the well-being measure of country i in year t, αi and λt are country and year fixed effects, and Xit is the vector of controls. When treatment is staggered and its effects vary with the time elapsed since launch, as predicted by the health capital model, δ is a weighted average of comparisons, some of which use already-treated countries as controls, with possibly negative weights . Two robust estimators are therefore used.
The estimator of Callaway and Sant'Anna computes an effect for each launch cohort g and each year t by comparing the change in well-being since the year preceding launch with that of not-yet-treated countries:
ATTg,t=EΔYg,t∣G=g-EΔYg,t∣Dt=0,G≠g(2)
where ΔYg,t=Yt-Yg-1 denotes the change in the outcome between year g-1 and year t. These effects are aggregated with positive weights, and inference relies on a wild bootstrap clustered by country. The two-stage estimator of Gardner , close to the imputation estimator of Borusyak et al. , first estimates the fixed effects and the coefficients of the controls on untreated observations only, then regresses the residualized outcome Ỹit=Yit-α̂i-λ̂t-Xit'γ̂ on the treatment indicators. No treated country is thus used as a control. This estimator easily accommodates time-varying controls, in particular those related to HIV.
3.2.2. Event Study and Parallel Trends
The identifying assumption is that of parallel trends: in the absence of launch, the well-being of treated countries would have evolved like that of not-yet-treated countries. It is tested through an event study:
Yit=αi+λt+∑k≠-1βkDitk+Xit'γ+εit(3)
where Ditk equals one when year t is k years after launch; the year preceding launch serves as the reference, and the extreme years are binned (six or more years before, ten or more years after). The timing of launch was largely determined by the deployment strategy of telecommunications groups and by regulatory choices, often made at the regional level, rather than by short-term changes in well-being. The main risk therefore lies less in selection on levels, which is neutralized by the fixed effects, than in catching-up trajectories and HIV dynamics. Following Roth and Rambachan and Roth , who stress the low power of pre-trend tests, the strategy does not stop at the test: it introduces country-specific linear trends and directly controls for the HIV epidemic. Neither of these approaches is a definitive test of the identifying assumption; the results that depend on it are therefore interpreted with the caveats set out in Sections 4.4 and 4.5.
3.2.3. System GMM
Since human development is highly persistent, a dynamic model is also estimated:
Yit=ρYi,t-1+βDit+Xit'γ+λt+αi+εit(4)
using two-step system GMM with the Windmeijer correction . Launch is treated as endogenous. To avoid instrument proliferation , instruments are restricted to lags 2 and 3 and collapsed, their number remaining below the number of countries. The long-run effect is β/1-ρ. The health index, whose persistence is close to unity, is not estimated with this method.
3.2.4. Usage Intensity
The third approach exploits usage intensity over 2007-2022:
Yit=βln1+MMit+Xit'γ+αi+λt+εit(5)
where MMit alternately denotes registered accounts, active accounts or the value of transactions. A doubling of intensity increases well-being by about 0.69β. To limit reverse causality, a variant uses intensity lagged by one year. In all estimations, standard errors are clustered by country .
4. Results
4.1. Effect of Launch on Health
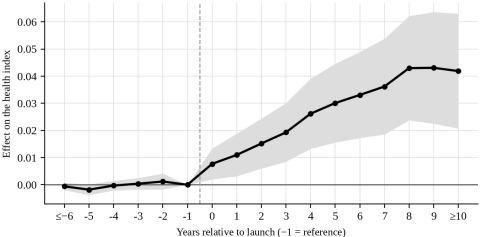
Table 2 presents the dynamics of the effect of launch on the health index estimated with the Gardner estimator, and Figure 3 provides a graphical representation.
Table 2. Effect of launch on the health index by year relative to launch (Gardner estimator).

Year relative to launch

Coefficient

Year relative to launch

Coefficient

6 or more years before

−0.0006 (0.0007)

3 years after

0.0193*** (0.0055)

5 years before

−0.0018* (0.0010)

4 years after

0.0262*** (0.0066)

4 years before

−0.0003 (0.0009)

5 years after

0.0301*** (0.0074)

3 years before

0.0004 (0.0011)

6 years after

0.0331*** (0.0081)

2 years before

0.0012 (0.0015)

7 years after

0.0362*** (0.0090)

1 year before

Reference

8 years after

0.0430*** (0.0098)

Year of launch

0.0077*** (0.0029)

9 years after

0.0431*** (0.0105)

1 year after

0.0110*** (0.0040)

10 or more years after

0.0419*** (0.0108)

2 years after

0.0152*** (0.0047)

Observations

1,127

Note: dependent variable: HDI health index (0 to 1). First stage: country and year fixed effects estimated on untreated observations. Joint test of pre-launch coefficients: p = 0.001 (the null hypothesis of zero pre-launch coefficients is rejected; see Section 4.4). Standard errors clustered by country in parentheses. *** p < 0.01; ** p < 0.05; * p < 0.10.
Note: the shaded area represents the 95% confidence interval. Source: Table 2.

Download: Download full-size image

Figure 3. Dynamics of the effect of launch on the health index.
Before launch, the coefficients are small, between −0.0018 and 0.0012, i.e. between one-fifteenth and one-twenty-fifth of the effects estimated four to ten years after launch. Their joint test is nevertheless significant (p = 0.001): the hypothesis that all pre-launch coefficients are zero is rejected, so that the parallel-trends assumption is not supported by the data in this baseline specification. This result is discussed explicitly in Section 4.4, and its implications for the causal interpretation of the estimates are drawn in Section 4.5. After launch, the effect appears in the first year (0.0077), strengthens every year until the eighth (0.0430) and then stabilizes at around 0.042. This profile is consistent with the prediction of the health capital model: the population adopts the service gradually, and the protection of health investment translates into an accumulation of the health stock.
Table 3 summarizes the average effect according to the two estimators.
Table 3. Average effect of launch on the health index.

Estimator

Average effect

Obs.

Gardner

0.0285*** (0.0070)

1,127

Callaway and Sant'Anna, aggregated effect

0.0200*** (0.0052)

1,127

Callaway and Sant'Anna, post-launch average

0.0194*** (0.0050)

1,127

Note: controls: not-yet-treated countries. Wild bootstrap clustered by country for the Callaway and Sant'Anna estimator. Standard errors in parentheses. *** p < 0.01.
The two estimators give average effects of 0.020 to 0.029 points. These averages and the dynamic coefficients of Table 2 measure different objects. The coefficients of Table 2 are horizon-specific effects: the value of 0.043 points eight years after launch is identified only from countries observed at that horizon, i.e., given the end of the sample in 2022, the thirty-six countries that launched before 2015. The averages of Table 3, by contrast, pool all treated country-years, from the year of launch to the end of the sample. With the Gardner estimator, the average effect is the mean of the effects imputed for the treated observations, that is, a weighted average of the horizon-specific coefficients whose weights are proportional to the number of treated country-years observed at each horizon. Because many countries adopted mobile money recently, 43% of the 512 treated country-years lie between the year of launch and the fourth year after it, when the effect is still building up (0.008 to 0.026 points), and only 32% lie eight or more years after launch. Weighting the coefficients of Table 2 by the distribution of treated country-years implied by the launch dates (Appendix Table A1) gives approximately 0.029, very close to the Gardner average (0.0285). The average effect is therefore an exposure-weighted summary over the observed post-launch period: it is smaller than the long-run effect and would mechanically increase if the sample were extended. The Callaway and Sant'Anna averages (0.019 to 0.020) rest on a different comparison group, made up of not-yet-treated countries only, and on different weights across cohort-year cells; the range 0.020-0.029 thus reflects the choice of estimator rather than different horizons.
Expressing these effects in years of life expectancy relies on the construction of the health index. UNDP computes it as (LE − 20)/(85 − 20), where LE is life expectancy at birth in years; the index is therefore a linear transformation of life expectancy, and a change ΔI in the index corresponds to a change of 65 × ΔI years. An increase of 0.01 points thus corresponds to 0.65 years, so that the average effects of 0.020 and 0.0285 points correspond to about 1.3 and 1.9 years, and the effect of 0.043 points eight years after launch to about 2.8 years. This conversion rests on three assumptions. First, the goalposts of 20 and 85 years are fixed over the whole period, as in the consistent UNDP time series used here. Second, the figures are averages over treated countries and post-launch years, not predictions for a given country. Third, and most importantly, the conversion inherits the identifying assumption of the estimates: the years of life expectancy can be attributed to mobile money only if the estimated changes in the index are causal, which, in view of Sections 4.4 and 4.5, is not established with certainty. These magnitudes, which represent about 19% to 27% of the average gain in life expectancy observed in the region between 2007 and 2022 (6.8 years), should therefore be read as upper bounds.
4.2. Effect on the HDI and the Standard of Living
Table 4 presents the system GMM estimates.
Table 4. Effect of launch on the HDI and the standard of living (system GMM).

HDI

Standard of living

Lagged dependent variable

0.7868*** (0.1170)

0.8480*** (0.1884)

Mobile money launch

0.0045* (0.0023)

0.0056* (0.0033)

Long-run effect

0.0211** (0.0085)

0.0371 (0.0456)

Observations / countries

1,159 / 48

1,231 / 49

Number of instruments

35

35

AR (1), p-value

0.000

0.003

AR (2), p-value

0.178

0.873

Hansen, p-value

0.634

0.433

Note: two-step system GMM with Windmeijer correction. Collapsed instruments, lags 2 and 3. Controls: urbanization, electricity, year fixed effects. Standard errors in parentheses. *** p < 0.01; ** p < 0.05; * p < 0.10.
The persistence of human development is high (0.79 for the HDI and 0.85 for the standard of living). Launch increases the HDI by 0.0045 points in the short run; owing to persistence, the effect reaches 0.021 points in the long run (p = 0.013), i.e. slightly more than one-quarter of the increase in the average HDI between 2007 and 2019 (0.072 points). The standard-of-living index increases by 0.0056 points in the short run, but its long-run effect is not precisely estimated. The specification tests are satisfied: no second-order autocorrelation, validity of the instruments according to the Hansen test, with p-values neither low nor suspiciously close to one, and an autoregressive coefficient lying between the ordinary least squares and fixed-effects bounds .
4.3. Usage Intensity
Table 5 confirms these results using another source of variation, the country-by-country evolution of service use.
Table 5. Mobile money usage intensity and well-being (fixed effects, 2007-2022).

Measure (ln)

HDI

Health

Standard of living

IHDI

Education

ln infant mortality

Registered accounts

0.0016 (0.0010)

0.0040*** (0.0013)

0.0022 (0.0014)

0.0014** (0.0007)

−0.0019 (0.0026)

0.0067 (0.0111)

Active accounts

0.0020* (0.0011)

0.0043*** (0.0015)

0.0028* (0.0017)

0.0019** (0.0008)

−0.0033 (0.0030)

0.0090 (0.0132)

Transaction value

−0.0002 (0.0018)

0.0046* (0.0025)

0.0035* (0.0019)

0.0006 (0.0016)

−0.0063 (0.0048)

0.0025 (0.0152)

Note: each cell comes from a separate regression. Country and year fixed effects; controls: urbanization and electricity. 369 to 632 observations and 40 to 49 countries depending on the variable. Standard errors clustered by country in parentheses. *** p < 0.01; ** p < 0.05; * p < 0.10.
The effect on health is significant with all three measures. A doubling of the number of accounts increases the health index by about 0.003 points, i.e. about two months of life expectancy; the nearly six-fold increase in the number of accounts in the median country between 2013 and 2022 would be associated with about five months of life expectancy. The inequality-adjusted HDI rises with registered and active accounts, which suggests that the gains are not limited to better-off groups. Active accounts have a broader effect than registered accounts, since they also improve the HDI and the standard of living: it is effective use, more than account ownership, that transmits the gains. Neither education nor infant mortality responds to any measure.
4.4. Robustness Checks
The rejection of the joint pre-trend test in Table 2 (p = 0.001) is the main threat to the causal interpretation of the baseline estimates. Taken individually, the pre-launch coefficients are small and only one is significant, at the 10% level (−0.0018, five years before launch), so that the joint rejection reflects their precision as much as their size. It cannot, however, be dismissed: with the Callaway and Sant'Anna estimator, the average of the pre-launch effects is negative and significant (−0.0055, p = 0.012), which indicates that the health index of adopting countries was already rising faster than that of not-yet-adopting countries before launch. Such pre-existing catching-up would bias the post-launch estimates upwards. The baseline estimates of Tables 2 and 3 therefore cannot be given a causal interpretation on the basis of the parallel-trends assumption alone, and the specifications of Table 6 examine how far they depend on it.
Table 6 gathers the main robustness tests.
Table 6. Robustness of the effect on health.

Specification

Coefficient

Obs.

(1) Baseline (Gardner estimator)

0.0285*** (0.0070)

1,127

(2) HIV controls: prevalence, ART coverage and their product

0.0277*** (0.0084)

1,035

(3) Excluding the twelve PEPFAR priority countries

0.0267** (0.0113)

759

(4) Country-specific linear trends, effect 9 years after launch (pre-trends: p = 0.268)

0.0290** (0.0141)

1,127

(5) Registered accounts lagged one year (fixed effects)

0.0040*** (0.0012)

594

(6) Year effects specific to the 2000 HIV prevalence level

−0.0188 (0.0141)

-

Note: specifications (1) to (3) and (6): Gardner estimator; (4): event study with country and year fixed effects and a country-specific linear trend; (5): country and year fixed effects. Countries excluded in (3): Botswana, Côte d'Ivoire, Ethiopia, Kenya, Mozambique, Namibia, Nigeria, Rwanda, South Africa, Tanzania, Uganda and Zambia. Standard errors clustered by country in parentheses. *** p < 0.01; ** p < 0.05.
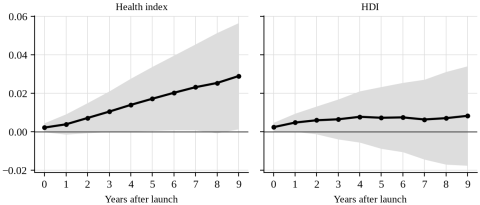
Introducing country-specific linear trends makes the pre-launch coefficients jointly insignificant (p = 0.268), while the effect remains positive and significant from the second to the ninth year, when it reaches 0.029, below the corresponding baseline coefficient (0.043) (Figure 4). This result shows that the effect is not merely the extension of a linear catching-up trajectory, but it does not resolve the identification concern. First, failing to reject parallel pre-trends is not evidence that the assumption holds, since pre-trend tests have low power . Second, linear trends extrapolate the pre-launch trajectory: they cannot capture non-linear catching-up, such as that associated with the decline of HIV examined in Section 4.5, and they may also absorb part of a gradual treatment effect. This specification is therefore treated as a check against one particular form of violation of parallel trends, not as a confirmation of the identifying assumption. It is robust to controlling for HIV prevalence and ART coverage (0.0277), and to excluding the twelve priority countries of the US PEPFAR programme (0.0267), even though the sample loses more than one-quarter of its observations and two pioneer countries, Kenya and Tanzania. Finally, the effect of intensity lagged by one year is identical to that of current intensity (0.0040), which rules out short-term reverse causality; the effect on the inequality-adjusted HDI, by contrast, does not survive this test (p ≈ 0.15).
Note: left panel: health index; right panel: HDI. The shaded area represents the 95% confidence interval.

Download: Download full-size image

Figure 4. Effect of launch with country-specific trends.
4.5. Sensitivity to HIV Dynamics and Implications for the Health Result
Linear HIV controls are not sufficient to rule out any confusion between mobile money and the dynamics of the epidemic, whose decline may have followed non-linear trajectories specific to its initial intensity. When year effects specific to the prevalence level observed in 2000 are introduced, the effect of launch becomes negative and insignificant (Table 6, row 6) and the parallel trends assumption is rejected (p = 0.003). Other evidence points in the same direction: with the Callaway and Sant'Anna estimator, the average of pre-launch effects is negative and significant (−0.0055, p = 0.012); conditional on 2000 prevalence, the average effect falls to 0.0080 and is no longer significant; and the effect is concentrated in high-prevalence countries (0.0323), where the prior trend is also the steepest, while it disappears in low-prevalence countries (0.0056, not significant).
Part of the effect on health may therefore reflect the catching-up associated with the decline of HIV. Two interpretations remain possible: either the estimated effect is partly an artefact due to the coincidence of two independent phenomena, or mobile money contributed to the effectiveness of the response to the epidemic by facilitating the financing of trips to treatment centres and the continuity of care. Aggregate data do not allow us to decide between them. This sensitivity result changes the interpretation of the main finding. Combined with the rejection of the baseline pre-trend test, it implies that the positive health effect is robust to linear forms of confounding (country-specific trends, linear HIV controls, exclusion of the PEPFAR priority countries) but not to a flexible control for HIV-related dynamics. The estimates of Tables 2 and 3, and their translation into years of life expectancy, should therefore be read as an upper bound on the effect of mobile money, and an effect close to zero cannot be excluded. Accordingly, the conclusion that mobile money improves population health is stated in this paper as consistent with the evidence rather than as established by it.
4.6. Dimensions Without an Effect
The education index shows no effect, whether with the Gardner estimator (−0.0032, standard error 0.0281), with the Callaway and Sant'Anna estimator (−0.0168, not significant) or with the intensity measures; in system GMM, the Hansen test rejects the validity of the instruments (p = 0.040). Infant mortality does not respond either (0.0716, standard error 0.0850). The effect on the overall HDI is positive but insignificant in difference-in-differences (0.0066 and 0.0043), which is explained by its aggregate nature, combining a dimension on which the effect is clear and a dimension on which it is nil. Finally, mobile phone penetration, often used as a proxy for mobile money, has no significant effect on any dimension of the HDI in system GMM.
5. Discussion
5.1. Interpretation of the Findings
Subject to the caveats of Sections 4.4 and 4.5, the primacy of the health dimension is consistent with the insurance mechanisms identified at the household level. Health shocks are among the most frequent shocks to which African households are exposed, and the ability to rapidly mobilize network resources, to use secure savings or to pay remotely for a consultation and transport reduces the risk that care is delayed . The gradual nature of the effect echoes the long-run effects established by Suri and Jack in Kenya.
The absence of an effect on education is most likely due to the nature of the indicator. Years of schooling evolve slowly and depend above all on the supply of schooling; the mean years of schooling of adults reflect decisions taken several decades earlier. This result does not rule out effects on attendance or quality, which aggregate indicators do not measure, nor household-level effects such as those found in Tanzania . The absence of an effect on infant mortality suggests that the effect on health operates through adult mortality, which is more sensitive to health shocks and to the continuity of treatment of chronic diseases, rather than through child mortality, which depends largely on vaccination, maternal health and access to safe water.
From a methodological standpoint, the results show the importance of measuring mobile money directly: phone ownership has no effect on any dimension, whereas the effective use of accounts improves health, the HDI and the standard of living. They call for caution in reading studies that equate the diffusion of the phone with that of financial services. They also illustrate the value of estimators that are robust to staggered adoption: since the effect is gradual, the two-way fixed-effects estimator would have used as controls countries whose well-being was already improving under the effect of mobile money.
5.2. Policy Implications
These results have three policy implications, notably for the monetary authorities of Central Africa, where the value of mobile money transactions approached 35,000 billion CFA francs in 2024. First, although the health effect should be read as an upper bound, electronic money can be considered a potential instrument of health policy and not only of financial policy: the payment of contributions to mutual health insurance schemes, the disbursement of assistance to patients or the financing of medical evacuations would benefit from relying on it. Second, since it is active accounts that transmit the gains, public policies should target use rather than mere account opening: lower withdrawal fees, effective interoperability between issuers and the extension of agent networks in rural areas. In this respect, the taxation of electronic transfers, introduced by several countries in the region, including Cameroon in 2022, deserves to be evaluated in light of its effects on the use of the service by low-income households. Third, electronic money cannot replace public investment in the supply of social services: the absence of an effect on education is a reminder that a better financing capacity of households only produces results if quality services are available.
6. Conclusions
This paper has assessed the effect of electronic money on population well-being in forty-nine Sub-Saharan African countries from 1995 to 2022, by measuring mobile money directly and by relying on difference-in-differences estimators that are robust to the staggered timing of launches, on system GMM and on regressions on usage intensity. Its results are consistent with electronic money improving mainly the health dimension of well-being, by up to 1.3 to 1.9 years of life expectancy on average over the post-launch years and about 2.8 years eight years after launch, with a long-run effect on the HDI and gains that operate through the effective use of accounts rather than through phone ownership. Education and infant mortality do not respond. The health result must nevertheless be stated cautiously: the pre-launch coefficients are jointly significant in the baseline event study, and the effect disappears when year effects are allowed to vary with initial HIV prevalence. These magnitudes are therefore upper bounds, and a causal effect of mobile money on health is not definitively established.
These results have limitations. Aggregate data provide information on the average well-being of populations and not on the mechanisms at work within households; the coincidence between the diffusion of mobile money and the decline of HIV cannot be fully resolved, which leads us to read the magnitude of the effect on health as an upper bound; and intensity data only cover countries that have reported their statistics to the IMF since 2007. Three extensions appear promising: the use of household surveys, such as the Demographic and Health Surveys, to identify the mechanisms, in particular the continuity of treatment; a formal analysis of sensitivity to violations of the parallel trends assumption ; and an examination of the heterogeneity of the effects according to the institutional environment in which electronic money spreads.
Abbreviations

ART

Antiretroviral Therapy

ATT

Average Treatment Effect on the Treated

FAS

Financial Access Survey

GDP

Gross Domestic Product

GMM

Generalized Method of Moments

GSMA

GSM Association

HDI

Human Development Index

HIV

Human Immunodeficiency Virus

IHDI

Inequality-adjusted Human Development Index

IMF

International Monetary Fund

PEPFAR

United States President's Emergency Plan for AIDS Relief

TWFE

Two-Way Fixed Effects

UNAIDS

Joint United Nations Programme on HIV/AIDS

UNDP

United Nations Development Programme

Acknowledgments
The authors wish to thank the anonymous reviewers for their constructive comments, which helped improve this manuscript. The authors also thank the teams maintaining the UNDP Human Development Reports, the World Bank World Development Indicators, the UNAIDS database, the IMF Financial Access Survey and the GSMA Mobile Money Deployment Tracker for making their data available.
Author Contributions
Appolinaire Kemer: Conceptualization, Data curation, Investigation, Writing – original draft
Tchakounte Njoda Mathurin: Methodology, Supervision, Validation
Hamidou Cephas Atirbi: Formal Analysis, Methodology, Project administration, Software, Supervision, Writing – review & editing
Data Availability Statement
The panel dataset was compiled from the UNDP Human Development Reports (https://hdr.undp.org/data-center), the World Bank World Development Indicators (https://databank.worldbank.org/source/world-development-indicators), UNAIDS (https://aidsinfo.unaids.org), the IMF Financial Access Survey (https://data.imf.org/fas) and the GSMA Mobile Money Deployment Tracker. All source databases are publicly available. The compiled dataset is available from the corresponding author upon reasonable request.
Conflicts of Interest
The authors declare no conflicts of interest.
Appendix
Table A1. Mobile money launch cohorts (year of launch of the first service, by country).

Year

Number

Countries

2007

1

Kenya

2008

3

Côte d'Ivoire, Senegal, Tanzania

2009

7

Ghana, Rwanda, Somalia, South Africa, Uganda, Zambia, Zimbabwe

2010

10

Benin, Botswana, Burundi, Cameroon, Guinea-Bissau, Madagascar, Mali, Namibia, Niger, Nigeria

2011

4

Congo, Eswatini, Liberia, Mozambique

2012

8

Burkina Faso, Chad, Democratic Republic of the Congo, Gabon, Guinea, Lesotho, Malawi, Sierra Leone

2013

2

Mauritania, Togo

2014

1

Angola

2015

4

Ethiopia, Mauritius, Seychelles, Sudan

2016

2

Central African Republic, The Gambia

2019

2

Comoros, South Sudan

2020

1

Djibouti

2022

1

Cabo Verde

Never

3

Equatorial Guinea, Eritrea, São Tomé and Príncipe

Sources: GSMA, IMF (Financial Access Survey); authors' construction.
References
[1] GSMA. State of the Industry Report on Mobile Money 2024. London: GSMA; 2024.
[2] Klapper, L., Singer, D., Starita, L., Norris, A. The Global Findex Database 2025: Connectivity and Financial Inclusion in the Digital Economy. Washington, DC: World Bank; 2025.
[3] Demirgüç-Kunt, A., Klapper, L., Singer, D., Ansar, S. The Global Findex Database 2021: Financial Inclusion, Digital Payments, and Resilience in the Age of COVID-19. Washington, DC: World Bank; 2022.
[4] World Bank. Poverty, Prosperity, and Planet Report 2024: Pathways Out of the Polycrisis. Washington, DC: World Bank; 2024.
[5] Jack, W., Suri, T. Risk Sharing and Transactions Costs: Evidence from Kenya's Mobile Money Revolution. American Economic Review. 2014, 104(1), 183-223.
[6] Suri, T., Jack, W. The Long-Run Poverty and Gender Impacts of Mobile Money. Science. 2016, 354(6317), 1288-1292.
[7] Munyegera, G. K., Matsumoto, T. Mobile Money, Remittances, and Household Welfare: Panel Evidence from Rural Uganda. World Development. 2016, 79, 127-137.
[8] Riley, E. Mobile Money and Risk Sharing Against Village Shocks. Journal of Development Economics. 2018, 135, 43-58.
[9] Abiona, O., Koppensteiner, M. F. Financial Inclusion, Shocks, and Poverty: Evidence from the Expansion of Mobile Money in Tanzania. Journal of Human Resources. 2022, 57(2), 435-464.
[10] Batista, C., Vicente, P. C. Adopting Mobile Money: Evidence from an Experiment in Rural Africa. AEA Papers and Proceedings. 2020, 110, 594-598.
[11] Atangana Ondoa, H., Ambombo Bella, G. L., Mbenga Bindop, K. M. Mobile Money, Family Assistance and Welfare in Cameroon. Telecommunications Policy. 2023, 47(1), 102457.
[12] Wieser, C., Kinzinger, J., Ruckteschler, C., Heitmann, S., Bruhn, M. The Impact of Mobile Money on Poor Rural Households: Experimental Evidence from Uganda. Policy Research Working Paper No. 8913. Washington, DC: World Bank; 2019.
[13] Kpodar, K., Andrianaivo, M. ICT, Financial Inclusion, and Growth: Evidence from African Countries. IMF Working Paper No. 11/73. Washington, DC: International Monetary Fund; 2011.
[14] Asongu, S. A. How has Mobile Phone Penetration Stimulated Financial Development in Africa? Journal of African Business. 2013, 14(1), 7-18.
[15] Goodman-Bacon, A. Difference-in-Differences with Variation in Treatment Timing. Journal of Econometrics. 2021, 225(2), 254-277.
[16] de Chaisemartin, C., D'Haultfœuille, X. Two-Way Fixed Effects Estimators with Heterogeneous Treatment Effects. American Economic Review. 2020, 110(9), 2964-2996.
[17] Sun, L., Abraham, S. Estimating Dynamic Treatment Effects in Event Studies with Heterogeneous Treatment Effects. Journal of Econometrics. 2021, 225(2), 175-199.
[18] Callaway, B., Sant'Anna, P. H. C. Difference-in-Differences with Multiple Time Periods. Journal of Econometrics. 2021, 225(2), 200-230.
[19] Gardner, J. Two-Stage Differences in Differences. Working Paper, arXiv: 2207.05943; 2022.
[20] Bank for International Settlements. Implications for Central Banks of the Development of Electronic Money. Basel: BIS; 1996.
[21] Aker, J. C., Mbiti, I. M. Mobile Phones and Economic Development in Africa. Journal of Economic Perspectives. 2010, 24(3), 207-232.
[22] World Bank. Remittance Prices Worldwide Quarterly, Issue for the Fourth Quarter of 2023. Washington, DC: World Bank; 2024.
[23] Townsend, R. M. Risk and Insurance in Village India. Econometrica. 1994, 62(3), 539-591.
[24] Fafchamps, M., Lund, S. Risk-Sharing Networks in Rural Philippines. Journal of Development Economics. 2003, 71(2), 261-287.
[25] Blumenstock, J. E., Eagle, N., Fafchamps, M. Airtime Transfers and Mobile Communications: Evidence in the Aftermath of Natural Disasters. Journal of Development Economics. 2016, 120, 157-181.
[26] Gertler, P., Gruber, J. Insuring Consumption Against Illness. American Economic Review. 2002, 92(1), 51-70.
[27] Collins, D., Morduch, J., Rutherford, S., Ruthven, O. Portfolios of the Poor: How the World's Poor Live on $2 a Day. Princeton, NJ: Princeton University Press; 2009.
[28] Dupas, P., Robinson, J. Why Don't the Poor Save More? Evidence from Health Savings Experiments. American Economic Review. 2013, 103(4), 1138-1171.
[29] Grossman, M. On the Concept of Health Capital and the Demand for Health. Journal of Political Economy. 1972, 80(2), 223-255.
[30] Duflo, E. Women Empowerment and Economic Development. Journal of Economic Literature. 2012, 50(4), 1051-1079.
[31] Aker, J. C., Boumnijel, R., McClelland, A., Tierney, N. Payment Mechanisms and Antipoverty Programs: Evidence from a Mobile Money Cash Transfer Experiment in Niger. Economic Development and Cultural Change. 2016, 65(1), 1-37.
[32] Mothobi, O., Grzybowski, L. Infrastructure Deficiencies and Adoption of Mobile Money in Sub-Saharan Africa. Information Economics and Policy. 2017, 40, 71-79.
[33] Lee, J. N., Morduch, J., Ravindran, S., Shonchoy, A., Zaman, H. Poverty and Migration in the Digital Age: Experimental Evidence on Mobile Banking in Bangladesh. American Economic Journal: Applied Economics. 2021, 13(1), 38-71.
[34] Ky, S., Rugemintwari, C., Sauviat, A. Does Mobile Money Affect Saving Behaviour? Evidence from a Developing Country. Journal of African Economies. 2018, 27(3), 285-320.
[35] Ahmed, H., Cowan, B. Mobile Money and Healthcare Use: Evidence from East Africa. World Development. 2021, 141, 105392.
[36] Ajefu, J. B., Massacky, F. How Does Adoption of Mobile Money Technology Affect Child Labour and School Enrolment? Evidence from Tanzania. AERC Research Paper No. 517. Nairobi: African Economic Research Consortium; 2022.
[37] Mbouombouo Mfossa, P. Mobile Money-Driven Financial Inclusion and Financial Resilience in Sub-Saharan Africa: Insights from Cameroon. Working Paper, HAL, hal-03622403; 2022.
[38] Brailovskaya, V., Dupas, P., Robinson, J. Is Digital Credit Filling a Hole or Digging a Hole? Evidence from Malawi. NBER Working Paper No. 29573. Cambridge, MA: National Bureau of Economic Research; 2021.
[39] Suri, T. Mobile Money. Annual Review of Economics. 2017, 9, 497-520.
[40] Aron, J. Mobile Money and the Economy: A Review of the Evidence. World Bank Research Observer. 2018, 33(2), 135-188.
[41] Asongu, S. A., Odhiambo, N. M. Mobile Banking Usage, Quality of Growth, Inequality and Poverty in Developing Countries. Information Development. 2019, 35(2), 303-318.
[42] Sahay, R., von Allmen, U. E., Lahreche, A., Khera, P., Ogawa, S., Bazarbash, M., Beaton, K. The Promise of Fintech: Financial Inclusion in the Post COVID-19 Era. IMF Departmental Paper No. 20/09. Washington, DC: International Monetary Fund; 2020.
[43] Sen, A. Development as Freedom. Oxford: Oxford University Press; 1999.
[44] Borusyak, K., Jaravel, X., Spiess, J. Revisiting Event-Study Designs: Robust and Efficient Estimation. Review of Economic Studies. 2024, 91(6), 3253-3285.
[45] Roth, J. Pretest with Caution: Event-Study Estimates after Testing for Parallel Trends. American Economic Review: Insights. 2022, 4(3), 305-322.
[46] Rambachan, A., Roth, J. A More Credible Approach to Parallel Trends. Review of Economic Studies. 2023, 90(5), 2555-2591.
[47] Arellano, M., Bover, O. Another Look at the Instrumental Variable Estimation of Error-Components Models. Journal of Econometrics. 1995, 68(1), 29-51.
[48] Blundell, R., Bond, S. Initial Conditions and Moment Restrictions in Dynamic Panel Data Models. Journal of Econometrics. 1998, 87(1), 115-143.
[49] Windmeijer, F. A Finite Sample Correction for the Variance of Linear Efficient Two-Step GMM Estimators. Journal of Econometrics. 2005, 126(1), 25-51.
[50] Roodman, D. How to Do xtabond2: An Introduction to Difference and System GMM in Stata. Stata Journal. 2009, 9(1), 86-136.
[51] Bertrand, M., Duflo, E., Mullainathan, S. How Much Should We Trust Differences-in-Differences Estimates? Quarterly Journal of Economics. 2004, 119(1), 249-275.
[52] Bond, S. R. Dynamic Panel Data Models: A Guide to Micro Data Methods and Practice. Portuguese Economic Journal. 2002, 1(2), 141-162.
Cite This Article
  • APA Style

    Kemer, A., Mathurin, T. N., Atirbi, H. C. (2026). Mobile Money and Population Well-Being in Sub-Saharan Africa: Evidence from Staggered Difference-in-Differences. International Journal of Economics, Finance and Management Sciences, 14(6), 464-478. https://doi.org/10.11648/j.ijefm.20261406.12

    Copy | Download

    ACS Style

    Kemer, A.; Mathurin, T. N.; Atirbi, H. C. Mobile Money and Population Well-Being in Sub-Saharan Africa: Evidence from Staggered Difference-in-Differences. Int. J. Econ. Finance Manag. Sci. 2026, 14(6), 464-478. doi: 10.11648/j.ijefm.20261406.12

    Copy | Download

    AMA Style

    Kemer A, Mathurin TN, Atirbi HC. Mobile Money and Population Well-Being in Sub-Saharan Africa: Evidence from Staggered Difference-in-Differences. Int J Econ Finance Manag Sci. 2026;14(6):464-478. doi: 10.11648/j.ijefm.20261406.12

    Copy | Download

  • @article{10.11648/j.ijefm.20261406.12,
      author = {Appolinaire Kemer and Tchakounte Njoda Mathurin and Hamidou Cephas Atirbi},
      title = {Mobile Money and Population Well-Being in Sub-Saharan Africa: Evidence from Staggered Difference-in-Differences},
      journal = {International Journal of Economics, Finance and Management Sciences},
      volume = {14},
      number = {6},
      pages = {464-478},
      doi = {10.11648/j.ijefm.20261406.12},
      url = {https://doi.org/10.11648/j.ijefm.20261406.12},
      eprint = {https://article.sciencepublishinggroup.com/pdf/10.11648.j.ijefm.20261406.12},
      abstract = {Mobile money has spread faster in Sub-Saharan Africa than in any other region, yet its contribution to the non-monetary dimensions of well-being remains poorly documented at the regional scale. This paper assesses the effect of electronic money on population well-being in the forty-nine countries of Sub-Saharan Africa over 1995-2022. Following the capability approach, well-being is measured by the Human Development Index (HDI) and its health, education and standard-of-living components, complemented by the inequality-adjusted HDI and infant mortality. Electronic money is measured directly, by the launch date of the first mobile money service and by usage intensity from the IMF Financial Access Survey, rather than by mobile phone penetration. Identification relies on difference-in-differences estimators robust to staggered adoption and heterogeneous effects, complemented by system GMM and fixed-effects regressions on usage intensity. Averaged over the post-launch years, launch is associated with an increase in the health index of 0.020 to 0.029 points, i.e. 1.3 to 1.9 years of life expectancy at birth; the dynamic effect builds up gradually and reaches about 0.043 points after eight years. System GMM points to a long-run effect of about 0.021 points on the HDI. Active accounts transmit broader gains than registered accounts, whereas mobile phone penetration has no effect. No effect is found on education or infant mortality. Two results qualify the causal interpretation of the health effect: the pre-launch event-study coefficients, although small, are jointly significant, and the effect disappears when year effects are allowed to vary with initial HIV prevalence. The health estimates should therefore be read as an upper bound. Overall, the evidence is consistent with mobile money improving mainly the health dimension of well-being, and public policies should target the effective use of accounts rather than mere account ownership.},
     year = {2026}
    }
    

    Copy | Download

  • TY  - JOUR
    T1  - Mobile Money and Population Well-Being in Sub-Saharan Africa: Evidence from Staggered Difference-in-Differences
    AU  - Appolinaire Kemer
    AU  - Tchakounte Njoda Mathurin
    AU  - Hamidou Cephas Atirbi
    Y1  - 2026/11/11
    PY  - 2026
    N1  - https://doi.org/10.11648/j.ijefm.20261406.12
    DO  - 10.11648/j.ijefm.20261406.12
    T2  - International Journal of Economics, Finance and Management Sciences
    JF  - International Journal of Economics, Finance and Management Sciences
    JO  - International Journal of Economics, Finance and Management Sciences
    SP  - 464
    EP  - 478
    PB  - Science Publishing Group
    SN  - 2326-9561
    UR  - https://doi.org/10.11648/j.ijefm.20261406.12
    AB  - Mobile money has spread faster in Sub-Saharan Africa than in any other region, yet its contribution to the non-monetary dimensions of well-being remains poorly documented at the regional scale. This paper assesses the effect of electronic money on population well-being in the forty-nine countries of Sub-Saharan Africa over 1995-2022. Following the capability approach, well-being is measured by the Human Development Index (HDI) and its health, education and standard-of-living components, complemented by the inequality-adjusted HDI and infant mortality. Electronic money is measured directly, by the launch date of the first mobile money service and by usage intensity from the IMF Financial Access Survey, rather than by mobile phone penetration. Identification relies on difference-in-differences estimators robust to staggered adoption and heterogeneous effects, complemented by system GMM and fixed-effects regressions on usage intensity. Averaged over the post-launch years, launch is associated with an increase in the health index of 0.020 to 0.029 points, i.e. 1.3 to 1.9 years of life expectancy at birth; the dynamic effect builds up gradually and reaches about 0.043 points after eight years. System GMM points to a long-run effect of about 0.021 points on the HDI. Active accounts transmit broader gains than registered accounts, whereas mobile phone penetration has no effect. No effect is found on education or infant mortality. Two results qualify the causal interpretation of the health effect: the pre-launch event-study coefficients, although small, are jointly significant, and the effect disappears when year effects are allowed to vary with initial HIV prevalence. The health estimates should therefore be read as an upper bound. Overall, the evidence is consistent with mobile money improving mainly the health dimension of well-being, and public policies should target the effective use of accounts rather than mere account ownership.
    VL  - 14
    IS  - 6
    ER  - 

    Copy | Download

Author Information
  • Faculty of Economic and Management Sciences, University of Ngaoundere, Ngaoundere, Cameroon

    Biography: Appolinaire Kemer is a PhD candidate in Economics at the Faculty of Economic and Management Sciences, University of Ngaoundere, Cameroon, in the Department of Monetary and Banking Economics. He holds a Master's degree in International Economics and Finance from the same university. His doctoral research examines the effects of electronic money on population well-being in Sub-Saharan Africa and the role of institutional quality in conditioning these effects. His research interests include monetary economics, financial inclusion, mobile money, human development and applied panel econometrics, with a focus on the economies of the Central African Economic and Monetary Community (CEMAC).

    Research Fields: Monetary economics, Financial inclusion, Mobile money, Human development, Sub-Saharan African economies

  • Faculty of Economic and Management Sciences, University of Maroua, Maroua, Cameroon

    Biography: Tchakounte Njoda Mathurin is an Associate Professor of Economics at the Faculty of Economic and Management Sciences, University of Maroua, Cameroon. He supervises Master's and doctoral research in monetary and banking economics, including work on electronic money and household well-being in the CEMAC zone. His research interests include monetary economics, banking economics, panel econometrics and economic development in Africa, with particular attention to the functioning of financial systems and to the transmission of financial innovations to the real economy in Central Africa.

    Research Fields: Monetary economics, Panel econometrics, Economic development, Banking economics, African economies

  • Faculty of Economic and Management Sciences, University of Ngaoundere, Ngaoundere, Cameroon

    Biography: Hamidou Cephas Atirbi holds a PhD in Economics from the University of Ngaoundere, Cameroon (2026), awarded with the highest distinction, for a thesis on the effects of mayors' human capital on the budgetary performance of Cameroonian municipalities. He is the founder and Chief Executive Officer of AtiRbi, a data analytics and digital services company based in Ngaoundere that works with universities, non-governmental organisations, municipalities and researchers. His research interests include public economics, local public finance, human capital, credit scoring and applied econometrics, in particular panel data methods and impact evaluation. He has published on the human capital of local elected officials and municipal investment in Cameroon, and he provides methodological support to doctoral and Master's research in economics.

    Research Fields: Public economics, Municipal finance, Human capital theory, Credit scoring, Empirical banking


  • Abstract
  • Keywords
  • Document Sections

    1. 1. Introduction
    2. 2. Transmission Channels and Literature Review
    3. 3. Materials and Methods
    4. 4. Results
    5. 5. Discussion
    6. 6. Conclusions
    Show Full Outline
  • Abbreviations
  • Acknowledgments
  • Author Contributions
  • Data Availability Statement
  • Conflicts of Interest
  • Appendix
  • References
  • Cite This Article
  • Author Information