Research Article | | Peer-Reviewed

Spatial Variation of PM1, PM2.5, and PM10 Linked to Urban Land Use in Lalmonirhat, Bangladesh

Received: 4 July 2025     Accepted: 25 July 2025     Published: 21 August 2025
Views:       Downloads:
Abstract

This study aims to assess the concentration of Particulate Matter (PM1, PM2.5, and PM10) in relation to various land uses in Lalmonirhat district town. Study conducted this investigation in 32 sites within Lalmonirhat district town, using a portable Air Quality Monitor and an Indoor Outdoor Formaldehyde (HCHO) Detector (Model: DM106). The average concentrations of PM1, PM2.5 and PM10 are 51.92, 85.93, and 109.52 µg/m3, respectively. The average concentration of PM2.5 (109.65 µg/m3) in various land uses was observed to be elevated in industrial areas, exceeding the acceptable level by a factor of 2.19. The average PM2.5 / PM10 ratio is assessed at 78.38%, whereas the PM1/PM2.5 ratio is 60.3%. The alterations in the concentration of all investigated factors between land uses were negligible. The results of this research indicate that the examined land uses are ranked in descending order of average PM2.5 concentration as follows: industrial area, village area, road intersection area, sensitive region, residential area, mixed area, and commercial area.

Published in International Journal of Environmental Monitoring and Analysis (Volume 13, Issue 4)
DOI 10.11648/j.ijema.20251304.18
Page(s) 217-235
Creative Commons

This is an Open Access article, distributed under the terms of the Creative Commons Attribution 4.0 International License (http://creativecommons.org/licenses/by/4.0/), which permits unrestricted use, distribution and reproduction in any medium or format, provided the original work is properly cited.

Copyright

Copyright © The Author(s), 2025. Published by Science Publishing Group

Keywords

Particulate Matter, Land Use, Descriptive Statistics, Cluster, Lalmonirhat District Town

1. Introduction
Air pollution is one of the varieties of manmade environmental disasters currently taking place worldwide . Air pollution may be an atmospheric condition in which various substances are present at concentrations high enough above their normal ambient levels to produce a measurable effect on people, animals, vegetation, or materials. ‘Substances’ refers to any natural or manmade chemical elements or compounds capable of being airborne . These may exist in the atmosphere as gases, liquid drops, or solid particles. It includes any substance whether noxious or benign; however, the term ‘measurable effect’ generally restricts attention to those substances that cause undesirable effects. Air Quality has deteriorated both due to human activities and natural phenomena such as windblown dust particles etc . Growing cities , increasing traffic , rapid economic development , and higher levels of energy consumption lead to air pollution very seriously. However, these are mainly concentrated in the cities. Recently, air pollution has received priority among environmental issues in Asia as well as in other parts of the world. Exposure to air pollution is the main environmental threat to human health in many towns and cities. Bangladesh is in the top position in the Air Quality Report of 2019 and 2020 in terms of air pollution, where Dhaka city is in the second position among the capital cities of the world . Apart from this, the latest report released by IQAir states that in 2020 the average of PM2.5 in the air of Bangladesh was found 77.1 µg/m3. It is 5.5 times higher than the standard level which is 15 micrograms per cubic meter set by the Department of Environment (DoE). According to the Report, about 7 million people die every year in the world due to air pollution. In 2018, about 1 lakh 58 thousand people died of air pollution in Bangladesh . For many decades, like Dhaka air pollutants have increased continuously in the different cities in Bangladesh. Cities surrounding Dhaka are also polluting day by day. Cities like Tangail, Narsingdi, Barisal, Chattogram, Gazipur; Narayanganj and Sylhet any other division are being polluted because of developing work . Air pollution seriously affects the respiratory tract and can causes’ high respiratory disease, headache, asthma, high blood pressure, and even cancer . One of the most difficult problems is irritation of the eyes or throat, coughing, sneezing; high fever . The mental faculty of children will be adversely affected by PM pollution, which can also affect the central nervous system and cause renal damage and hypertension .
Air pollution is one of the major problems in the Lalmonirhat District town area in the last few years due to a lot of ongoing development work. There are various sources of air pollution in Lalmonirhat city, among them, unfit vehicles and industries are notable, with the under-construction work done by the Lalmonirhat city Corporation. The number of mostly reconditioned vehicles is increasing every year. One-third of these vehicles do not have a fitness certificate. Due to the port facility, this city is attractive for investors to build an industry. Most industries do not follow environmental rules and regulations. Along with the air pollution, it is increasing in Lalmonirhat city due to the construction of various road repairs. Nowadays, the whole of Lalmonirhat has become a city of dust. For local transportation, rickshaws and autos (battery-operated) are the most commonly used vehicles. Since the area of the main city is not very large, buses are not required for public transportation. However, private cars are increasing significantly nowadays within the city area, which is contributing to air pollution. For connecting with other districts, the City has a Railway station (Junction) and several bus stops. To meet the rising population of the city, local people are building high-rise residential and commercial projects. In contrast, the city infrastructure, i., roads, parks, and open spaces, is the same as before. These development activities are directly or indirectly contributing to the air pollution of Lalmonirhat District town. For development work, construction masteries were carried out without any cover at that time; the air became polluted. Thus, over the past decade, the city has become a crowded place. Moreover, construction without following proper guidelines (for example, not covering the project site to prevent dust pollution) leads to harm to the environment, particularly the Air. These five pollutants have primary sources such as brickfields, cement industry, rock crusher, motor vehicles, and open burning and secondary sources such as road dust, airborne soil from agricultural fields, transboundary, etc. . Emissions from the brick kiln are the major contributors to air pollution in different cities; Dhaka especially in the dry seasons and PM2.5 concentrations in mixed and motorized areas were on average higher than the non-motorized and vehicle-free areas . Particulate Matters originate from a variety of sources, such as power plants, industrial processes, transports, brick kilns, biomass burning, wind-blown dust, sea spray, and also, they are formed in the atmosphere by the transformation of gaseous emissions. Their chemical and physical compositions depend on the characteristics of the emission sources, location area, time of year, and prevailing weather conditions . Particle conversions through chemical processes in the atmosphere by burning of biomass, gas, and fossil fuel is the main sources of the PM2.5 and while coarse particles (PM2.5 -10) are the result of mechanical activities such as wind-blown dust, grindings, re-suspended road dust, etc . In the urban area, CO is mostly emitted from anthropogenic emissions such as the incomplete combustion of hydrocarbon fuels and biomass burning .
Air Pollution has tremendous and various effects on the human body . Air pollution alone is responsible for one-third of the deaths from stroke, heart disease, and lung cancer . Pollutants, especially PM2.5, are considered more harmful due to their characteristics and it is capable of traveling deeper into the respiratory system and also passing through the alveoli into the bloodstream, which causes premature mortality, lung cancer, and increases the risk of respiratory and heart disease. Developing countries like Bangladesh suffer PM2.5 exposures that are four to five times more than developed countries, and worldwide, air pollution is the fifth risk factor for mortality . Exposure to CO can be detrimental to human health in that it binds to hemoglobin to form carboxy-hemoglobin, thus reducing the oxygen-carrying capacity of the blood, it reduces the ability of organ tissues to extract oxygen from the hemoglobin, negatively affecting organs such as the brain, heart, and lungs . Acute exposure to high concentrations of CO may result in CO poisoning with an onset of symptoms including nausea, vomiting, headaches, shortness of breath, confusion, and can quickly lead to death . The effects of long-term exposure to elevated ambient concentrations of CO are often associated with cardiovascular problems amongst exposed individuals. PM2.5 affect the respiratory, cardiovascular, nervous and renal system that cause persistent cough, asthma, nasal blockage, respiratory infections, hypertension, eye irritation, drowsiness, headaches and renal damage and eventually in increasing number of premature deaths . Apart from this, air pollution is also responsible for some fatal diseases such as cancer and heart attack .
2. Objectives of the Study
1) To identify the status of air pollution in Lalmonirhat District Town.
2) To assess the relationship between land use and all parameters (PM1, PM2.5, and PM10).
3) To identify AQI of Lalmonirhat based on PM2.5 and do the spatial map.
4) Geospatial mapping on the concentration of PM1, PM2.5, and PM10.
3. Study Area and Methodology
3.1. Study Area
Lalmonirhat District town is an upazila of Lalmonirhat District in the Division of Rangpur, Bangladesh. Lalmonirhat District town is located at 25.9153°N 89.4500°E. It has 79,147 units of household and its total area is 259.54 km2. The River Dharla, Tista, Swarnamati crosses the section of Lalmonirhat. According to the 2011 Bangladesh census, Lalmonirhat District town had a population of 333,166. Males constituted 51.4% of the population. Lalmonirhat Municipality is subdivided into nine wards and 64 mahallas. Lalmonirhat District town Upazila is divided into nine union parishads: Barobari, Gokunda, Harati, Khuniagachh, Kulaghat, Mogolhat, Mohendranagar, Panchagram, and Rajpur. The union parishads are subdivided into 117 mauzas and 173 villages .
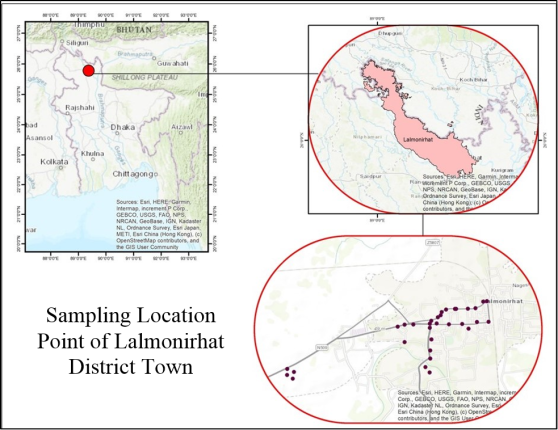
Figure 1. Study Area (Lalmonirhat District Town and Data Collection Locations Point).
3.2. Area Selection
32 locations were selected on the basis of the use of land. After that, all locations were divided according to the use of land into seven types, which are sensitive, residential, mixed, commercial, road intersection, industrial, and village Area . There are a total of 5 sensitive areas that were selected, including hospitals and clinics, schools, colleges, mosques, madrasas, temples, churches, and administrative dhaban. On the other side, mixed areas contain bazars, buildings, main roads, etc. The remaining 27 locations were categorized as residential areas; 3 locations, mixed areas; 3 locations, commercial areas; 9 locations, road intersection or busiest road junctions and bends; 5 locations, industrial area; 4 locations, village area; 3 locations. The list of these 38 locations is shown in Table 1.
Table 1. List of 32 Selected Areas of Lalmonirhat District Town Area.

S.N.

Location Type

Location Name

Latitude

Longitude

1.

Sensitive Area

Felloship Church

25.9112016

89.4338037

2.

BGB Lalmonirhat

25.9114173

89.4280183

3.

Church of God Convention Center

25.9119982

89.4350751

4.

Govt. Library

25.9118463

89.4373011

5.

Land Office

25.9134736

89.4357898

S.N.

Location Type

Location Name

Latitude

Longitude

1.

Residential Area

Staf Quarter

25.9122735

89.4423694

2.

Rahaman Monjil Complex

25.9146541

89.438591

3.

East Harivanga

25.9030958

89.4337804

S.N.

Location Type

Location Name

Latitude

Longitude

1.

Mixed Area

Bashundhara Dhara Mosque

25.9146826

89.4407373

2.

Gias Uddin High School

25.9146377

89.4384048

3.

Taluk Kutamara

25.9118099

89.4308433

S.N.

Location Type

Location Name

Latitude

Longitude

1.

Commercial Area

Shena Moitry Hawakers Market

25.9090931

89.434136

2.

Circuit House

25.90709044

89.43392897

3.

Fakol Bus Stand

25.9056394

89.43392639

4.

Railway Station

25.9122997

89.4444797

5.

Mosque Market

25.9159516

89.44350907

6.

BDR Bazar

25.9160335

89.4441874

7.

Rajshahi Agriculture Development Bank

25.9145358

89.4367994

8.

Occupation Bank

25.9140506

89.4359922

9.

Appolo Dayagonestic Center

25.9131115

89.4352696

S.N.

Location Type

Location Name

Latitude

Longitude

1.

Road Intersection Area

TNT More

25.9124799

89.4340799

2.

CP More

25.9118932

89.4397034

3.

Alorupa More

25.9147773

89.4421312

4.

Mission More Lalmonirhat

25.9119544

89.4338259

5.

Main Road Lalmonirhat

25.9117807

89.4292516

S.N.

Location Type

Location Name

Latitude

Longitude

1.

Industrial Area

Store Bicic

25.9031959

89.4091777

2.

Jaman Poltry Fids Product and Industry

25.9019638

89.4089987

3.

West Bicic

25.9026462

89.4079169

4.

Fatema Cuton Cutting Mill

25.9037343

89.407952

S.N.

Location Type

Location Name

Latitude

Longitude

1.

Village Area

Station Para

25.9110576

89.4408799

2.

Harivanga

25.9040594

89.4330466

3.

Balatari

25.9086148

89.4292618

3.3. Data Collection
As part of the survey, Air Quality was measured in different locations of the Lalmonirhat District town area for two days with the help of various automated portable instruments, namely the Air Quality Monitor and the Handheld Carbon Monoxide Meter. GPS data was also collected by Garmin ETrex 10. Four individual data of PM1, PM2.5, PM10 and CO was collected from each location. Data was collected from 32 different locations by the CAPS team. Data was collected in different times in a day from morning to late evening. Sharing the instrument details below.
Table 2. Instrument Description for Air Quality Monitor (Particulate Matter).

S. N.

Instrument Name

Air Quality Monitor, Indoor Outdoor Formaldehyde (HCHO) Detector

1.

Instrument Name

Air Quality Monitor, Indoor Outdoor Formaldehyde (HCHO) Detector

2.

Brand

Saiko

3.

Model

Model: DM106 B07SCM4YN3

4.

Measuring Parameter

PM1, PM2.5, PM10, HCHO, TVOC, AQI, Temperature, Humidity

5.

PM2.5 /PM1/ PM10Technology

Laser Scattering

6.

HCHO Technology

Electrochemistry sensor

7.

TVOC Technology

Semiconductor sensor

8.

Processor

ARM, High-speed complex calculations

9.

Detection Range

AQI 0-500

10.

HCHO

0.001-1.999 mg/m3

11.

TVOC

0.001-9.999 mg/m3

12.

Temperature

0-50C

13.

Relative Humidity

0-90%

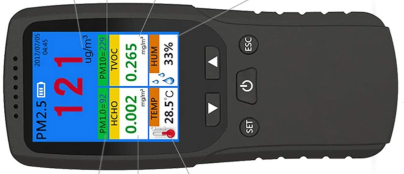
Figure 2. Air Quality Monitor, Indoor Outdoor Formaldehyde (HCHO) Detector.
3.4. Data Processing
Collected data was input into an IBM SPSS V20 and MS Excel 2020. The study used a formula for the conversion of the concentration of PM2.5 and PM10 to AQI. Formula for Conversion- To convert from concentration to AQI, this equation was used:
I=Ihigh-IlowChigh-ClowC-Clow+Ilow
If multiple pollutants are measured, the calculated AQI is the highest value calculated from the above equation for each pollutant.
Where:
I = the (Air Quality) index
C = the pollutant concentration
C low = the concentration breakpoint that is ≤ C
C high = the concentration breakpoint that is ≥ C
I low = the index breakpoint corresponding to C low
I high = the index breakpoint corresponding to C high {\displaystyle C_{high}}
3.5. Map Preparation and Result Interpretation
MS Excel, IBM SPSS V20, and MS Excel 2020 were used for data analysis in this study. Various visual tools—including graphs, tables, diagrams, and box-whisker plots were generated to interpret the nature and distribution of the data. Descriptive statistics were applied to assess the dispersion of each parameter across different land use types, and ANOVA was conducted to test statistical significance. The results are presented through a combination of charts, graphs, and maps. For spatial analysis, ArcGIS 10.4.1 was used to develop both concentration and AQI maps for the Lalmonirhat District town area. Multiple projected locations were used in GIS to create detailed maps, with varying color schemes applied to indicate different concentration levels for enhanced interpretability.
4. Result and Discussion
4.1. Comparison among Concentration of PM1, PM2.5, and PM10 at Different Landuse in Lalmonirhat District Area
Figure 3 (a) shows the concentration (µg/m3) of PM1, PM2.5, and PM10 of some locations in sensitive areas in Lalmonirhat district town. These particular locations included administrative offices, educational institutes, and mosques. As we could see, the government was among the three polluted places among these five sensitive places. Library, Church of God Convention Center, and Fellowship Church with PM2.5 concentration of 110.25, 109.00, and 82.75 µg/m3 respectively, and one contaminated place was the Land Office. A comparatively less polluted place was BGB Lalmonirhat. It has been observed that the concentration of PM1, PM2.5, and PM10 of the Govt. Library and Land Office were 66.00, 110.25, and 141.25 µg/m3 and 25.00, 43.00, and 54.67 µg/m3, respectively. It was also noted that the concentrations of PM2.5 found in the most polluted location were 1.70 times higher than Bangladesh National Ambient Air Quality Standards (NAAQS), which is 65 µg/m3 set by the Department of Environment (DoE). The concentrations of PM2.5 and PM10 found in that location were 4.41 and 2.83 times higher than World Health Organization (WHO) standard level respectively. The Air Quality Standard (24-hour) set by the WHO for PM2.5 and PM10 are 25 and 50 µg/m3 respectively. The study estimated that in all sensitive areas, 77.29% of PM2.5 was present in PM10 and 59.92% of the PM1 was present in PM2.5. Figure 3 (b) shows the concentration (µg/m3) of PM1, PM2.5, and PM10 of some locations in mixed areas in Lalmonirhat district town. It has been found that out of 3 mixed places, one most polluted place was Taluk Kutamara with PM2.5 concentration 139.75 µg/m3 and comparatively less contaminated places were Gias Uddin High School and Bashundhara Dhara Mosque respectively. It has been observed that concentrations of PM1, PM2.5, and PM10 of Taluk Kutamara and Gias Uddin High School were 85.00, 139.75 and 177.67 µg/m3 and 29.50, 48.75 and 63.25 µg/m3 respectively. It was also noted that the concentrations of PM2.5 and PM10 found in the most polluted location were 2.15 and 1.18 times higher than Bangladesh National Ambient Air Quality Standards (NAAQS) which is 65 and 150 µg/m3 set by the Department of Environment (DoE). The study estimated that the ratio of PM2.5 /PM10 was 77.67%. It was also found that 60.82% of PM1 mass was present in PM2.5.
Figure 3 (c) shows the concentration (µg/m3) of PM1, PM2.5, and PM10 of some locations in residential areas in Lalmonirhat district town. It has been found that out of 3 residential places, two highly polluted places were Staf Quarter and East Harivanga and comparatively less contaminated place was Rahaman Monjil Complex. It has been observed that concentrations of PM1, PM2.5, and PM10 of Staf Quarter and Rahaman Monjil Complex were 68.00, 114.25 and 147.50 µg/m3 and 23.75, 41.75 and 52.25 µg/m3 respectively. It was also noted that the concentrations of PM2.5 found in the most polluted location was 2.29 times higher than Bangladesh National Ambient Air Quality Standards (NAAQS) which is 65 µg/m3 set by the Department of Environment (DoE). However, the concentrations of PM2.5 and PM10 found in the most polluted location were 4.57 and 2.95 times higher than World Health Organization (WHO) standard level respectively. The Air Quality Standard (24-hour) set by the WHO for PM2.5 and PM10 are 25 and 50 µg/m3 respectively. The concentrations of PM2.5 of Staf Quarter and East Harivanga were found 114.25 and 85.25 µg/m3. The study estimated that in all residential areas, 78.52% of PM2.5 was present in PM10 and 58.55% of the PM1 was present in PM2.5. Figure 3 (d) shows the concentration (µg/m3) of PM1, PM2.5, and PM10 of some locations in road intersection areas in Lalmonirhat district town. It has been found that out of 5 road intersection places, three highly polluted places were TNT More, CP More and Mission More Lalmonirhat and comparatively least contaminated places were Alorupa More and Main Road, Lalmonirhat respectively. It has been observed that concentrations of PM1, PM2.5, and PM10 of TNT More and Alorupa More were found 77.50, 130.25 and 167.00 µg/m3 and 31.75, 51.50 and 67.00 µg/m3 respectively. It was also noted that the concentration of PM2.5 and PM10 found in the most polluted area were 2.61 and 1.11 times higher than Bangladesh National Ambient Air Quality Standards (NAAQS) which are 65 and 150 µg/m3 set by the Department of Environment (DoE). The study estimated that in all road intersection areas, 81.52% of PM2.5 was present in PM10 and 60.82% of the PM1 was present in PM2.5.
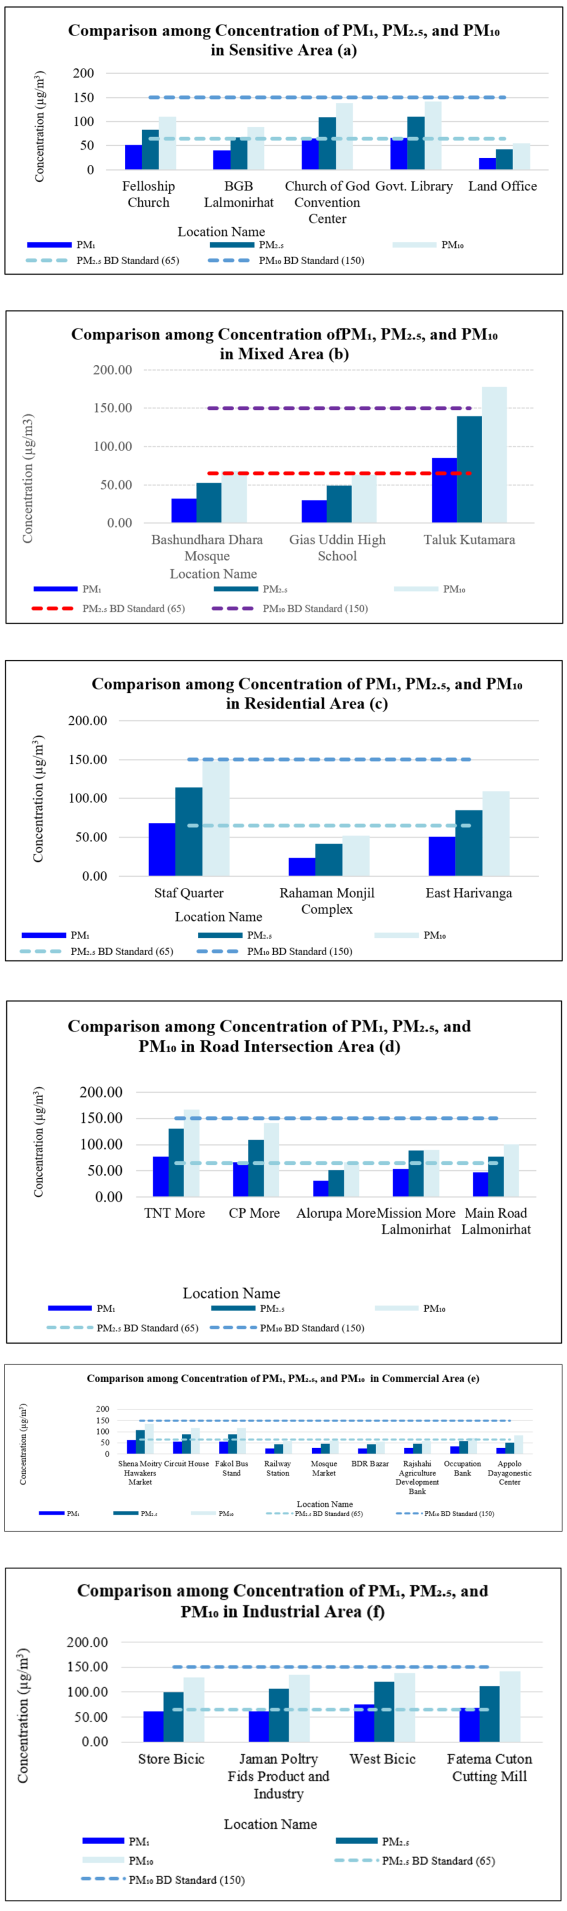
Figure 3. Comparison among Concentration of PM1, PM2.5, and PM10 at Different Landuse in Lalmonirhat District Area.
Figure 3 (e) shows the concentration (µg/m3) of PM1, PM2.5, and PM10 of some locations in commercial areas in Lalmonirhat district town. It has been found that out of 9 commercial places, three polluted places were Shena Moitry Hawakers Market, Circuit House and Fakol Bus Stand and comperatively least contaminated places were BDR Bazar, Railway Station and Rajshahi Agriculture Development Bank. It has been observed that concentrations of PM1, PM2.5, and PM10 of Shena Moitry Hawakers Market and BDR Bazar were 63, 108 and 136 µg/m3 and 26, 44 and 56 µg/m3 respectively. It was also noted that the concentration of PM2.5 found in the most polluted area was 2.16 times higher than Bangladesh National Ambient Air Quality Standards (NAAQS) which is 65 µg/m3 set by the Department of Environment (DoE). However, the concentrations of PM2.5 and PM10 found in the most polluted location were 4.32 and 2.72 times higher than World Health Organization (WHO) standard level respectively. The Air Quality Standard (24-hour) set by the WHO for PM2.5 and PM10 are 25 and 50 µg/m3 respectively. The study estimated that in all commercial areas, 75.73% of PM2.5 was present in PM10 and 59.56% of the PM1 was present in PM2.5.
Figure 3 (f) shows the concentration (µg/m) of PM1, PM2.5, and PM10 of some locations in industrial locations in Lalmonirhat district town. It has been found that out of 4 industrial places, three highly polluted places were West BSCIC, Fatema Cuton Cutting Mill and Jaman Poltry Fids Product and Industry with PM2.5 concentration of 121.25, 111.33 and 106.75 µg/m3 respectively and relatively less polluted place was Store BSCIC with PM2.5 concentration 99.25 µg/m3 respectively. It has been observed that concentration of PM1, PM2.5, and PM10 of West BSCIC and Store BSCIC were 75.75, 121.25 and 139.00 µg/m3 and 61.75, 99.25 and 129.50 µg/m3 respectively. It was also noted that the concentrations of PM2.5 found in the most polluted area was 2.43 times higher than Bangladesh National Ambient Air Quality Standards (NAAQS) which is 65 µg/m3 set by the Department of Environment (DoE). However, the concentrations of PM2.5 and PM10 found in the most polluted location were 4.85 and 2.78 times higher than World Health Organization (WHO) standard level respectively. The Air Quality Standard (24-hour) set by the WHO for PM2.5 and PM10 are 25 and 50 µg/m3 respectively. The study estimated that in Industrial areas, 80.31% of PM2.5 was present in PM10 and 60.98% of the PM1 was present in PM2.5.
Figure 3(g) shows the concentration (µg/m3) of PM1, PM2.5, and PM10 of polluted locations in village areas in Lalmonirhat district town. It has been found that out of 3 village places, two most polluted places were the Station para and Harivanga and the less polluted place was Balatari respectively. It has been observed that concentrations of PM1, PM2.5, and PM10 of the Station para and Balatari were 72.75, 121.50 and 156 µg/m3 and 40.50, 67.75 and 86.50 µg/m3 respectively. It was also noted that the concentrations of PM2.5 and PM10 were 2.43 and 1.04 times higher than Bangladesh National Ambient Air Quality Standards (NAAQS) which are 65 and 150 µg/m3 set by the Department of Environment (DoE). The study estimated that in village areas, 77.61% of PM2.5 was present in PM10 and 61.45% of the PM1 was present in PM2.5. However, the average concentration of PM1, PM2.5, and PM10 was found highest in industrial area followed by village and road intersection area with the values of 66.90, 109.65 and 136.42 µg/m3, 57.08, 93.25 and 120.17 µg/m3 and 55.40, 91.40 and 113.15 µg/m3 respectively. Moreover, the concentration was found relatively lower in commercial area, residential area and mixed area. Furthermore, the average concentration of PM1 (38.17 µg/m3), PM2.5 (63.92 µg/m3) and PM10 (84.31 µg/m3) were found to be least in commercial area.
4.2. Descriptive Statistics of PM1 PM1, PM2.5, and PM10
The following Table 3 shows the descriptive statistics for PM1 of the studied seven land uses. The higher ranges were found in mixed area (55.50 µg/m3) and road intersection area (45.75 µg/m3) and lower ranges were found in industrial area (14.00 µg/m3) and village area (28.25 µg/m3). Among all those land uses the minimum concentration was seen in residential area (23.75 µg/m3) and the maximum concentration was seen in mixed area (85.00 µg/m3).The highest mean value of PM1.0 was found in industrial area (66.90 µg/m3) followed by village area (57.08 µg/m3) and the lowest mean was found in commercial area (38.17 µg/m3). The highest standard deviation was seen in mixed area (31.28 µg/m3) and the lowest was seen in industrial area (6.67 µg/m3). Table also shows that, the highest coefficient of variation was seen in mixed area which was 63.94% and lowest was seen in industrial area which was 9.97%. It was observed that the highest variation in the concentration of the PM1 prevailed in mixed area followed by residential area. The less variation was found in industrial area prior to village area.
Table 3. Descriptive Statistics for PM1.

S. N.

Land Use

NoL

Range (µg/m3)

Min. (µg/m3)

Max. (µg/m3)

Mean (µg/m3)

Std. Deviation (µg/m3)

Coefficient of Variation (%)

1.

Sensitive Area

5

41.00

25.00

66.00

49.55

17.43

35.17

2.

Mixed Area

3

55.50

29.50

85.00

48.92

31.28

63.94

3.

Residential Area

3

44.25

23.75

68.00

47.42

22.29

47.00

4.

Road Intersection Area

5

45.75

31.75

77.50

55.40

17.60

31.78

5.

Commercial Area

9

36.75

25.75

62.50

38.17

14.90

39.05

6.

Industrial Area

4

14.00

61.75

75.75

66.90

6.67

9.97

7.

Village Area

3

28.25

44.50

72.75

57.08

14.38

25.18

The whisker box plot shows the average of PM1 concentrations in seven land uses illustrate in 4 (a). A horizontal black line within the box marks the median; the lower boundary of the box indicates the 25th percentile, the upper boundary of the box indicates the 75th percentile. The whisker represents the maximum (upper whisker) and minimum value (lower whisker) for each land use. Whisker box plot revealed that commercial area, mixed area, sensitive area and residential area had more dispersed concentration with highest in commercial area and mixed area and the spreading of area had positively skewed distribution. Moderate dispersion was found in road intersection area and village area where both of them were positively skewed. Another point was to be noted that the values of mixed area were comparatively higher than any other land uses of this district town. The concentration of PM1 had less distribution in industrial area and positively skewed distribution. The episode was found in Taluk Kutamara due to the ongoing development work (road reconstruction).
The following Table 4 shows the descriptive statistics for PM2.5 of the studied seven land uses. The higher ranges were found in The higher ranges were found in mixed area (91.00 µg/m3) and road intersection area (78.75 µg/m3) and lower ranges were found in industrial area (22.00 µg/m3) and village area (50.00 µg/m3). Among all those land uses the minimum concentration was seen in residential area (41.75 µg/m3) and the maximum concentration was seen in mixed area (139.75 µg/m3).The highest mean value of PM2.5 was found in industrial area (109.65 µg/m3) followed by village area (93.25 µg/m3) and the lowest mean was found in commercial area (63.92 µg/m3). The highest standard deviation was seen in mixed area (51.42 µg/m3) and the lowest was seen in industrial area (9.20 µg/m3). Table also shows that, the highest coefficient of variation was seen in mixed area which was 63.95% and lowest was seen in industrial area which was 8.39%. It was observed that the highest variation in the concentration of the PM2.5 prevailed in mixed area followed by residential area. The reasons behind the higher dispersion in concentration in mixed area and residential were different types of vehicular movement and burning of fossil, fuel and biomass for cooking purpose. The less variation was found in industrial area and village area.
Table 4. Descriptive Statistics for PM2.5.

S. N.

Land Use

NoL

Range (µg/m3)

Min. (µg/m3)

Max. (µg/m3)

Mean (µg/m3)

Std. Deviation (µg/m3)

Coefficient of Variation (%)

1.

Sensitive Area

5

67.25

43.00

110.25

82.45

28.57

34.65

2.

Mixed Area

3

91.00

48.75

139.75

80.42

51.42

63.95

3.

Residential Area

3

72.50

41.75

114.25

80.42

36.49

45.38

4.

Road Intersection Area

5

78.75

51.50

130.25

91.40

30.18

33.02

5.

Commercial Area

9

63.75

43.75

107.50

63.92

24.51

38.34

6.

Industrial Area

4

22.00

99.25

121.25

109.65

9.20

8.39

7.

Village Area

3

50.00

71.50

121.50

93.25

25.63

27.48

The whisker box plot demonstrates the average of PM2.5 concentrations in seven land uses illustrate in 4 (b). A horizontal black line within the box marks the median; the lower boundary of the box indicates the 25th percentile, the upper boundary of the box indicates the 75th percentile. The whisker represents the maximum (upper whisker) and minimum value (lower whisker) for each land use. Whisker box plot revealed that commercial area, mixed area, sensitive area and residential area had more dispersed concentration with highest in commercial area and mixed area and the spreading of area had positively skewed distribution. Moderate dispersion was found in road intersection area and village area where both of them were positively skewed. Another point was to be noted that the values of mixed area were comparatively higher than any other land uses of this district town. The concentration of PM1 had less distribution in industrial area and positively skewed distribution. This area was occupied with different types of vehicle in the survey time which might be reasons of relatively higher values of PM2.5 though the surveyed locations were only two.
The following table 5 shows the descriptive statistics for PM10 of the studied seven land uses. The higher ranges were found in mixed area (114.42 µg/m3) and road intersection area (100.00 µg/m3) and lower ranges were found in industrial area (12.17 µg/m3) and village area (64.75 µg/m3). Among all those land uses the minimum concentration was seen in residential area (52.25 µg/m3) and the maximum concentration was seen in mixed area (177.67 µg/m3).The highest mean value of PM10 was found in industrial area (136.42 µg/m3) followed by village area (120.17 µg/m3) and the lowest mean was found in commercial area (84.31 µg/m3). The highest standard deviation was seen in mixed area (64.66 µg/m3) and the lowest was seen in industrial area (5.26 µg/m3). Table also shows that, the highest coefficient of variation was seen in mixed area which was 62.75% and lowest was seen in industrial area which was 3.85%. It was observed that the highest variation in the concentration of the PM10 prevailed in mixed area followed by residential area where the concentration varies a lot. The less variation was found in industrial area followed by village area.
Table 5. Descriptive Statistics for PM10.

S. N.

Land Use

NoL

Range (µg/m3)

Min. (µg/m3)

Max. (µg/m3)

Mean (µg/m3)

Std. Deviation (µg/m3)

Coefficient of Variation (%)

1.

Sensitive Area

5

86.58

54.67

141.25

106.65

36.34

34.07

2.

Mixed Area

3

114.42

63.25

177.67

103.06

64.66

62.75

3.

Residential Area

3

95.25

52.25

147.50

102.92

47.92

46.56

4.

Road Intersection Area

5

100.00

67.00

167.00

113.15

40.36

35.67

5.

Commercial Area

9

80.00

56.00

136.00

84.31

30.49

36.16

6.

Industrial Area

4

12.17

129.50

141.67

136.42

5.26

3.85

7.

Village Area

3

64.75

91.25

156.00

120.17

32.92

27.40

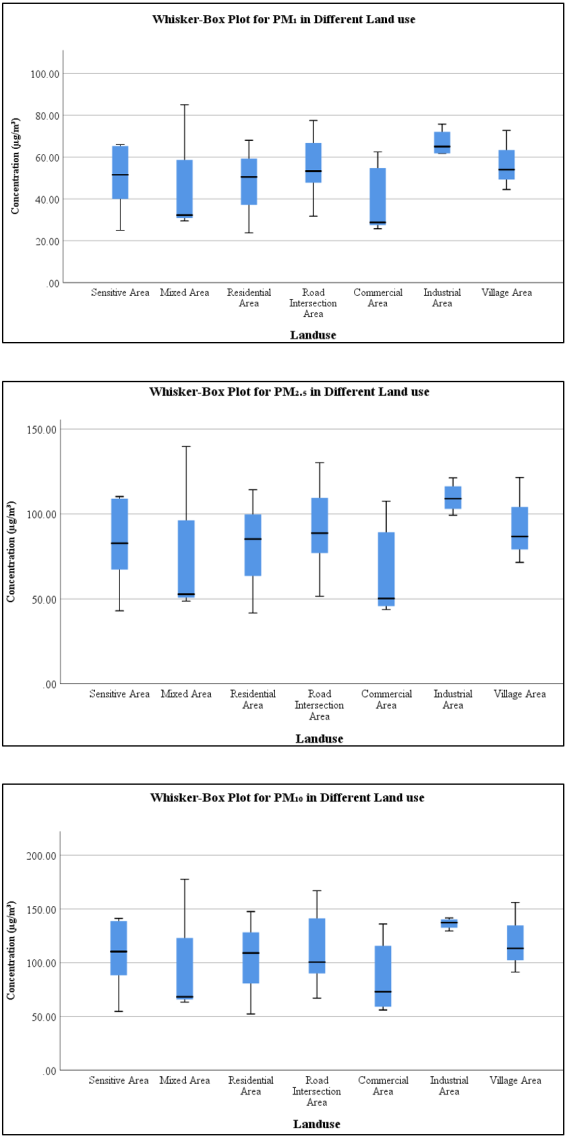
Figure 4. Whisker Box Plot showing the Concentration of PM1, PM2.5, and PM10 in Different Land use.
The whisker box plot shows the average of PM10 concentrations in seven land uses illustrate in 4 (b). A horizontal black line within the box marks the median; the lower boundary of the box indicates the 25th percentile, the upper boundary of the box indicates the 75th percentile. The whisker represents the maximum (upper whisker) and minimum value (lower whisker) for each land use. Whisker box plot revealed that commercial area, mixed area, sensitive area and residential area had more dispersed concentration with highest in commercial area and mixed area and the spreading of area had positively skewed distribution. Moderate dispersion was found in road intersection area and village area where both of them were positively skewed. Another point was to be noted that the values of mixed area were comparatively higher than any other land uses of this district town. The concentration of PM10 was tightly clustered in industrial area and negatively skewed distribution. The episode was found in Taluk Kutamara due to the ongoing development work (road reconstruction).
4.3. Significance Test
Table 6 shows ANOVA for the significant test. ANOVA has been performed to find whether the changes in the concentration of all the parameters between and within land uses are significant. Here the F value of found to be 1.468 for PM1, 1.339 for PM2.5 and 1.070 for PM10 respectively. P values found for PM1, PM2.5, and PM10 are 0.230, 0.277 and 0.406 respectively. The following tables revealed that the concentrations of none of the parameters change significantly as the p values are greater than 0.05. Therefore, the concentration of PM might not be changed significantly between and within in the land uses.
Table 6. Significance Test.

ANOVA

Sum of Squares

df

Mean Square

F

Sig.

PM1

Between Groups

2722.522

6

453.754

1.468

0.230

Within Groups

7728.297

25

309.132

Total

10450.819

31

PM2.5

Between Groups

6823.550

6

1137.258

1.339

0.277

Within Groups

21231.672

25

849.267

Total

28055.222

31

PM10

Between Groups

8847.643

6

1474.607

1.070

0.406

Within Groups

34439.169

25

1377.567

Total

43286.812

31

4.4. Land Use Based Cluster Analysis
Figure 5 shows the dendrogram plot obtained from cluster analysis in terms of PM1.0 with Z-score normalization. For this analysis, group linkage and Euclidean distance have been considered. Four clusters have been found from the below graph. The first cluster consists of sensitive area, mixed area and residential area; the second cluster includes road intersection area and village area; the third cluster is consisted of commercial area; and the fourth cluster includes industrial area alone. First and second clusters join at the approximate distance of 5 which joins with third cluster at the approximate distance of 15. This broad cluster joins with fourth cluster at the approximate distance of 25. Figure 5 shows the dendrogram plot obtained from cluster analysis in terms of PM2.5 with Z-score normalization. For this analysis, between-group linkage and Euclidean distance have been considered. Three clusters have been found from the below graph. The first cluster consists of residential area, mixed area, sensitive area, road intersection area and village area; the second cluster includes commercial area and the third cluster is consisted of industrial area alone. First and second clusters join at the approximate distance of 15 which joins with third cluster at the approximate distance of 25.
Figure 5 shows the dendrogram plot obtained from cluster analysis in terms of PM10with Z-score normalization. For this analysis, between-group linkage and Euclidean distance have been considered. Three clusters have been found from the below graph. The first cluster consists of residential area, mixed area, sensitive area, road intersection area and village area; the second cluster includes commercial area and the third cluster is consisted of industrial area alone. First and second clusters join at the approximate distance of 15 which joins with third cluster at the approximate distance of 25.
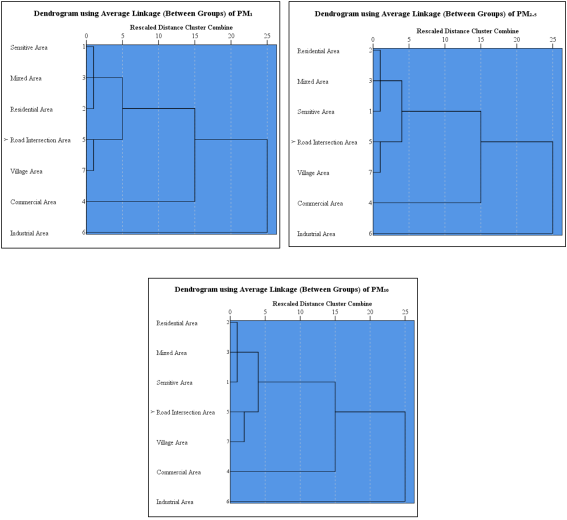
Figure 5. Rescaled Distance Cluster Combine for PM1, PM2.5, and PM10 in Different Land use.
4.5. Concentration Map of PM1, PM2.5, and PM10 Lalmonirhat District Town in 2021
Figure 6 show the concentration of Particulate Matter (PM1) at various location of Lalmonirhat District town area in the year of 2021. Concentrations of Particulate Matter (PM1) are expressed in µg/m3. The concentration of µg/m3 means one-millionth of a gram of PM1 per cubic meter of air. Yellow areas have less, while progressively higher concentrations are shown in orange and red. The concentration of PM1 was found to higher (75-84 µg/m3) in the Taluk Kutamara, TNT More and West BSCIC area. It also shows that PM1 concentration was found (22-30 µg/m3) in Rahaman Monjil Complex, Land Office, BDR Bazar, Railway Station, Rajshahi Agriculture Development Bank, Appolo Dayagonestic Center, Mosque Market and Gias Uddin High School. The maximum concentration shows with red flag and minimum concentration with green flag. The maximum concentration was found in Taluk Kutamara and the minimum concentration was found in Rahaman Monjil Complex.
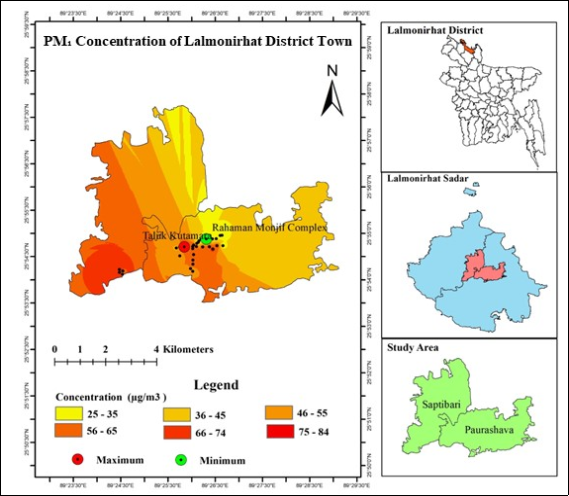
Figure 6. PM1, PM2.5, and PM10 Concentration Map of Lalmonirhat District Town in 2021..
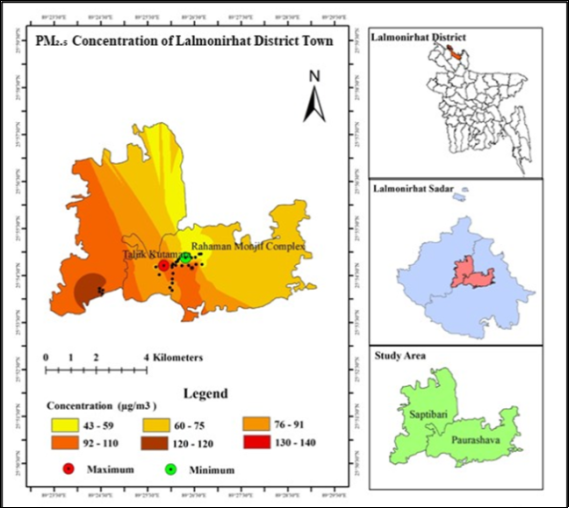
Figure 7. PM1, PM2.5, and PM10 Concentration Map of Lalmonirhat District Town in 2021.
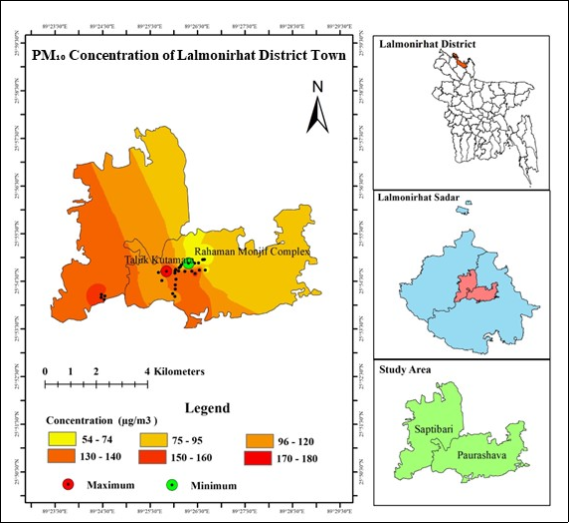
Figure 8. PM1, PM2.5, and PM10 Concentration Map of Lalmonirhat District Town in 2021.
Figure 7 show the concentration of Particulate Matter (PM2.5) at various location of Lalmonirhat District town area in the year of 2021. Concentrations of Particulate Matter (PM2.5) are expressed in µg/m3. The concentration of µg/m3 means one-millionth of a gram of PM2.5 per cubic meter of air. Yellow areas have little, while progressively higher concentrations are shown in orange and red. The concentration of PM2.5 was found to higher (110-140 µg/m3) in the Taluk Kutamara, TNT More, Station Para, West BSCIC, Staf Quarter, Fatema Cuton Cutting Mill and Govt. Library area. It also shows that PM2.5 concentration was found (41-59 µg/m3) in Rahaman Monjil Complex, Land Office, BDR Bazar, Railway Station, Rajshahi Agriculture Development Bank, Mosque Market, Gias Uddin High School, Appolo Dayagonestic Center, Alorupa More and Occupation Bank. The maximum concentration shows with red flag and minimum concentration with green flag. The maximum concentration was found in Taluk Kutamara and the minimum concentration was found in Rahaman Monjil Complex.
Figure 8 shows the concentration of Particulate Matter (PM10) at various locations of Lalmonirhat District town area in the year 2021. Concentrations of Particulate Matter (PM10) are expressed in µg/m3. The concentration of µg/m3 means one-millionth of a gram of PM1 per cubic meter of air. Yellow areas have little, while progressively higher concentrations are shown in orange and red. The concentration of PM10 was found to higher (141-180 µg/m3) Taluk Kutamara, TNT More, Station Para, Staf Quarter, Fatema Cuton Cutting Mill, CP More and Govt. Library area. It also shows that PM10 concentration was found (52-67 µg/m3) in Rahaman Monjil Complex, Land Office, BDR Bazar, Railway Station, Rajshahi Agriculture Development Bank, Mosque Market, Gias Uddin High School and Alorupa More. The maximum concentration shows with red flag and minimum concentration with green flag. The maximum concentration was found in Taluk Kutamara and the minimum concentration was found in Rahaman Monjil Complex.
4.6. AQI on PM2.5 Concentration of Lalmonirhat District Town in 2021
Figure 9 Shows the Lalmonirhat District town area based on PM2.5. In this map, different colors represent the category of AQI according to Bangladesh National Ambient Air Pollution Standard. The map shows that AQI (151-200) was unhealthy condition in the Taluk Kutamara, West BSCIC, Staf Quarter, TNT More, Station Para, Fatema Cuton Cutting Mill and the central part of the city which is indicating in red color. Also shows that, Rahaman Monjil Complex, Land Office, BDR Bazar, Railway Station, Rajshahi Agriculture Development Bank and the north side of the city were found in a cuation condition where the AQI was (101-150) which indicate by orange color. The maximum concentration was found in Taluk Kutamara which shows with red flag and the minimum concentration was found in Rahaman Monjil Complex that indicates with green flag.
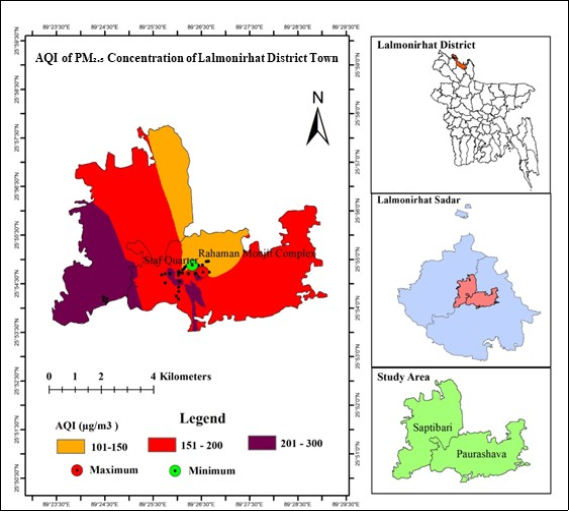
Figure 9. AQI on PM2.5 Concentration Map of Lalmonirhat District Town in 2021.
5. Conclusion
The study found that the average concentration of PM1, PM2.5, and PM10 of 32 places in Lalmonirhat district town area found to be 51.92, 85.93 and 109.52 µg/m3 respectively. From the outcome of this research, the studied land uses are arranged in descending order based on average concentration PM2.5 which follows as industrial area (109.65 µg/m3) > village area (93.25 µg/m3) > road intersection area (91.40 µg/m3) > sensitive area (82.45 µg/m3) > residential area (80.42 µg/m3) > mixed area (80.42 µg/m3) > commercial area (63.92 µg/m3). Along with that, the average concentration of PM2.5 (109.65 µg/m3) of different land use was found higher in industrial area which 2.19 times higher than the standard value of PM2.5. The National Air Quality Standard (Daily) set by the Department of Environment (DoE) for PM2.5 is 65 µg/m3. Moreover, it was estimated that the average ratio of PM2.5 /PM10 showed that the PM2.5 mass was 78.38% of the PM10 mass and the average ratio of PM1/PM2.5 showed that the PM1 mass was 60.3% of the PM2.5 mass. Based on PM1.0, PM2.5 and PM10 dispersion, among all those land use the maximum range was found in mixed and road intersection areas where the minimum range was found in the area and industrial area. Further found that in PM1.0, PM2.5 and PM10 dispersion Std. deviation and coefficient of variation higher in the mixed area and residential area. Moreover, whisker box graph of PM1.0, PM2.5 and PM10 show that values commercial area, mixed area, sensitive area and residential area had more dispersed concentration with highest in commercial area and and the industrial area had concentrated value. It also revealed that that the concentrations of none of the parameters change significantly as the p values are greater than 0.05. From the dendrogram plot of PM1, PM2.5, PM10 it has been found out that each of the analyses included at least three clusters at the first phase and these were consecutive to make a single cluster at the approximate distance of 25.
Abbreviations

AQI

Air Quality Index

NAAQS

National Ambient Air Quality Standard

PM

Particulate Matter

WHO

World Health Organization

CAPS

Center for Atmosphere Pollution Studies

DoE

Department of Environment

NRDC

Natural Resources Defense Council

ANOVA

Analysis of Variations

Conflicts of Interest
The authors declare no conflicts of interest.
References
[1] Krzyzanowski, M., Apte, J. S., Bonjour, S. P., Brauer, M., Cohen, A. J., Prüss-Ustun, A. M. (2014). Air Pollution in the Mega-cities. Curr. Envir Health Rpt
[2] Harrison, R. M., Pope, F. D. and Shi, Z. (2014) Air pollution, Earth Systems, and Environmental Sciences, pp. 1-17.
[3] Razib, Nayeem, A. A., Hossain, M. S. and Majumder, A. K. (2020). PM2.5 concentration and meteorological characteristics in Dhaka, Bangladesh. Bangladesh J. Sci. Ind. Res. 55(2): 89-98.
[4] Hossen, M. A. and Hoque, A. (2018). Variation of Ambient Air Quality Scenario in Chittagong City: A Case Study of Air Pollution Journal of Civil, Construction and Environmental Engineering, 3(1): 10-16.
[5] Begum, B. A., Biswas, S. K., Nasiruddin, M., Hossain, A. M. S. and Hopke, P. K. (2009). Source Identification of Chittagong Aerosol by Receptor Modeling. Environmental Engineering Science, 26(3): 679-689.
[6] Hossain, M. M., Majumder, A. K., Islam, M. and Nayeem, A. A. (2019). Study on Ambient Particulate Matter (PM2.5) with Different Mode of Transportation in Dhaka City, Bangladesh. American Journal of Pure and Applied Biosciences, 1 (4): 12-19.
[7] Salam, A., Hossain, T., Siddique, M. N. A. and Alam, A. M. S. (2008). Characteristics of Atmospheric Trace Gases, Particulate Matter, and Heavy Metal Pollution in Dhaka, Bangladesh. Air Qual Atmos, 1: 101-109.
[8] Ahammad, S. S., Siraj, S., Ali, M. S., Kaji, M. A. and Kazi, F. K. (2010). Tracking of Possible Sources of Dhaka City Air Pollutants. Proc. of International Conference on Environmental Aspects of Bangladesh (ICEAB10), 136-137, Japan.
[9] IQAir World Air Quality Report 2020.
[10] IQAir World Air Quality Report 2021.
[11] Health Effects Institute (HEI) Annual Report 2020.
[12] Haque, H. A., Huda, N., Tanu, F. Z., Sultana, N., Hossain, M. S. A. and Rahman, M. H. (2017). Ambient Air Quality Scenario in and around Dhaka City of Bangladesh. Barisal University Journal Part 1, 4(1): 203-218.
[13] Rana, M. M., Sulaiman, N., Sivertsen, B., Khan, M. F. and Nasreen, S. (2016). Trends in Atmospheric Particulate Matter in Dhaka, Bangladesh, and the Vicinity. Environ Sci. Pollut. Res.
[14] Ahmed, S., Shamima, Q., Eva, H., and Bhowmik, M. (2016). Effect of Air Pollution on FVC, FEV 1, and FEV 1 /FVC% of the Traffic Policemen in Dhaka city. J. Bangladesh Soc. Physiol., 11(2): 39-42.
[15] Alam, M. Z., Armin, E., Haque, M., Halsey, J., Kayesh, E., and Qayum, A. (2018). Air Pollutants and Their Possible Health Effects at Different Locations in Dhaka City. Int. J. Environ. Sci. Nat. Res., 9(4): 1-11.
[16] Woo, M. K., Young, E. S., Mostofa, M. G., Golam, M., Afroz, S., Hasan, M. O. S. I., Quamruzzaman, Q., Bellinger, D. C., Christiani, D. C. and Mazumdar, M. (2018). Lead in Air in Bangladesh: Exposure in a Rural Community with Elevated Blood Lead Concentrations among Young Children. Int. J. Environ. Res. Public Health, 15: 1947.
[17] Tusher, T. R., Ashraf, Z. and Akter, S. (2018). Health Effects of Brick Kiln Operations: A Study on Largest Brick Kiln Cluster in Bangladesh. South East Asia Journal of Public Health, 8(1): 32-36.
[18] Nayeem, A. A., Hossain, M. S., Majumder, A. K. and Carter, W. S. (2019). Spatiotemporal Variation of Brick Kilns and It’s Relation to Ground-Level PM2.5 Through MODIS Image at Dhaka District, Bangladesh. Int. J. of Environmental Pollution & Environmental Modelling, 2(5): 277-284.
[19] Begum, B. A., Biswas, S. K. and Nasiruddin, M. (2010). Trend and Spatial Distribution of Air Particulate Matter Pollution in Dhaka City. Journal of Bangladesh Academy of Sciences, 34(1): 33-48.
[20] Salam, A., Hasan, M., Begum, B., Begum, M. and Biswas, S. (2013). Chemical Characterization of Biomass Burning Deposits from Cooking Stoves in Bangladesh. Biomass & Bioenergy, 52: 122-130.
[21] Begum, B. A., Biswas, S. K., Markwitz, A. and Hopke, P. K. (2018). Identification of Sources of Fine and Coarse Particulate Matter in Dhaka, Bangladesh. Aerosol and Air Quality Research, 10: 345-353.
[22] Health Effects Institute (HEI) Annual Report 2019.
[23] World Health Organization Annual Report 2018.
[24] Salam, A., Assaduzzaman, M., Hossain, M. N. and Siddiki, N. A. (2015). Water Soluble Ionic Species in the Atmospheric Fine Particulate Matters (PM2.5) in a Southeast Asian Mega City (Dhaka, Bangladesh). Open Journal of Air Pollution, 4: 99-108.
[25] Tasnuva, A., reza, A., Islam, M. T. and Azad, A. K., (2014). Impact of Air Pollutant on Human Health in Kushtia Sugar Mill, Bangladesh. International Journal of Scientific Research in Environmental Sciences, 2(5): 184-191.
[26] Wikipedia contributors. (2021, December 10). Lalmonirhat District town Upazila. Wikipedia.
[27] Majumder, A. K., Mahmud, K. K., Rahman, M., Patoary, M. N. A., Gautam, S., and Tanima, K. R. (2025). Spatial distribution and health implications of particulate matter concentrations across diverse land use types in Dinajpur District, Bangladesh. Geosystems and Geoenvironment, 4(3), 100397, ISSN 2772-8838.
Cite This Article
  • APA Style

    Majumder, A. K., Ahamed, M. R. (2025). Spatial Variation of PM1, PM2.5, and PM10 Linked to Urban Land Use in Lalmonirhat, Bangladesh. International Journal of Environmental Monitoring and Analysis, 13(4), 217-235. https://doi.org/10.11648/j.ijema.20251304.18

    Copy | Download

    ACS Style

    Majumder, A. K.; Ahamed, M. R. Spatial Variation of PM1, PM2.5, and PM10 Linked to Urban Land Use in Lalmonirhat, Bangladesh. Int. J. Environ. Monit. Anal. 2025, 13(4), 217-235. doi: 10.11648/j.ijema.20251304.18

    Copy | Download

    AMA Style

    Majumder AK, Ahamed MR. Spatial Variation of PM1, PM2.5, and PM10 Linked to Urban Land Use in Lalmonirhat, Bangladesh. Int J Environ Monit Anal. 2025;13(4):217-235. doi: 10.11648/j.ijema.20251304.18

    Copy | Download

  • @article{10.11648/j.ijema.20251304.18,
      author = {Ahmad Kamruzzaman Majumder and Md. Rizvee Ahamed},
      title = {Spatial Variation of PM1, PM2.5, and PM10 Linked to Urban Land Use in Lalmonirhat, Bangladesh
    },
      journal = {International Journal of Environmental Monitoring and Analysis},
      volume = {13},
      number = {4},
      pages = {217-235},
      doi = {10.11648/j.ijema.20251304.18},
      url = {https://doi.org/10.11648/j.ijema.20251304.18},
      eprint = {https://article.sciencepublishinggroup.com/pdf/10.11648.j.ijema.20251304.18},
      abstract = {This study aims to assess the concentration of Particulate Matter (PM1, PM2.5, and PM10) in relation to various land uses in Lalmonirhat district town. Study conducted this investigation in 32 sites within Lalmonirhat district town, using a portable Air Quality Monitor and an Indoor Outdoor Formaldehyde (HCHO) Detector (Model: DM106). The average concentrations of PM1, PM2.5 and PM10 are 51.92, 85.93, and 109.52 µg/m3, respectively. The average concentration of PM2.5 (109.65 µg/m3) in various land uses was observed to be elevated in industrial areas, exceeding the acceptable level by a factor of 2.19. The average PM2.5 / PM10 ratio is assessed at 78.38%, whereas the PM1/PM2.5 ratio is 60.3%. The alterations in the concentration of all investigated factors between land uses were negligible. The results of this research indicate that the examined land uses are ranked in descending order of average PM2.5 concentration as follows: industrial area, village area, road intersection area, sensitive region, residential area, mixed area, and commercial area.},
     year = {2025}
    }
    

    Copy | Download

  • TY  - JOUR
    T1  - Spatial Variation of PM1, PM2.5, and PM10 Linked to Urban Land Use in Lalmonirhat, Bangladesh
    
    AU  - Ahmad Kamruzzaman Majumder
    AU  - Md. Rizvee Ahamed
    Y1  - 2025/08/21
    PY  - 2025
    N1  - https://doi.org/10.11648/j.ijema.20251304.18
    DO  - 10.11648/j.ijema.20251304.18
    T2  - International Journal of Environmental Monitoring and Analysis
    JF  - International Journal of Environmental Monitoring and Analysis
    JO  - International Journal of Environmental Monitoring and Analysis
    SP  - 217
    EP  - 235
    PB  - Science Publishing Group
    SN  - 2328-7667
    UR  - https://doi.org/10.11648/j.ijema.20251304.18
    AB  - This study aims to assess the concentration of Particulate Matter (PM1, PM2.5, and PM10) in relation to various land uses in Lalmonirhat district town. Study conducted this investigation in 32 sites within Lalmonirhat district town, using a portable Air Quality Monitor and an Indoor Outdoor Formaldehyde (HCHO) Detector (Model: DM106). The average concentrations of PM1, PM2.5 and PM10 are 51.92, 85.93, and 109.52 µg/m3, respectively. The average concentration of PM2.5 (109.65 µg/m3) in various land uses was observed to be elevated in industrial areas, exceeding the acceptable level by a factor of 2.19. The average PM2.5 / PM10 ratio is assessed at 78.38%, whereas the PM1/PM2.5 ratio is 60.3%. The alterations in the concentration of all investigated factors between land uses were negligible. The results of this research indicate that the examined land uses are ranked in descending order of average PM2.5 concentration as follows: industrial area, village area, road intersection area, sensitive region, residential area, mixed area, and commercial area.
    VL  - 13
    IS  - 4
    ER  - 

    Copy | Download

Author Information
  • Department of Environmental Science, Stamford University Bangladesh, Dhaka, Bangladesh. Center for Atmospheric Pollution Studies (CAPS), Dhaka, Bangladesh

  • Department of Environmental Science, Stamford University Bangladesh, Dhaka, Bangladesh

  • Abstract
  • Keywords
  • Document Sections

    1. 1. Introduction
    2. 2. Objectives of the Study
    3. 3. Study Area and Methodology
    4. 4. Result and Discussion
    5. 5. Conclusion
    Show Full Outline
  • Abbreviations
  • Conflicts of Interest
  • References
  • Cite This Article
  • Author Information