This research inspects characteristics of wind speed and corresponding wind power potential in the Fukuoka-shi, located in the Kyushu region of Japan, over the period from 2018 to 2022. By employing the comprehensive statistical approach, the study systematically evaluates time-series wind speed data in order to capture both seasonal variations and long-term trends. Probability density functions are derived to assess the distribution patterns of wind speeds, which serve as the foundation for the estimating the region’s wind energy potential. Two widely recognized statistical models, the Weibull distribution and the Rayleigh distribution, are applied to monthly wind speed data. These models offer reliable and practical tools for the characterizing wind behavior, allowing for the accurate assessment of frequency and intensity of the wind speeds relevant for power generation. The analysis emphasizes variability of wind conditions across different months, underlining how seasonal changes influence the availability of the wind resources. The results approve the suitability of the Weibull and Rayleigh models in predicting wind power potential with the reasonable precision. This research not only contributes valuable insights into the renewable energy prospects of Fukuoka-shi but also provides the evidence-based guidance for policymakers, energy investors, and other stakeholders. Ultimately, the findings highlight the strategic importance of wind energy in advancing the sustainable development and strengthening the region’s renewable energy portfolio.
| Published in | Journal of Energy and Natural Resources (Volume 14, Issue 4) |
| DOI | 10.11648/j.jenr.20251404.11 |
| Page(s) | 118-129 |
| Creative Commons |
This is an Open Access article, distributed under the terms of the Creative Commons Attribution 4.0 International License (http://creativecommons.org/licenses/by/4.0/), which permits unrestricted use, distribution and reproduction in any medium or format, provided the original work is properly cited. |
| Copyright |
Copyright © The Author(s), 2025. Published by Science Publishing Group |
Wind Power, Weibull Distribution, Shape Factor, Wind Speed Data, Rayleigh Distribution
Years | 2018 | 2017 | 2018 | 2019 | 2022 | Whole year | ||||||
|---|---|---|---|---|---|---|---|---|---|---|---|---|
Parameter |
| σ |
| σ |
| σ |
| σ |
| σ |
| σ |
January | 3.222 | 1.275 | 3.25 | 1.281 | 3.639 | 1.522 | 3.083 | 1.203 | 3.278 | 1.314 | 3.294 | 1.319 |
February | 3.139 | 1.122 | 3.167 | 1.136 | 4 | 0.925 | 3.639 | 1.069 | 3 | 0.933 | 3.389 | 1.037 |
March | 3.667 | 0.8 | 3.639 | 0.769 | 3.139 | 0.944 | 2.833 | 0.947 | 2.472 | 0.644 | 3.15 | 0.821 |
April | 2.972 | 1.008 | 3.75 | 0.792 | 3.056 | 0.997 | 2.75 | 0.767 | 2.972 | 1.022 | 3.1 | 0.917 |
May | 2.778 | 0.681 | 2.611 | 0.628 | 2.778 | 0.675 | 2.028 | 0.475 | 2.389 | 0.717 | 2.517 | 0.635 |
June | 2.667 | 0.767 | 2.806 | 0.781 | 1.972 | 0.367 | 2.806 | 0.661 | 1.944 | 0.381 | 2.439 | 0.591 |
July | 2.556 | 0.794 | 2.806 | 0.806 | 2.5 | 0.797 | 2.333 | 0.714 | 2.194 | 0.661 | 2.478 | 0.754 |
August | 2.722 | 0.722 | 2.639 | 0.675 | 2.444 | 0.678 | 2.611 | 0.708 | 2.583 | 0.675 | 2.6 | 0.692 |
September | 3.111 | 1.328 | 3.833 | 1.686 | 2.583 | 0.947 | 3.75 | 1.447 | 2.472 | 0.903 | 3.15 | 1.262 |
October | 3.694 | 1.431 | 3.444 | 1.322 | 2.639 | 1.05 | 3.111 | 1.333 | 2.889 | 1.144 | 3.156 | 1.256 |
November | 2.722 | 0.961 | 2.694 | 0.942 | 3.25 | 1.314 | 2.333 | 0.772 | 3.389 | 1.364 | 2.878 | 1.071 |
December | 2.667 | 1.044 | 3.25 | 1.314 | 3.722 | 1.767 | 3.389 | 1.447 | 3.194 | 1.297 | 3.244 | 1.374 |
Yearly | 2.993 | 0.994 | 3.157 | 1.011 | 2.977 | 0.999 | 2.889 | 0.962 | 2.731 | 0.921 | 2.95 | 0.977 |
Period | 2018 | 2017 | 2018 | 2019 | 2022 | Whole year | ||||||
|---|---|---|---|---|---|---|---|---|---|---|---|---|
Parameter |
|
|
|
|
|
|
|
|
|
|
|
|
January | 2.737 | 3.622 | 2.75 | 3.652 | 2.577 | 4.098 | 2.78 | 3.464 | 2.699 | 3.686 | 2.702 | 3.704 |
February | 3.056 | 3.512 | 3.044 | 3.544 | 4.905 | 4.361 | 3.78 | 4.027 | 3.554 | 3.332 | 3.617 | 3.76 |
March | 5.224 | 3.983 | 5.405 | 3.945 | 3.685 | 3.479 | 3.287 | 3.159 | 4.306 | 2.716 | 4.307 | 3.461 |
April | 3.235 | 3.317 | 5.415 | 4.066 | 3.374 | 3.403 | 4.003 | 3.034 | 3.187 | 3.319 | 3.753 | 3.432 |
May | 4.606 | 3.04 | 4.702 | 2.854 | 4.648 | 3.038 | 4.837 | 2.213 | 3.697 | 2.647 | 4.462 | 2.759 |
June | 3.872 | 2.947 | 4.012 | 3.095 | 6.216 | 2.122 | 4.805 | 3.063 | 5.879 | 2.098 | 4.661 | 2.667 |
July | 3.557 | 2.838 | 3.877 | 3.101 | 3.46 | 2.78 | 3.619 | 2.589 | 3.68 | 2.432 | 3.638 | 2.748 |
August | 4.225 | 2.994 | 4.396 | 2.896 | 4.027 | 2.696 | 4.124 | 2.876 | 4.295 | 2.838 | 4.212 | 2.86 |
September | 2.521 | 3.506 | 2.44 | 4.323 | 2.973 | 2.894 | 2.812 | 4.211 | 2.986 | 2.769 | 2.7 | 3.542 |
October | 2.802 | 4.149 | 2.829 | 3.867 | 2.721 | 2.967 | 2.51 | 3.506 | 2.734 | 3.247 | 2.719 | 3.548 |
November | 3.098 | 3.044 | 3.132 | 3.011 | 2.674 | 3.656 | 3.323 | 2.6 | 2.687 | 3.811 | 2.927 | 3.226 |
December | 2.768 | 2.996 | 2.674 | 3.656 | 2.246 | 4.202 | 2.519 | 3.819 | 2.661 | 3.594 | 2.543 | 3.655 |
Yearly | 3.309 | 3.336 | 3.445 | 3.512 | 3.275 | 3.32 | 3.301 | 3.221 | 3.255 | 3.047 | 3.318 | 3.287 |
| Actual data | Probability density function | Rayleigh |
|---|---|---|---|
Wind speed | |||
1 | 0.05584581 | 6.27E-02 | 0.18145621 |
2 | 0.254620409 | 0.263201449 | 0.360791431 |
3 | 0.407600865 | 0.390281802 | 0.532034931 |
4 | 0.229095336 | 0.233755677 | 0.709379908 |
5 | 0.045210225 | 0.047846981 | 0.886724885 |
6 | 0.003132538 | 0.002580537 | 1.064069862 |
7 | 7.62071E-05 | 2.6987E-05 | 1.241414839 |
8 | 6.50929E-07 | 3.90724E-08 | 1.418759816 |
9 | 1.95214E-09 | 5.46571E-12 | 1.596104793 |
10 | 2.05555E-12 | 5.05999E-17 | 1.77344977 |
11 | 7.59948E-16 | 2.08944E-23 | 1.950794747 |
12 | 9.86459E-20 | 2.55673E-31 | 2.128139724 |
R2 | 0.998083694 | 0.421341892 | |
RMSE | 0.006124534 | 0.270625087 |
Year | (m/s) | K | c (m/s) | (m/s) | (m/s) | P (W/m2) |
|---|---|---|---|---|---|---|
2018 | 2.993055556 | 3.308934709 |
| 2.992451901 | 3.848626557 | 21.92684074 |
2019 | 3.157407407 | 3.444843208 | 3.51215348 | 3.179392188 | 4.011322274 | 25.26486349 |
2020 | 2.976851852 | 3.274581915 | 3.319902437 | 2.970278933 | 3.840160055 | 21.68143636 |
2021 | 2.888888889 | 3.30071027 | 3.220521994 | 2.886940693 | 3.717528162 | 19.73976799 |
2022 | 2.731481481 | 3.255298692 | 3.318243222 | 2.964462477 | 3.844200738 | 21.69235036 |
NWP | Numerical Weather Prediction |
WRF | Weather Research and Forecasting |
RMSE | Root Mean Square Error |
| [1] | Eze, V. H. U., Edozie, E., Umaru, K., and Ogenyi, F. "Overview of Renewable Energy Power Generation and Conversion (2015-2022)," Eurasian Journal of Science and Engineering, 2022, vol. 4, no. 1, pp. 105-113. |
| [2] | Habib, Md. A., Debnath, S. K., Parvej, M. S., Ferdous, J., Asgar, M. A., Habib, M. A., and Jemy, M. A., "Evaluating the Feasibility of a Photovoltaic-Fuel Cell Hybrid Energy System for the Ice Cream Factory in Fukuoka City, Japan: An Economic and Technical Analysis," International Journal of Education and Management Engineering (IJEME), 2024, Vol. 14, No. 4, pp. 23-35. |
| [3] | Redclift, M. "Sustainable development and global environmental change: Implications of a changing agenda," Global Environmental Change, 1992, vol. 2, no. 1, pp. 32-42, Available online: Jul. 3, 2002. |
| [4] | Gielen, D., Boshell, F., Saygin, D., Bazilian, M. D., and Wagner, N. The role of renewable energy in the global energy transformation,” Energy Strategy Reviews, 2018, vol 24, pp. 38-50. |
| [5] | Islam, F., Ahshan, R., and Habib, Md. A., Feasibility analysis of large-scale utility-connected solar power generations in Japan (2022). In Proceedings of the 6th International Conference on Electrical Information and Communication Technology. IEEE. |
| [6] | Aditya, N. S., Nair, A. Y. and Veni, S. Determining the Effect of Correlation between Asthma/Gross Domestic Product and Air Pollution. International Conference on Wireless Communications Signal Processing and Networking (WiSPNET), IEEE, 2022. pp. 44-48. |
| [7] | Dyrholm, M., Backwell, B., Zhao, F., Gannoum, E., Mapes, C. L., Global Wind Report”, Brussels, Global Energy Council, 2022. |
| [8] | Giebel, G. and G. N. Kariniotakis, "Wind power forecasting—a review of the state of the art," Renewable Energy Forecasting, 2017, pp. 31-52. |
| [9] | Keyhani, A., Varnamkhasti, M. G., Khanali, M. and Abbaszadeh, R. “An assessment of wind energy potential as a power generation source in the capital of Iran, Tehran.” Energy, 2010, Vol 35, pp 188-201. |
| [10] | Akpinar, E. K. and Akpinar; S. “An assessment on seasonal analysis of wind energy characteristics and wind turbine characteristics.” Energy Conversion and Management, 2005, Vol 46, pp 1848-1867. |
| [11] | Buhairi, M. H. A. “A statistical analysis of wind speed data and an assessment of wind energy potential in Taiz-yemen” Ass. Univ. Bull. Envirorn. Res., 2006, 9(2), 21-33. |
| [12] | Habib, Md. A., “Wind Speed Data and Statistical Analysis for Rangpur District in Bangladesh,” Journal of Electrical Engineering, Electronics, Control and Computer Science -JEEECCS, 2022, Volume 8, Issue 30, pp. 1-10. |
| [13] | Jacobson, M. et al.; “Assessing the Wind Energy Potential in Bangladesh Enabling Wind Energy Development with Data Products,” 2018. |
| [14] | Saifullah, A. Z. A., Karim, Md. A. and Karim, Md. R. “Wind Energy Potential in Bangladesh” American Journal of Engineering Research (AJER), 2018, 5, 85-94. |
| [15] | Shaikh, M. A., Chowdhury, K. M. A., Sen, S. and Islam, M. M. “Potentiality of wind power generation along the Bangladesh coast.” AIP Conf. Proc., 2017, 1919, 020035. |
| [16] | Mazumder, G. C., Ibrahim, A. S. Md., Shams, S. M. N., and Huque, S. “Assessment of Wind Power Potential at the Chittagong Coastline in Bangladesh.” Dhaka Univ. J. Sci., 2018, 67, 27-32. |
| [17] | Ayua, T. J., and Emetere, M.E., Technical analysis of wind energy potentials using a modified Weibull and Raleigh distribution model parameters approach in the Gambia, Heliyon, 2023, Volume 9, Issue 9, e20315. |
| [18] | Rashid, M. M. U., Rahman, M. M., Habib, Md. A., and Hasan. M. M. “Study and analysis of hybrid energy options for electricity study and analysis of hybrid energy options for electricity production in Rangpur” Asian Journal of Current Research, 2018, 3(1), 9-14. |
| [19] | Wnag, Y., Zou, R., Liu, F., Shang, L., Liu, Q. “A review of wind speed and wind power forecasting with deep neural networks,” Applied Energy, 2021, vol 304, 117766. |
| [20] | Hong, Y-Y., Rioflorido, C. L. P. P. “A hybrid deep learning-based neural network for 24-h ahead wind power forecasting,” Applied Energy, 2018, vol 250, pp. 530-539. |
| [21] | He, X., Nie, Y., Guo, H., and Wang, J., “Research on a Novel Combination System on the Basis of Deep Learning and Swarm Intelligence Optimization Algorithm for Wind Speed Forecasting,” IEEE Access, 2022, vol. 8, pp. 51482-51499. |
| [22] | Liu, H., and Chen, C., “Data processing strategies in wind energy forecasting models and applications: A comprehensive review,” Applied Energy, 2018, vol 249, pp. 392-408. |
| [23] | Habib, M. A., Kabir, K. M. A., and Tanimoto, J., “Evolutionary Game Analysis for Sustainable Environment Under Two Power Generation Systems,” Evergreen Joint Journal of Novel Carbon Resource Sciences & Green Asia Strategy, 2022, Vol. 09, Issue 02, pp. 323-341. |
| [24] | Habib, Md. A., “Game Theory, Electrical Power Market and Dilemmas,” Journal of Electrical Engineering, Electronics, Control and Computer Science -JEEECCS, 2022, vol. 8, pp. 33-42. |
| [25] | Habib, Md. A., “The application of asymmetric game in the electrical power market,” Journal of Electrical Engineering, Electronics, Control and Computer Science, 2022, Volume 9, Issue 31, pages 1-10. |
| [26] | Marugan, A. P., Marquez, F. P. G., Perez. J. M. P., RuizHernandez, D. “A survey of artificial neural network in wind energy systems,” Applied Energy, 2018, vol 228. pp. 1822-1836. |
| [27] | Islam, Md. S., Islam, F., Habib, Md. A., "Feasibility Analysis and Simulation of the Solar Photovoltaic Rooftop System Using PVsyst Software", International Journal of Education and Management Engineering, 2022, Vol. 12, No. 6, pp. 21-32. |
| [28] | Islam, M. S., Noman, N. A., and Habib, Md. A., “The Best Techno-economic Aspects of the Feasibility Study Concerning the Proposed PV-Wind-hydro Hybrid System in Nilphamari, Bangladesh,” International Journal of Education and Management Engineering, 2022, vol. 12, no. 5, pp. 24-37. |
| [29] | Ehteshami, S. M. M., Vignesh, S., Rasheed, R. K. A., and Chan, S. H. “Numerical investigations on ethanol electrolysis for production of pure hydrogen from renewable sources,” Applied Energy, 2018, vol. 170, pp. 388-393. |
| [30] | Noman, N. A., Islam, M. S., Habib, Md. A., and Debnath, S. K. “The Techno-Economic Feasibility Serves to Optimize the PV-Wind-Hydro Hybrid Power System at Tangail in Bangladesh”. International Journal of Education and Management Engineering (IJEME), 2022, 13(3), 19-32. |
| [31] | Rashid, M. M. U., Habib, Md. A., and Hasan, M. M., “Design and construction of the solar photovoltaic simulation system with the implementation of MPPT and boost converter using MATLAB/Simulink,” Asian Journal of Current Research, 2018, vol. 3, pp. 27-36. |
| [32] | Sinha, S. and Chandel, S. S. “Review of recent trends in optimization techniques for solar photovoltaic-wind based hybrid energy systems,” Renewable and Sustainable Energy Reviews, 2015, vol. 50, pp. 755-769. |
| [33] | Habib, Md. A., Tanaka, M. and Tanimoto, J. “How does conformity promote the enhancement of cooperation in the network reciprocity in spatial prisoner’s dilemma games?” Chaos, Solitons and Fractals, 2022, vol. 138, p. 109997. |
| [34] | Habib, Md. A., Kabir, K. M. A. and Tanimoto, J. “Do humans play according to the game theory when facing the social dilemma situation?” A survey study, Evergreen, 2022, vol. 7, no. 1, pp. 7-14. |
| [35] | Habib, Md. A., “Can People Detect Dilemma Strength in A 2 Player 2 Strategy Game?’: A Survey Game,” Proceeding of International Exchange and Innovation Conference on Engineering & Sciences (IEICES), 2018, vol. 5, pp. 116-117. |
| [36] | Yan, J., and Ouyang, T. “Advanced wind power prediction based on data-driven error correction,” Energy Conversion and Management, 2018, vol 180, pp. 302-311. |
| [37] | Wang, Y., HU, Q., Li, L., Foley, A. M., Srinivasan, D. “Approaches to wind power curve modeling: A review and discussion,” Renewable and Sustainable Energy Reviews, 2018, vol 116, 109422. |
| [38] | Tsai, W., Hong, C., Tu, C., Lin, W., and Chen, C., A Review of Modern Wind Power Generation Forecasting Technologies," Sustainability, 2023, vol 15, pp. 10757. |
| [39] | Zeng, X., Abdullah, N., Liang, B. “A widely applicable and robust Light GBM - Artificial neural network forecasting model for short-term wind power density,” Heliyon, 2023, vol 9, issue 12, e23071, pp. 1-16. |
| [40] | Lipu, M. S. H., Miah, M. S., Hannan, M. A., Hussain, A., Sarker, M. R., Ayob, A., Saad, M. H. Md., Mahmud, Md. S., “Artificial Intelligence Based Hybrid Forecasting Approaches for Wind Power Generation: Progress, Challenges and Prospects,” IEEE Access, 2021, vol. 9, pp. 102460-102489. |
| [41] | Hanifi, S., Liu, X., Lin, Z., Lotfian, S., “A Critical Review of Wind Power Forecasting Methods - Past, Present and Future,” Energies, 2020, vol 13, 3764. |
| [42] | Debnath, S. K., Alin, M. A., Badhan, I. A., and Habib, Md. A., Performance Investigation of Various Estimation Models for Received-Signal Strength and Link-Speed Predictions of the 802.11ac WLANs. I. J. Wireless and Microwave Technologies, 2025, 1, 18-39. |
| [43] | Habib, Md. A., and Asgar, Md. A., Analyzing Wind Speed Trends and Statistical Insights for Panchagarh District, Bangladesh. International Journal of Engineering and Computer Science. 2025, Volume 14 Issue 04, 27040-27052. |
| [44] | Habib, Md. A., Aurpa, T. T., and Habib, M. A., Holistic Assessment of Wind Speed Behavior and its Effects on Thimphu, Bhutan. Scope, 2025, Volume 15. |
| [45] | Hasan, M. M., and Habib, Md. A., Wind speed analysis and its implications for Muktagacha, Mymensingh, Bangladesh. Journal of Bangladesh Academy of Sciences. 2025, 49(1); 123-135. |
| [46] | Islam, F., Ahshan, R., and Habib, Md. A., Feasibility Analysis of Large-Scale Utility-connected Solar Power Generations in Bangladesh. 6th International Conference on Electrical Information and Communication Technology, 2023, 07-09, Khulna, Bangladesh. |
| [47] | Zhang, J., Yan, J., Infield, D., Liu, Y., Lien, F-S., “Short-term forecasting and uncertainty analysis of wind turbine power based on long short-term memory network and Gaussian mixture model,” Applied Energy, 2018, vol 241, pp. 229 - 244. |
| [48] | DU, P., Wang, J., Yang, W., Niu, T., “A novel hybrid model for short-term wind power forecasting,” Applied Soft Computing Journal, 2018, vol 80, pp. 93-106. |
| [49] | Yuan, X., Chen, C., Jiang, M., Yuan, Y., “Prediction interval of wind power using parameter optimized Beta distribution based LSTM model,” Applied Soft Computing Journal, 2019, vol 82, 105550. |
| [50] | Wang, J., Wang, S., Yang, W., “A novel non-linear combination system for short-term wind speed forecast,” Renewable Energy, 2018, vol 143, pp. 1172-1192. |
| [51] | Habib, M. A., Aurpa, T. T., Mahmud, T., Tahsin, N., Ashrafuzzaman, Md., Ferdous, J., Jemy, Md. A., and Habib, Md. A., “Impact of Net Metering on Hybrid Renewable Energy System Economics in Mymensingh, Bangladesh”. Scope, 2024 Volume 14, Number 03. |
| [52] | Habib, Md. A., Habib, M. A., Hossan, Md. S., Mahmud, T., Billah, Md. M., and Azad, Md. A. K., Viability of a Photovoltaic-Fuel Cell Hybrid Energy System for Sustainable Power Generation in Mymensingh, Bangladesh. Scope, 2024, Volume 14, Number 03. |
| [53] | Habib, Md. A., Kabir, Md. H., Mahmud, T., Billah, Md. M., Khan, R., Asgar, Md. A., Integrated Analysis of Wind Speed Dynamics and their Influence on Darjeeling, West Bengal, India. Scope, 2024, Volume 14 Number 04. |
| [54] | Rahman, Md. S., Ferdous, J., Aurpa, T. T., Haque, Md. M., Azad, Md. A. K., and Habib, Md. A., “Statistical Trends in Wind Speed for Khulna, Bangladesh: An Analytical Approach”. Journal of Scientific Reports, 2024, 7(1), 213-225. |
| [55] |
Climate and Average Weather Year Round in Fukuoka, Available from:
https://weatherspark.com/y/111709/Average-Weather-in-Fukuoka-Japan-Year-Round |
| [56] | Japan Meteorological Agency, Available from: |
| [57] | Boeker, E., and Grondelle, R. V., “Environmental Physics. Second edition.” John Wiley & SONS, LTD, 1999. |
| [58] | Ramirez, P., Carta, J. A., “Influence of the data sampling interval in the estimation of the parameters of the Weibull wind speed probability density distribution: a case study.” Energy Conversion and Management, 2005, 46, 2419-2438. |
| [59] | Celik, A. N., “A statistical analysis of wind power density based on the Weibull and Rayleigh models at the southern region of Turkey.” Renewable Energy, 2003, 29, 593-604. |
| [60] | Algifri, A. H., “Wind Energy Potential in Aden-Yemen,” Renewable Energy, 1998, Vol. 13, No. 2, pp. 255-260. |
APA Style
Rafat, A., Rahman, M. A., Ferdous, J., Rahman, M. S., Rahman, M. M., et al. (2025). Understanding Wind Speed Fluctuations and Their Effects on Wind Energy Development in Fukuoka, Kyushu, Japan. Journal of Energy and Natural Resources, 14(4), 118-129. https://doi.org/10.11648/j.jenr.20251404.11
ACS Style
Rafat, A.; Rahman, M. A.; Ferdous, J.; Rahman, M. S.; Rahman, M. M., et al. Understanding Wind Speed Fluctuations and Their Effects on Wind Energy Development in Fukuoka, Kyushu, Japan. J. Energy Nat. Resour. 2025, 14(4), 118-129. doi: 10.11648/j.jenr.20251404.11
@article{10.11648/j.jenr.20251404.11,
  author = {Al Rafat and Md. Atiqur Rahman and Jannatun Ferdous and Md. Sazedur Rahman and Md. Mostafijur Rahman and Md. Ahsan Habib},
  title = {Understanding Wind Speed Fluctuations and Their Effects on Wind Energy Development in Fukuoka, Kyushu, Japan},
  journal = {Journal of Energy and Natural Resources},
  volume = {14},
  number = {4},
  pages = {118-129},
  doi = {10.11648/j.jenr.20251404.11},
  url = {https://doi.org/10.11648/j.jenr.20251404.11},
  eprint = {https://article.sciencepublishinggroup.com/pdf/10.11648.j.jenr.20251404.11},
  abstract = {This research inspects characteristics of wind speed and corresponding wind power potential in the Fukuoka-shi, located in the Kyushu region of Japan, over the period from 2018 to 2022. By employing the comprehensive statistical approach, the study systematically evaluates time-series wind speed data in order to capture both seasonal variations and long-term trends. Probability density functions are derived to assess the distribution patterns of wind speeds, which serve as the foundation for the estimating the region’s wind energy potential. Two widely recognized statistical models, the Weibull distribution and the Rayleigh distribution, are applied to monthly wind speed data. These models offer reliable and practical tools for the characterizing wind behavior, allowing for the accurate assessment of frequency and intensity of the wind speeds relevant for power generation. The analysis emphasizes variability of wind conditions across different months, underlining how seasonal changes influence the availability of the wind resources. The results approve the suitability of the Weibull and Rayleigh models in predicting wind power potential with the reasonable precision. This research not only contributes valuable insights into the renewable energy prospects of Fukuoka-shi but also provides the evidence-based guidance for policymakers, energy investors, and other stakeholders. Ultimately, the findings highlight the strategic importance of wind energy in advancing the sustainable development and strengthening the region’s renewable energy portfolio.},
 year = {2025}
}
TY  - JOUR
T1  - Understanding Wind Speed Fluctuations and Their Effects on Wind Energy Development in Fukuoka, Kyushu, Japan
AU  - Al Rafat
AU  - Md. Atiqur Rahman
AU  - Jannatun Ferdous
AU  - Md. Sazedur Rahman
AU  - Md. Mostafijur Rahman
AU  - Md. Ahsan Habib
Y1  - 2025/10/14
PY  - 2025
N1  - https://doi.org/10.11648/j.jenr.20251404.11
DO  - 10.11648/j.jenr.20251404.11
T2  - Journal of Energy and Natural Resources
JF  - Journal of Energy and Natural Resources
JO  - Journal of Energy and Natural Resources
SP  - 118
EP  - 129
PB  - Science Publishing Group
SN  - 2330-7404
UR  - https://doi.org/10.11648/j.jenr.20251404.11
AB  - This research inspects characteristics of wind speed and corresponding wind power potential in the Fukuoka-shi, located in the Kyushu region of Japan, over the period from 2018 to 2022. By employing the comprehensive statistical approach, the study systematically evaluates time-series wind speed data in order to capture both seasonal variations and long-term trends. Probability density functions are derived to assess the distribution patterns of wind speeds, which serve as the foundation for the estimating the region’s wind energy potential. Two widely recognized statistical models, the Weibull distribution and the Rayleigh distribution, are applied to monthly wind speed data. These models offer reliable and practical tools for the characterizing wind behavior, allowing for the accurate assessment of frequency and intensity of the wind speeds relevant for power generation. The analysis emphasizes variability of wind conditions across different months, underlining how seasonal changes influence the availability of the wind resources. The results approve the suitability of the Weibull and Rayleigh models in predicting wind power potential with the reasonable precision. This research not only contributes valuable insights into the renewable energy prospects of Fukuoka-shi but also provides the evidence-based guidance for policymakers, energy investors, and other stakeholders. Ultimately, the findings highlight the strategic importance of wind energy in advancing the sustainable development and strengthening the region’s renewable energy portfolio.
VL  - 14
IS  - 4
ER  -
Department of Physics, Begum Rokeya University, Rangpur, Bangladesh
Department of Operations Research and Engineering Management, Southern Methodist University, Dallas, United States of America; Department of Mathematics, Comilla University, Cumilla, Bangladesh
Department of Electronics and Communication Engineering, Hajee Mohammad Danesh Science and Technology University, Dinajpur, Bangladesh
Department of Electrical and Electronic Engineering (EEE), Hajee Mohammad Danesh Science and Technology University, Dinajpur, Bangladesh
Department of Electrical and Electronic Engineering, Begum Rokeya University, Rangpur, Bangladesh
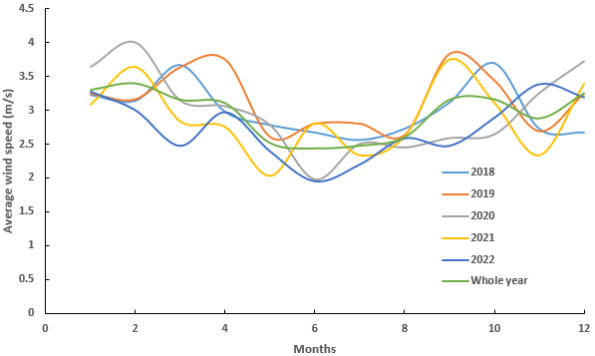
Figure 1. Fukuoka's monthly wind speed, 2018-2022.
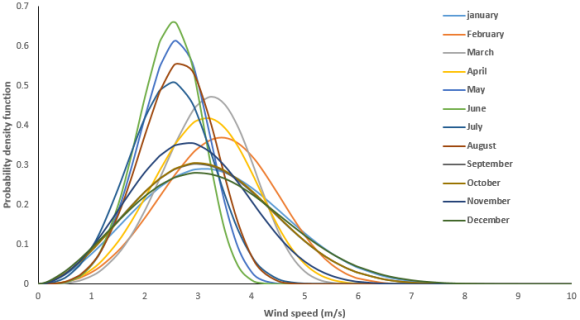
Figure 2. The monthly wind speed probability distributions obtained from the Fukuoka time series data.
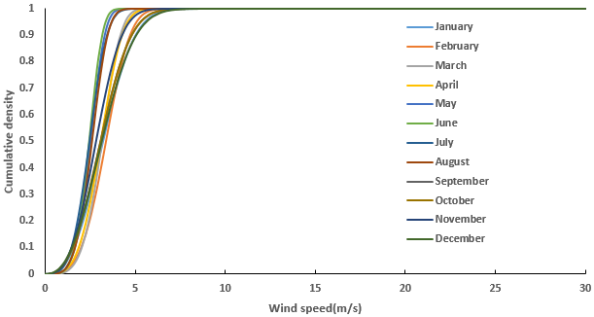
Figure 3. Representation of the annual cumulative probability distributions corresponds to monthly wind speeds, derived from Fukuoka data.
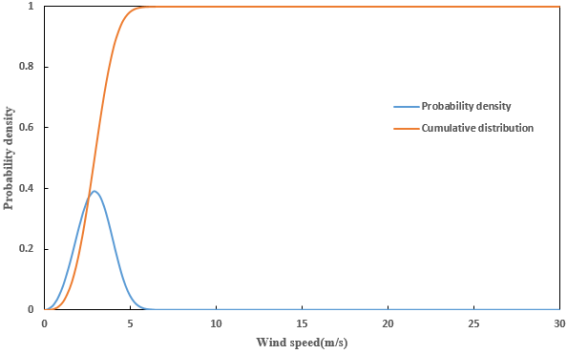
Figure 4. The wind speed probability density and cumulative distributions over the full year were computed using the data that Fukuoka had gathered.
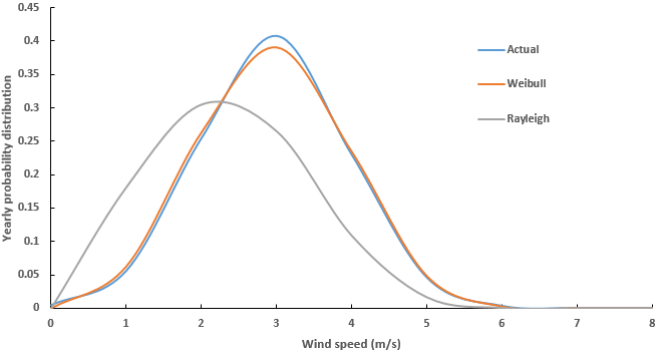
Figure 5. Weibull and Rayleigh estimates are compared to the observed wind speed distributions.
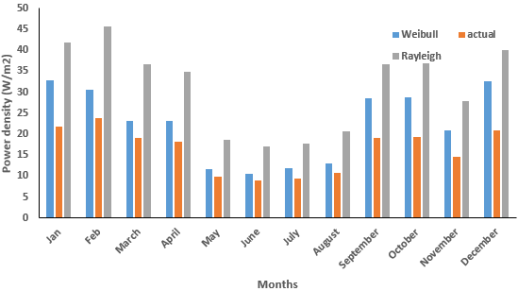
Figure 6. Actual data and densities computed using the Weibull and Rayleigh models are compared to determine the monthly wind power density.
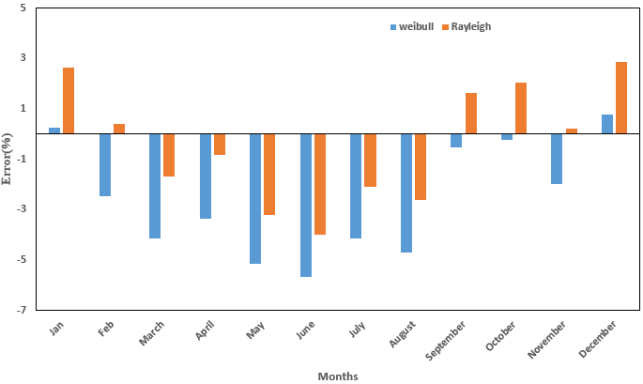
Figure 7. By calculating the differences between the power density estimations derived from the Weibull and Rayleigh models and the measured data, monthly errors of the wind power density are evaluated.
Information

