2. Materials and Methods
2.1. Collection of the Carbonaceous Materials
We bought two pairs of each of the finely sealed and fully charged battery packs of Maxell (D size, 1.5v each) and Eveready (D size, 1.5v each) C-Zn batteries from the daily groceries, and discharged a pair of both of them fully by consuming their power voltages heavily. The priory installed home gas geyser set was used to consume their full voltage storage, and the 0% SOC of the batteries was reconfirmed through the specific battery analyzer equipment available in the common electrical maintenance store. The same electrical analyzer tool was also used to ensure the SOCs = 100% of the remaining two pair batteries each of the same two manufacturers. After the complete inspections of the SOCs, we dismantled the metal casing of all the four battery pairs (first pair (Maxell): SOC = 100% (MC), second pair (Maxell): SOC = 0% (MD), third pair (Eveready): SOC = 100%, (EC), fourth pair (Eveready): SOC = 0% (ED)) of both of the manufacturers, and took out their black carbon rods explicitly as shown in
Figure 1.
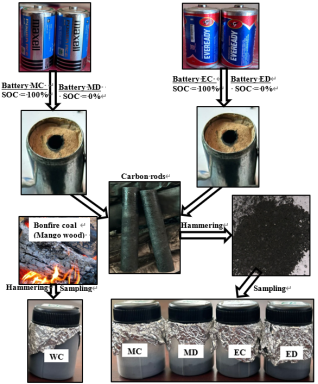
Figure 1. Flowchart describing the extraction steps of the carbon materials: (a) MC, MD, EC, and ED from the carbon rods of Maxell & Eveready batteries (SOCs = 0% and 100%), and (b) WC from the bonfire coal of matured mango wood.
The metal head hammers were used to smash all these carbon rods. Thus smashed four different types carbon grains were sampled into the separate polyethylene bottles stoppered with the aluminum foil layered air-tight stoppers, and named each of them respectively as MC, MD, EC, and ED. In the course of extracting the reference carbon grains from the mango tree based biomass precursor, we bonfired a plenty of its matured fibrous woods under the controlled outdoor fire conditions, and collected their few red-burn coals exclusively. Using the similar hammering technique, we smashed them into the the grainy carbon matrices and collected in a separate polyethylene bottle as we did for the battery carbon rods. For the analytical simplicity associated with the comparative metamorphic extents, and the cumulative effects of moderate range burn off temperatures on reconfiguring the sporadically arranged generic carbon layouts, we named this wooden coal precursor carbon sample as WC. The exact processing steps and the consequential flowcharts followed throughout these sampling procedures are outlined in
Figure 1. After the successful sample extractions and collections, the characteristic physiochemical properties of all the five carbon samples (MC, MD, EC, ED, and WC) were securely preserved, and ensured their worsening from the direct effects of the external heat & temperature factors, environmental moisture & humidity, internal mold & dampness, etc. While delivering them for the explicit XRD measurements, the entire morphological & external textures, and porosity & porous surfaces were finely preserved. The equal care was given to the every stoppered sample holders just to prevent them from any accidental breakages, spilling, and material intermixing.
2.2. Measurements of the XRD Diffractograms
Since the specific institution where the authors are affiliated with is not equipped with the X-Ray diffractometer needful for this microstructural characterization studies, all the MC-, MD-, EC-, ED-, and WC- sample holders (air-tight polyethylene made hard bottles) were delivered to Nepal Academy of Science and Technology (NAST); a Nepalese government funded institution established for advancing the research and development sectors nationwide. As per its operational guidelines and institutional policies, various instrumental facilities inclusive with the XRD spectroscopy are made available directly to the academic and industrial R & D sectors, and the prompt spectral measurements are offered as per the requirements of the customers. The XRD diffractometer owned by it, and used herewith for the diffraction patterns measurements of each carbon sample was BRUKER D2 PHASER; a bench-top diffractometer that florescences normally under the Copper X−rays. Prior to the spectral measurements that were carried out in the 2θ angular range of 10−90°, a step size of an angular increment 0.2°, and a material scanning rate of 0.5°/min, the diffractometer was finely calibrated and standardized as per the instructions outlined in the operational manual. The concerned raw XRD-datasets measured for each sample specimen were directly plotted as "XRD-diffractogram" for the subsequent spectral analyses and XRD profile assessments.
2.3. Determinations of the XRD Profile Descriptors
In the course of analyzing the XRD spectral patterns for the MC, MD, EC, ED, and WC, the most intense XRD band arousing at the specific diffraction angle (
) was firstly identified, and the required datasets (intensity vs
) were retrieved explicitly followed by their subsequent subjections into the
Gaussian convolutions for the precise peak fitting procedures. Prior to this, the standard
Gaussian convolutions were plotted in a three dimensional space using the programmatically created specific Cartesian coordinates, and the required manipulations were carried out as per the needs of the Microsoft Excel live-simulation peak fitting techniques. While the specific XRD band of the particular carbon material fits best to the normal
GAUSS function distribution, the concerned peak height (
), peak width (
), and full-width at half maximum (herewith, FWHM (
)) were determined explicitly. The particular
angles (where the spectral intensity is maximum) recorded for the every
Gaussian-fitted XRD band of every carbon sample (hereafter, CS) specimens were substituted in Eq. (
1) ((
) Bragg's law), and the intergraphene layer distance
d002-space (hereafter,
) existing in between any two graphene layers of them was determined.
Where;
= order of diffraction (by convention, a first order (n =1) diffraction was set for the XRD).
= wavelength of the incident Xray (1.54 Å (Cu Kα wavelength))
= angle of incidence ) (rad.)
And, the FWHM (
(
rad.) value computed for the MC, MD, EC, and ED sample specimens (except
d-space analyses, none of the XRD profile assessments were carried out to the WC sample as it is very much unlike to the carbon specimens derived from the C-Zn batteries) was used to estimate the specific crystallite size
via the Scherrer's mathematical formulation (Eq. (
2).
Where;
= Scherrer's constant.
The numeral value for the constant
was approximated using the relation shown in Eq. (
3); an especially recommended formula to those cases where the (a) FWHM is determined through the
Gaussian peak fitting technique alike to this work, and (b) material specimen is comprising with the spherical or quasi-spherical type particulates (almost all the carbon grains are the agglomerated form of the quasi-spherical type premiere particulates
| [12] | Donnet, J. B. Carbon black: Science and technology, 2nd ed.; CRC Press: New York Basel, 1993; pp. 67-69. |
[12]
)
| [13] | Langford, J. I., Wilson, J. C. Scherrer after sixty years: A survey and some new results in the determination of crystallite size. Journal of Applied Crystallography. 1978, 11, 102-113. https://doi.org/10.1107/S0021889878012844 |
[13].
0.9394(3)
Each specific value of the
and
determined for the MC, MD, EC, and ED sample specimens were directly substituted in Eq. (
4), and the number of each of their parallel interatomic graphitic planes (
) stacked one over the other periodically or sporadically were approximated.
2.4. Formulations of the XRD Profile Linked Mathematical Subordinates
While the real-time simulations (
Gaussian convolution fittings) of the most intense XRD spectral bands projected on the angular values; MC:
= 26.63⁰; MD:
= 26.43⁰; EC:
= 26.63⁰; and ED:
= 26.63⁰ were on the fly, the net Area (
) under the precisely-fitted spectral band of the every sample specimens was estimated separately
via the relation shown in Eq. (
5); a standard formula recommended for approximating the net Area under the typical
Gaussian peak
. Thus calculated
(mm
2) values for every carbon samples were substituted in Eq. (
6)
| [15] | Vlahov, A. XRD graphitization degrees: a review of the published data and new calculations, correlations, and applications. Geologica Balcanica. 2021, 50(1), 11-35. https://doi.org/10.52321/GeolBalc.50.1.11 |
[15]
, and the percentage crystallinity (
) for each of them was speculated.
(5)
(6)
Where;
= 200 mm
2; a standard area under the typical XRD peak for the graphite at
= 26.70⁰
| [15] | Vlahov, A. XRD graphitization degrees: a review of the published data and new calculations, correlations, and applications. Geologica Balcanica. 2021, 50(1), 11-35. https://doi.org/10.52321/GeolBalc.50.1.11 |
| [16] | Isa, N. X-ray amorphous pattern characterization of petronas petroleum coke product as a potential for advanced carbon-carbon composite material precursors. Bachelor of Engineering (Hons.), Universiti Teknologi PETRONAS, Peras, Malaysia, 2012. |
[15, 16]
.
Similarly, the degree of graphitization (%
) for each carbon sample was calculated using the relation shown in Eq. (
7); a standard formula proposed firstly by Seehra & Pavlovic, and modified lately by Ivashita
et al.
| [15] | Vlahov, A. XRD graphitization degrees: a review of the published data and new calculations, correlations, and applications. Geologica Balcanica. 2021, 50(1), 11-35. https://doi.org/10.52321/GeolBalc.50.1.11 |
[15]
.
(7)
Where;
= intergraphene layer distance of the particular carbon determined from Eq. (
1).
= intergraphene layer distance of the ultrapure graphite (
| [15] | Vlahov, A. XRD graphitization degrees: a review of the published data and new calculations, correlations, and applications. Geologica Balcanica. 2021, 50(1), 11-35. https://doi.org/10.52321/GeolBalc.50.1.11 |
| [16] | Isa, N. X-ray amorphous pattern characterization of petronas petroleum coke product as a potential for advanced carbon-carbon composite material precursors. Bachelor of Engineering (Hons.), Universiti Teknologi PETRONAS, Peras, Malaysia, 2012. |
[15, 16]
Again, the Vlahov and Wada
et al. derived mathematical formula (Eq. (
8)
| [15] | Vlahov, A. XRD graphitization degrees: a review of the published data and new calculations, correlations, and applications. Geologica Balcanica. 2021, 50(1), 11-35. https://doi.org/10.52321/GeolBalc.50.1.11 |
[15]
was employed to predict the metamorphic temperature (
)) acquired by the specific carbon sample
| [1] | Wada, H., Tomita, T., Matsuura, K., Iuchi, K., Ito, M., Morikiyo, T. Graphitization of carbonaceous matter during metamorphism with references to carbonate and pelitic rocks of contact and regional metamorphisms, Japan. Contributions to Mineralogy and Petrology. 1994, 118 (3), 217- 228. https://doi.org/10.1007/BF00306643 |
| [17] | Bouda, V., Chladek, J. Carbon Metamorphoses in a Medium with Varying Ionic Concentration. Materials Research Society Symposia Online Proceedings Library. 2000, 661(KK5), 17. https://doi.org/10.1557/PROC-661-KK5.17 |
[1, 17]
.
And, the Franklin's relations (Eq. (
9 and
10) were used to estimate the internal structural disorder (
) and degree of structural order (
) respectively.
Accordingly, the net BET adsorption surface area (
≈ (m
2/g)) possessed by every carbon samples was approximated by the relation shown in Eq. (
11).
Where;
,(anX-raydensityofcarbon)(12)
(g/cm
3), an X-ray density measured for the ultrapure graphite
| [18] | Howe, J. Y., Rawn, C. J., Jones, L. E., Ow, H. Improved crystallographic data for graphite. Powder Diffraction. 2003, 1(2), 150-154. https://doi.org/10.1154/1.1536926 |
[18]
.
Lastly, the mathematical relation shown in Eq. (
13) was used to determine the specific capacitance
(F/g) of all the carbon samples.
Where;
(F/cm
2); a typical literature value
| [19] | Deraman, M., Sazali, N. E. S., Hanappi, M. F. Y. M., Tajuddin, N. S. M., Hamdan, E., Suleman, M., Othman, M. A. R., Omar, R., Hashim, M. A., Basri, N. H., Nor, N. S. M., Dolah, B. N. M., Noor, A. M., Jasni M. R. M. Graphene/semicrystalline-carbon derived from amylose films for supercapacitor application. Journal of Physics: Conference Series. 2016, 739, 012085(1-7). https://doi.org/10.1088/1742-6596/739/1/012085 |
| [20] | Basri, N. H., Deraman, M., Daik, R., Ayob, M. T. M., Sahri, M. I., Nor, N. S. M., Dolah, B. N. M., Soltaninejad, S. Electrochemical impedance spectroscopy study of supercapacitors using deposited nickel oxide nanoparticles carbon monolith electrodes. Advanced Materials Research. 2015, 1112, 236-240. https://doi.org/10.4028/www.scientific.net/AMR.1112.236 |
[19, 20]
for the electrical double layer capacitance of the electrode-electrolyte interfacial regions.
3. Results and Discussions
3.1. Involvement of the Carbon-Rod in Electrochemical Functions
After the discovery of the C-Zn battery technology by following the fundamental electrochemical functions of the wet Leclanche cell in the late 18
th century, various types of it are being commercially famed out of which the heavy-duty or zinc-chloride batteries are one of the most common ones. The relatively higher concentration of the anolyte consisting of the purer ZnCl
2 paste with the MnO
2 and carbon powder actually makes such type batteries energetically potent with the high energy density storage, better energy efficiency even under the heavy discharge states, consistent power voltage outputs, significant low temperature credibility, and a relatively longer lifespan
| [21] | Jain, S. Advantages and Limitations of Zinc Carbon Batteries. Available online: https://www.azom.com/article.aspx?ArticleID=22363 (accessed on 5/2/2025). |
| [22] | Huot, J. Y. Chemistry, electrochemistry, and electrochemical applications: zinc. Encyclopedia of Electrochemical Power Sources. 2009, 883-892. https://doi.org/10.1016/B978-044452745-5.00061-7 |
| [23] | Le, P. A., Le, V. Q., Nguyen, N. T., Nguyen, V. T., Thanh, D. V., Phung, T. V. B. Multifunctional applications for waste zinc–carbon battery to synthesize carbon dots and symmetrical solid-state supercapacitors. RSC Advances. 2011, 12, 10608–10618. https://doi.org/10.1039/D2RA00978A |
[21-23]
. According to their electrochemical assembly and the entire cell set up architectures, the highly graphitized, greatly crystalline, and incredibly hierarchical porous carbons made carbon-rod having the recognizable electrolyte wettability and capturing potentialities plus the significant electrolyte ions adsorptions, intercalations, and diffusion kinematics is centrally encompassed by the ZnCl
2-MnO
2-Carbon paste demarcated by the paper separator (thickness ≤ 3.5 mm) with the external anodic zinc case whose two end terminals behave as the negative and positive poles. The zinc case alloying mostly with the corrosion resistant metals such as Cd, Mn, Pb, and other passive metal traces is most preferably used to pack all those electrochemical ingredients and cell integrities as these metals always vow to reduce the anodic dissolution (zinc corrosion) rate, and therewith proceeding electrolyte leakage problems & active electrolyte ions obstructions and deactivating propensities. In the electrochemical discharge processes, the zinc case (Anodic oxidation: Zn + 2Cl
- Zn
2+ + 2e
-;
) is oxidized due to the aggressive salt attack of the 2Cl
- ions diffused from the cathodic side (Cathodic reduction: 2MnO
2 + ZnCl
2 + H
2O + 2e
- Mn
2O
3 + Zn(OH)
2 + 2Cl
-;
), resulting an unidirectional flow of the electrons from the anodic side to cathodic side via the central carbon rod.
Since this battery can supply the power constantly until the electroactive materials are reacted away completely (net cell reaction: Zn + 2MnO
2 Mn
2O
3 + Zn(OH)
2), and none of its half-cell reactions can be reversed back by charging the battery pack again, the variable proportionality ratios of the charged, uncharged, and/or discharged chemical specimens adsorbed, captured, diffused, and intercalated into the porous carbon matrices of the carbon-rods are of disparate chemical identities and stabilities. Therefore, the central carbon rods and therewith extracted carbon materials are more prompt to offer the inequivalent functioning aptitudes when the batteries are in the 0% & 100% charged states. Additionally, the direct effects of the overintercalated ionic & molecular specimens, and the passivation layers developed as a result of the consequential operation stages (electrochemical reactions) make the C-rod carbon materials less conductive, and degrade their functionalizing qualifications progressively
| [24] | Liu, S., Zeng, X., Liu, D., Wang, S., Zhang, L., Zhao, R., Kang, F., Li, B. Understanding the Conductive Carbon Additive on Electrode/Electrolyte Interface: Formation in Lithium-Ion Batteries via in situ Scanning Electrochemical Microscopy. Frontiers in Chemistry. 2020, 8(114), 1-9. https://doi.org/10.3389/fchem.2020.00114 |
[24]
. Moreover, in the 0% SOC state, the cathodic reaction products Mn
2O
3 and Zn(OH)
2 released in the solid states in an aqueous environment constantly remain clogging outside the central carbon rods in their paste matrix with the unreactive MnO
2, their most probable physicochemical effects on the external textural morphology, internal graphitic interstitial sites & hexagonal carbon rings configurations, interior/exterior pores & porosity networks, etc. of the carbon matrices may lead this state to bear the dissimilar functioning qualifications and microstructural domains than that present originally in the SOC = 100% state. The same are few of the major reasons of triggering Le
et al. to study the recycling and reusing possibility of the carbon materials extracted from the waste C-Zn batteries
| [23] | Le, P. A., Le, V. Q., Nguyen, N. T., Nguyen, V. T., Thanh, D. V., Phung, T. V. B. Multifunctional applications for waste zinc–carbon battery to synthesize carbon dots and symmetrical solid-state supercapacitors. RSC Advances. 2011, 12, 10608–10618. https://doi.org/10.1039/D2RA00978A |
[23]
. They proclaimed that the waste C-Zn batteries would be the chief alternative carbon precursors for prototyping many other transformative yet advanced carbon derivatives such as carbon dots, hierarchical porous carbons & their customized pores derivatives, etc. In their report, the effective environment-friendly means of recycling waste C-Zn carbon materials are discussed thoroughly along with underscoring the exceptional electrochemical performances of thus recycled carbon materials while employing exclusively as electrode materials for the solid state supercapacitors: they achieved an energy density of 4.58 W h kg
-1 at a power density of 375 W kg
-1 and 97.6% retention after the rigorous 2000 recharge cycles. However, the explicit differentiations in the functionalizing aptness of the waste and non-waste battery-rod derived carbons, and the actual impacts of the disproportionally intercalated ionic/chemical specimens (at two different operational stages of the batteries) on altering their microstructural functioning qualities are not taken into the accounts seriously. Since the actual performances of the carbon materials and their functionalizing qualifications are directly dependable to the generic microstructural domains and external textural morphologies, the genuine assessments of the latter in the carbon materials extracted from the carbon rods of 0% and 100% charged states C-Zn battery packs obviously direct us the righteous pathways towards utilizing them in the diverse industrial arenas. In this study, we evaluate all the invaluable microstructural assets of such type carbons collected from the Maxell and Eveready produced C-Zn battery packs C-rods through the X-ray diffraction profiles means such as diffraction angle (
), intergraphene layer distance
d (basal spacing), crystallite sizes
Lc, and their closely interlinked mathematical subordinates, viz.%C, %DOG,
Tmet., structural disorder (
) & degree of structural order (
),
,
, &
, and deduce their recyclability & reusability extents, and many other variations in the microstructural domains & functional qualifications semiquantitatively.
3.2. XRD Profile Assessments
3.2.1. Feasibility of the XRD Spectral Analysis
The rational applications of the XRD spectroscopic method, spectral profiles, and the closely interlinked mathematical formulations in speculating versatile properties of the advanced functional materials are very obvious and ubiquitous. As per the X-ray crystallographic ideologies and the generic instrumental functions of the X-ray diffractometer, the diffraction profiles measured for the crystalline materials comprising with the disparate microstructural crystallite phases always become the frontline fingerprint applications. Interestingly, the wide range crystalline & semi-crystalline carbon cores and their granular structural C-C moieties comprising with the variably crosslinked & irregularly configured crystallite phases (graphitic) are directly aligned in the favor of the XRD specifications and quantifications potencies. Therefore, in the carbon research, this spectroscopic means are widely recognized as one the most predominant characterizing tools second only to the Raman spectroscopy. More than this, the extensively formulated mathematical empirical relationships & auxiliary subordinates, and incredibly theorized theoretical approaches
| [15] | Vlahov, A. XRD graphitization degrees: a review of the published data and new calculations, correlations, and applications. Geologica Balcanica. 2021, 50(1), 11-35. https://doi.org/10.52321/GeolBalc.50.1.11 |
| [16] | Isa, N. X-ray amorphous pattern characterization of petronas petroleum coke product as a potential for advanced carbon-carbon composite material precursors. Bachelor of Engineering (Hons.), Universiti Teknologi PETRONAS, Peras, Malaysia, 2012. |
| [19] | Deraman, M., Sazali, N. E. S., Hanappi, M. F. Y. M., Tajuddin, N. S. M., Hamdan, E., Suleman, M., Othman, M. A. R., Omar, R., Hashim, M. A., Basri, N. H., Nor, N. S. M., Dolah, B. N. M., Noor, A. M., Jasni M. R. M. Graphene/semicrystalline-carbon derived from amylose films for supercapacitor application. Journal of Physics: Conference Series. 2016, 739, 012085(1-7). https://doi.org/10.1088/1742-6596/739/1/012085 |
[15, 16, 19]
mainly for incorporating all the XRD derived profile assets of the carbon materials further intensify the applicative domains of this spectroscopic method. Present work employs the same instrumental techniques and therewith correlated mathematical formulations in studying the microstructural domains, and therein interlinked functional properties dependencies of the carbonaceous materials MC, MD, EC, and ED extracted from the carbon rods of the commercial C-Zn batteries in 0% & 100% charged states, and analyzes their solitary microstructural attributes with and without referring to the typical graphitic structures of the semigraphite, ultrapure graphite, and natural bonfire wooden coal WC.
3.2.2. XRD Spectral Analysis (Natural Wooden Coal WC)
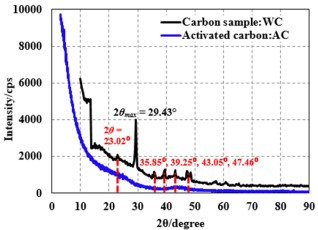
Figure 2. An X-ray diffraction spectra for the carbon sample WC extracted from the bonfire mango wooden coal. The diffraction diagram is compared with that of the activated carbon (AC, carbonization temperature Tcarb = 700-900°C).
As the presently sampled WC carbon is a biomass derived coal (ash fused) bonfired under the externally controlled intensive burning conditions open to the air, and is not subjected anymore into the laboratorial high temperature treatments (HTTs) and chemical activations processing, the optimum burn off temperature that gradually heats up its mass upon the aggressive bonfiring is usually expected as significantly higher (lower) than that reached to the household wood fire (graphitization). According to the general wooden coal production guidelines and the environmental carbon emission trends, the aggressively bonfired red hot coals are known to gain the maximum temperature scales of ≤ 1000°C into the regime of which they acquire progressive structural compactness, hardness, and brittleness
| [25] | Kolker, A., Engle, M., Stracher, G., Hower, J., Prakash, A., Radke, L., Schure, A., Heffern, E. Emissions from coal fires and their impact on the environment: U. S. Geological Survey, Fact Sheet 2009-3084. Available online: https://pubs.usgs.gov/fs/2009/3084/ |
[25]
. In reference to the carbonization temperature range (usually less than 1000°C), and the industrial activated charcoal (AC) heat up processes, the burn off temperature scale gained by the openly bonfired wooden coal is regarded as quite comparable despite being the former quite anaerobic but the latter is excessively aerobic. In order to take into account of the actual burn off temperature (≤ 1000°C/aerobic) effects on the internal carbon configurations of the natural biomasses and their actual microstructural transitions & transformations extents plus to deduce the relativity scales of the internal restructuring extents of the BSUs in respect to the industrially activated carbon materials, present authors plotted the XRD spectral patterns of the WC in
Figure 2 along with that measured for the MSC-30 brand (
Tcarb =700°C-900°C/anaerobic) activated charcoal (manufacturer/supplier: Toray Industries, Inc., Japan). Therein, the substantial variations in their spectral patterns and the inequalities in the specific diffraction angles between the primary and secondary XRD bands are observed clearly. Unlike AC, the WC sample has a sharp primary spectral band at 2
θmax = 29.43⁰, and few more additional secondary protrusions at 2
θ = 23.02⁰, 35.85⁰, 39.25⁰, 43.05⁰, and 47.46⁰. If the standard XRD databases measured for the diverse biomasses precursor carbonaceous materials are referred
| [26] | Nanda, S., Mohanty, P., Pant, K. K., Naik, S., Kozinski, J. A., Dalai, A. K. Characterization of North American Lignocellulosic Biomass and Biochars in Terms of their Candidacy for Alternate Renewable Fuels. Bioenergy Research. 2013, 6, 663–677. https://doi.org/10.1007/s12155-012-9281-4 |
[26]
, the smaller magnitude bands protruding at 2
θ = 39-48⁰, and ≤ 25⁰ specify the sporadical layouts of the BSUs with significant graphitic heterogeneity and structural disorderliness in the WC. However, no pronounced peak broadening effects in all of them signify that there is an existence of the fewer number density crystallite phases but with less significant periodicity and structural homogeneity. Another smaller height peak observed at 2
θ = 36⁰ is mostly due to the crystalline hemicellulose polysaccharides consisting of five-carbon and six-carbon sugar composites present originally in the WC precursor (mango wood), and the similar type low intensity peak at 2
θ = 23.02⁰ represents the polymorphs crystalline form of its cellulosic units. Among these diffraction peaks, the most intense one appeared at 2
θmax = 29.43⁰ (
d-space = 0.3031 nm (literature value: 0.3024 nm
| [26] | Nanda, S., Mohanty, P., Pant, K. K., Naik, S., Kozinski, J. A., Dalai, A. K. Characterization of North American Lignocellulosic Biomass and Biochars in Terms of their Candidacy for Alternate Renewable Fuels. Bioenergy Research. 2013, 6, 663–677. https://doi.org/10.1007/s12155-012-9281-4 |
[26]
); an angular value deviated quite far away from the typical semigraphite and graphite 2
θmax (26.70⁰) bands, exemplifies its minimal quantity
sp2 hybridized graphene hexagonal ring, instead justifies the excessive presence of the anhydrite (CaSO
4) and fairchildite (K
2Ca(CO
3)
2); the crystalline sulfate and carbonate minerals present incredibly into its ash fused matrices. Interestingly, the absolute absence of the diffraction peaks at the typical angular regions of the semigraphite and graphite; (a) 2
θ ≥ 51⁰; no notable graphitic characteristics do exist as the bonfire burn off temperature never exceeds the typical graphitizing temperature regimes (
Tgraph ≥ 2200°C), and (b) 2
θ ≤ 23⁰; no traces of the amorphous halo cellulosic forms are remained into the WC which, instead transformed fully into the microstructural domains with particular carbon configurations.
As a whole, all these spectral deductions guaranty that the WC sample we produced through the bonfire burning off of the matured mango woods underwent through the complete transformations stages of their building block amorphous cellulosic units into the somewhat better structured fibrillary carbon networks and graphitic phases. It means we can facilely proceed the more intensive structural transformations & transitions, and internal carbon layouts reconfiguring processes to the WC carbon derivatives by intensifying the several anaerobic complimentary conversions pathways such as carbonization, graphitization, metamorphoses, templating, catalytic inducing, etc. And, of course, they are regarded as quite frontier steps adopted industrially mainly for improvising the applicative microstructural domains of the natural biomasses derived carbon materials, and for promoting their generic functionalizing qualifications. Except these specific characterizations, structural transitions & transformations possibilities, and the prompt intensive metamorphic effects of the bonfire temperature regimes on modifying the internal arrangements of the original carbon layouts & their prompt restructurings, no additional assessments in regard to the quantitative estimation of the structure-dependent characteristic features such as
Lc, %
C, %
DOG,
Tmet., structural disorder (
)/order (
),
,
, and
are carried out to the WC. They are actually skipped herewith not only due to the considerable angular deviation of its 2
θmax band with that measured for the battery-carbons and semigraphite/graphite but also the limitations of employing the therewith associated XRD profiles, mathematical formulations, and many other auxiliary subordinates (the mathematical formulations given in Eq. (
5-12) mostly assume the conditions appropriate for the semigraphite like carbon materials
| [14] | Ghosh, S. N., Handoo, S. K. Infrared and Raman spectral studies in cement and concrete (review). Cement and Concrete Research. 1980, 10(6), 771-782. https://doi.org/10.1016/0008-8846(80)90005-8 |
| [15] | Vlahov, A. XRD graphitization degrees: a review of the published data and new calculations, correlations, and applications. Geologica Balcanica. 2021, 50(1), 11-35. https://doi.org/10.52321/GeolBalc.50.1.11 |
| [16] | Isa, N. X-ray amorphous pattern characterization of petronas petroleum coke product as a potential for advanced carbon-carbon composite material precursors. Bachelor of Engineering (Hons.), Universiti Teknologi PETRONAS, Peras, Malaysia, 2012. |
[14-16]
). These spectral variances and mathematical inappropriateness ensure us that the WC carbon has a poor microstructural qualities than that used for the diverse electrochemical systems, and hence, mostly unsuitable for designing the battery spares until and unless they are fully improvised and maximally graphitized. Hence, furthermore investigations are irrelevant to the present contexts.
3.2.3. Comparative XRD Spectral Analyses (Maxell vs Eveready Battery Carbons)
1) Distinctive SOCs Conditions
The XRD diffractograms for the MC and MD carbon samples shown in
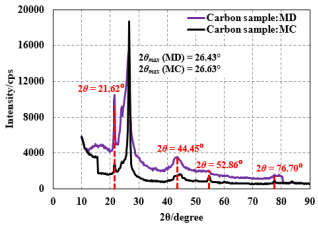
Figure 3 exhibit the multiple range diffraction bands at those diffraction angular regimes that are regarded as quite typical to the semigraphite and graphite materials. For example, the common spectral bands appeared after their 2
θmax angles (MD: 2
θmax = 26.43⁰, MC: 2
θmax = 26.63⁰,
Table 1)
at 2
θ = 44.45⁰, 52.86⁰, and 76.70⁰ deduce their relatively higher degree of graphitic crystallinity or the lower degree of amorphicity (the pure graphite materials always have these bands at 2
θ = 45.3⁰, 2
θ = 54.6⁰ and 2
θ = 77.70⁰ respectively). All these diffraction angular positions of the characteristic bands of the MD sample consistent to that of the MC and typical graphitic structure signify that the Maxell C-Zn batteries central carbon rods restore almost identical internal graphitic configurations and graphene layouts upon discharging them heavily to SOC = 0%. It further means both of the battery states SOC = 100% and SOC = 0% have such type carbon matrices in their conductive carbon rods that have almost identical structural homogeneity, graphitization degrees, crystallinity percentage, graphene layouts and periodicity; reinsuring us that the MD carbon sample exhibits as equal applicative morphological and electrochemical functional domains as MC. The supporting facts for this ideology are also strengthened by their reproducible 2
θmax bands standing at around 26.5⁰ diffraction angle; almost indistinguishable angular regime to that of the semigraphite and graphite (2
θmax = 26.70⁰): both MD and MC samples possess the recognizable number density of the weakly crosslinked yet highly parallel
sp2-C based graphene networks and internal graphitic units. However, the very much incomparable intensity band appeared at
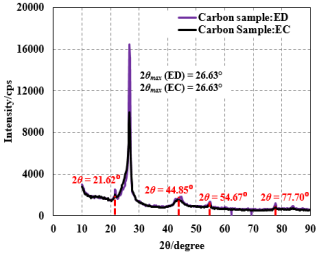
= 21.62⁰ upon nullifying the Maxell battery charges to 0% state signify the existence of the recognizable microstructural disparities in the MD carbon to that of the MC. It speculates that the discharged state carbon specimen MD must have relatively the lower extent crystallinity than that of the charged state carbon MC, but obviously not in the significant range. Hence, the MD carbon can be reemployed effectively both for the prototype carbon as well as electrochemical electrode materials. The explanations for the microstructural properties of the carbon sample specimens ED and EC extracted from the carbon rods of the Eveready batteries with SOCs = 0% and 100% respectively are, however relatively very much consistent and steady. Neither the characteristic diffraction bands & their 2
θ angles are deviated from those designated to the semigraphite and graphite nor their 2
θmax angles (both EC and ED have 2
θmax = 26.63⁰) themselves pronouncedly as indicated in
Figure 4. These spectral resemblances assure that the carbon extracted from the waste C-Zn Eveready battery rods (SOC = 0%) restore the original microstructural properties of the carbon present in SOC = 100% state very well, and hence can be employed for the diverse electrochemical applications. Saying this, the very much differentiable intensity heights of their 2
θmax bands stipulate the dissimilar magnitudes net integral area because of which they don't exhibit equal crystallinity degrees and many other functional domains plus applicative features (the related discussions are presented in subsections 3.3 and 3.4).
Table 1. The Bragg's law and Scherrer's formula derived crystallite profiles of the carbons extracted from the C-Zn battery rods of 0% and 100% charged states.
Carbon Samples | XRD-band (⁰) | Intergraphene layer distance dCS (nm) | Crystallite size Lc (nm) | No. of parallel graphitic planes (m) |
2θmax | θ |
MC | 26.63 | 13.31 | 0.3343 | 16.50 | 49 |
MD | 26.43 | 13.21 | 0.3368 | 6.01 | 18 |
EC | 26.63 | 13.31 | 0.3343 | 9.84 | 29 |
ED | 26.63 | 13.31 | 0.3343 | 14.17 | 42 |
Figure 3. An X-ray diffraction spectra for the carbon samples MD and MC extracted from the Maxell C-Zn batteries of SOCs = 0% and 100% respectively.
2) Identical SOCs Conditions
If the spectral patterns of the MC and EC carbon samples collected from the carbon rods of the dissimilar manufacturer Maxell and Eveready C-Zn batteries of SOCs = 100% are compared (
Figure 5), except the intensity heights of the concerned 2
θmax angular bands, no significant deviations in the remaining spectral patterns, primary and secondary band positions, peak acuteness, peak heights, 3D distribution trends & structural symmetry, etc. are observed more especially in the regions away from the 2
θmax. It ensures that both the carbon materials employed for designing the carbon rods of Maxell and Eveready batteries are of comparable quality. But, the relatively more intense band arousing at 2
θ = 21.62° for the MC carbon sample specify its slightly unequal internal graphitic crystallinity degree to that of the EC. According to the literature surveys
| [21] | Jain, S. Advantages and Limitations of Zinc Carbon Batteries. Available online: https://www.azom.com/article.aspx?ArticleID=22363 (accessed on 5/2/2025). |
| [22] | Huot, J. Y. Chemistry, electrochemistry, and electrochemical applications: zinc. Encyclopedia of Electrochemical Power Sources. 2009, 883-892. https://doi.org/10.1016/B978-044452745-5.00061-7 |
| [23] | Le, P. A., Le, V. Q., Nguyen, N. T., Nguyen, V. T., Thanh, D. V., Phung, T. V. B. Multifunctional applications for waste zinc–carbon battery to synthesize carbon dots and symmetrical solid-state supercapacitors. RSC Advances. 2011, 12, 10608–10618. https://doi.org/10.1039/D2RA00978A |
[21-23]
, the commercial C-Zn batteries are mostly manufactured using 'carbon blacks' carbons with
Tgraph ≥ 2000°C as the most potential carbon materials for designing their conductive carbon-rods and electrolyte paste matrices. The spectral analyses of the presently sampled dissimilar battery packs carbon materials also justify the same, and rank themselves as prescribed quality. Alike to this, the explanations for the XRD spectral patterns (
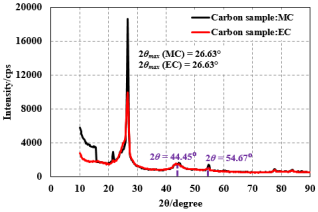
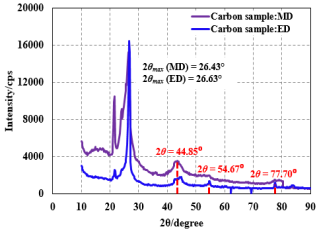
Figure 6) and diffraction angles associated with the carbon materials MD and ED extracted from the carbon rods of the Maxell and Eveready batteries of SOC = 0% respectively are also very much convincing and aligning to their fully charged states samples: the significant variations are basically observed only in the intensity heights and integral area under the specific spectral bands arousing at
= 21.62°; illuminating that the MD & ED samples have slightly varied microstructural compositions and morphological attributes because of which they may offer disparate functional properties and applicative aptitudes but for the good industrial causes.
Figure 4. An X-ray diffraction spectra for the carbon samples ED and EC extracted from the Eveready C-Zn batteries of SOCs = 0% and 100% respectively.
Figure 5. Comparison of the XRD patterns of the carbon materials extracted from the carbon rods of the Maxell and Eveready C-Zn battery each with the SOC = 100%.
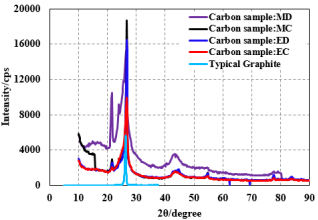
In a similar way, if the spectral patterns of all the four carbon samples MD, MC, ED, and EC are compared as a whole (
Figure 7), the deviations only in the intensity heights cum integral area under the particular bands appeared at 2
θ = 21.62° and 2
θmax = 26.5° are observed. This disparate profile only makes these carbon materials slightly dissimilar in quality to each other with variable functionalizing qualifications and microstructure-dependent physicochemical features. The most important conclusion retrieved from these spectral analyses is the discharged states of the carbon rods and their carbon matrices of both battery manufacturers have restored the internal microstructural functional domains that were acquired originally in their 100% charged states, and so are the structural attributes and functionalizing versatilities. It further elucidates that the carbon materials extracted from the carbon rods of the heavily discharged C-Zn batteries are promisingly reusable and recyclable, and hence can be certainly reemployed in multidimensional industrial functions. These microstructural aspects and the closely linked functional domains plus the internal graphitic configurations and layouts of the carbon materials extracted from the carbon rods (SOC = 0% and 100%) of two dissimilar manufacturers are also guaranteed by their reproducible 2θ
max diffraction angle to that of the ultrapure graphite (the selected diffraction datasets of the graphite peripheral to its most intense XRD band protruded at 2θmax = 26.7⁰ is appended in the same figure (
Figure 7) for the comparison purpose): the XRD bands of them arousing at 2θ
max ≈ 26⁰ always vows to their significant level sp
2 carbons and the resulting graphene hexagonal rings & layouts. All the underlying structure-dependent descriptors deterministic to their generic functional domains, and therewith correlated functional properties are presented in subsections 3.3 and 3.4.
Figure 6. Comparison of the XRD patterns of the carbon materials extracted from the carbon rods of the Maxell and Eveready C-Zn battery each with the SOC = 0%.
Figure 7. Comparison of the XRD patterns of the carbon materials extracted from the carbon rods of the Maxell and Eveready C-Zn battery (SOCs = 0% and 100%). The diffraction datasets for the most intense XRD band (2θmax = 26.7⁰) of the graphite are also plotted for illustrative interpretations.
3.2.4. Comparative XRD Profile Analyses (Maxell vs Eveready Battery Carbons)
Besides those XRD spectral based semigraphite resembling microstructural insights into the MC, MD, EC, and ED carbon matrices, and their 2
θmax angular positions diffracted by the particular crystallite phases, the XRD profiles determined from the mathematical equations Eqs. (
1-4) are equally regarded as quite valuable assets in order to speculate their exclusive functional domains and internal structures of the BSUs.
1) Interlayer Distance (d-space)
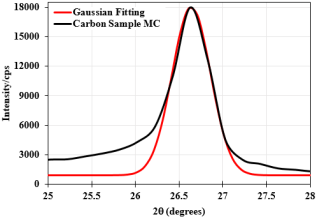
Figure 8. An illustrative example showing the best fit between the Gaussian convolution and the 2θmax XRD-band of the carbon material MC. The magnitudes for the peak height () cum intensity (I), and peak width () ()for every similar type bands of the MD, EC, and ED carbon samples are determined accordingly.
The Bragg's Law derived interlayer distance (
d-space) usually measures the packing proportions of the graphene layers and therein available intermittent sites precisely. In principle, lower the
d-space
value, more is the internal graphitic planes packing ratio, and less is the space available into the intermittent graphitic positions. And, the carbons possessing the
d-space
values nearer to that of the graphite are always regarded as semigraphite type advanced functional materials holding the optimum number density graphitic phases and graphene plane layers in a parallel fashion. The
d-space
values (nm) calculated for the MC (
d = 0.3343 nm), MD (
d = 0.3368 nm), EC (
d = 0.3343 nm), and ED (
d = 0.3343 nm) carbon specimens are tabulated in
Table 1. Interestingly, all these
d-space magnitudes are found to be very much comparable yet reproducible to each other as well with the
d-space value reported for the ultrapure graphite (
= 0.33354 nm)
| [15] | Vlahov, A. XRD graphitization degrees: a review of the published data and new calculations, correlations, and applications. Geologica Balcanica. 2021, 50(1), 11-35. https://doi.org/10.52321/GeolBalc.50.1.11 |
| [18] | Howe, J. Y., Rawn, C. J., Jones, L. E., Ow, H. Improved crystallographic data for graphite. Powder Diffraction. 2003, 1(2), 150-154. https://doi.org/10.1154/1.1536926 |
[15, 18]
. These datasets further justify that the internal graphene planes and graphitic phases present in all the four carbon samples are aligned as far apart as that of the graphite; verifying that the crosslinked Van der Waals force that bind these parallel graphene planes is of as equal strength as in graphite. This is very important evidence to reclaim here that the microstructural domains and the BSUs' layouts in the present carbon materials extracted from the waste C-Zn batteries of Maxell and Eveready are quite promising, and can be functionalized promptly and/or transformed into other far better carbon derivatives as per the industrial needs alike to that practicing for many other semigraphite and biomass derived carbon materials.
2) Crystallite Size (Lc)
This measureable observable derived from the Scherrer's formula (Eq. (
2) directly visualizes the natures of the internally aligned graphitic phases and graphene planes plus the binding-strengths of the crosslinking forces involved in making their layouts compact and parallel. In general, the larger
Lc always envisions the better crystallite phases and higher structural compactness making the carbon materials structurally closer to the semigraphite: better internal graphitic orders of the
sp2 hexagonal carbon rings lead to the recognizable crystallite sizes & growths kinetics. Therefore, the microstructural configurations of the MC (
Lc = 16.50 nm), MD (
Lc = 6.01 nm), EC (
Lc = 9.84 nm), and ED (
Lc = 14.17 nm) (
Table 1) carbon samples predicted through their own crystallite sizes & growths are obviously far better but of different types. Even though the
d-space
values (nm) computed for them are of comparable scales (
Table 1), these unequal crystallite sizes
Lc among the carbon samples of the charged and discharged Maxell and Eveready batteries are because of the dissimilar FWHMs (
β) of their respective 2
θmax spectral bands: the smaller magnitude width
β always leads to the bigger crystallite sizes
Lc owing to have the better graphitic phases integrities and assemblies internally. In this work, the
β value for the concerned 2
θmax spectral band of every carbon samples was approximated through the
GAUSS function peak fitting procedure; a sample diagram illustrating the best-fit between the 2
θmax band and the
Gaussian convolution is shown in
Figure 8, the
Lc values computed throughout this work are practically quite relevant. By referring to them explicitly, it can be said that the discharged state Maxell battery carbon rod based carbon MD contains the parallel graphitic planes having less facile abilities of undergoing kinematic rearrangements resulting a poor crystallite growth rate than that present in the carbon MC extracted from the fully charged Maxell battery carbon rods. But, the exactly vice-versa trend is observed for the Eveready battery carbon rods derived EC and ED samples. Nevertheless, none of their
Lc values are found to be worse than that estimated for the wide range carbon blacks and biomass derived highly functional yet semigraphite resembling materials (
Lc ≤ 15 nm
and
Lc = 18.5 nm for
the porous carbons with
Tgraph ≤ 2500°C and graphene oxide GO nanocomposite respectively
| [27] | Marahatta, A. B. XRD Studies on Metamorphic Changes of the Dissimilarly Graphitized Carbonaceous Materials. Asian Journal of Applied Chemistry. 2024, 15(4), 194-215. https://doi.org/10.9734/ajacr/2024/v15i4306 |
| [28] | Idisi, D. O., Ahia, C. C., Meye, E. L., Bodunri, J. O., Benecha, E. M. Graphene oxide: Fe2O3 nanocomposites for photodetector applications: experimental and ab initio density functional theory study. RSC Advances. 2023, 13, 6038–6050. https://doi.org/10.1039/D3RA00174A |
[27, 28]
,
Lc = 6.6 nm-17.2 nm for the anthracite carbon derivatives
| [29] | Gonz´alez, D., Altin, O., Eser, S., Garcia, A. B. Temperature-programmed oxidation studies of carbon materials prepared from anthracites by high temperature treatment. Material Chemistry and Physics. 2007, 101(1), 137-141. https://doi.org/10.1016/j.matchemphys.2006.03.001 |
[29]
); further strengthening that the carbon materials extracted from the waste C-Zn batteries have structurally better graphitic compositions and graphene layouts in their granular cores that can be reemployed, recycled, retreated, and retransformed promptly alike to many other freshly produced carbon materials.
3) Number of Parallel Graphene Layers (m)
The next great deal of evidences to verify the quality of the present waste battery derived carbon materials are abstracted from the
m value (Eq. (
4); a numeral descriptor that quantifies the actual number density of the weakly crosslinked parallel graphene layers held into the particular crystallite phases of the carbon matrices. The calculated values of it for each individual MC, MD, EC, and ED carbon samples are listed in
Table 1; MC:
m = 49, MD:
m = 18, EC:
m = 29, and ED:
m = 42; reconfirming that the carbon materials having the bigger crystallite sizes
Lc bear the better ordered and higher number density graphene layers. If these specific numeral values of the graphene layers present in the particular crystallite phases of the carbon materials are compared to that determined for the multilayer graphene (
m ≥ 5/flake), and bulk graphite (
m > 10 /flake)
| [30] | Kumar, V., Kumar, A., Lee, D. J., Park, S. S. Estimation of Number of Graphene Layers Using Different Methods: A Focused Review. Material. 2021, 14(4590), 1-22. https://doi.org/10.3390/ma14164590 |
[30]
, all of them are comprising with the significant number density of the graphene layers interlocked parallel to each other. These disproportional number density graphene layers amongst the charged and discharged states carbon materials eventually depict that the slight restructuring and reconfiguring of the BSUs layouts do take place while discharging the C-Zn batteries heavily from their original fully charged states, and the extents of this restructuring rely completely on the actual metamorphic regimes of the carbon cores used originally in designing the C-rods of the batteries. But, the actual structural integrities and robustness in them are still as consistent as many other prevalent prototype carbon materials. Inclusive to these structural consequences, the additional impacts on their microstructure-dependent attributes more particularly caused by the overintercalated ions, passivation layer, cell-reaction products released during heavy discharging, peripherally encompassed and externally adsorbed electrolyte-paste matrices, etc. are explained quantitatively in subsections 3.3 and 3.4.
3.3. Assessments of Microstructural Functional Domains
3.3.1. Percentage Crystallinity (%C)
The net integral area (Eq. (
5) under the concerned 2
θmax band of all the four carbon samples MD, MC, ED, and EC approximated through the best-fitting technique with the
GAUSS distribution function is inversely proportional to the %
C; a descriptor that measures the extent by which the internal graphitic phases of all type carbon materials tend to undergo facile restructurings and retransformations into the more better functional domains. This indicator is also very much useful to identify; (a) in what range the internal heterogeneous layouts of their BSUs exhibit structural modifications ability into the better systematic and homogeneous entities, and (b) how rigorous heat treatments and physicochemical activations are required for converting their sporadical graphitic layouts into the more systematic and periodic patterns
| [16] | Isa, N. X-ray amorphous pattern characterization of petronas petroleum coke product as a potential for advanced carbon-carbon composite material precursors. Bachelor of Engineering (Hons.), Universiti Teknologi PETRONAS, Peras, Malaysia, 2012. |
[16]
. The %
Cs calculated for all the four carbon samples (Eq. (
6) are summarized in
Table 2, wherein the dissimilar yet comparable magnitudes of them are clearly observed upon heavy discharging of the C-Zn batteries from their original 100% charged states. In the cases for Maxell batteries in SOC = 100% (MC (%
C = 2.08%)) and SOC = 0% (MD (%
C = 0.96%)) states, the percentage crystallinity of the carbon materials is lowered by more than two times upon discharging the battery pack completely. It means the MD carbon needs the relatively more soft and indulgent transformations and conversions criteria than the MC; suggesting that the passivation layers, overintercalated chemical species, and the cell-reaction products released progressively as a result of the heavy-discharged reactions affect the internal graphitic structural cores and C-configurations to the considerable range. However, the observations for the Eveready battery derived carbon materials in SOC = 100% and 0% states are more steady and alike to each other: carbon samples EC with %
C = 2.5%, and ED with %
C = 2.1% illuminate that the internal graphitic compositions and the structural layouts in them are not so much changed upon heavy-discharging of the battery packs. More particularly, the ED carbon requires as aggressive conversions criteria as EC & MC; underlining that no heavy discharged reaction products released in the Eveready battery packs alter the C-rods carbons usability and applicability pronouncedly, and hence the ED carbon can be recycled straightforward with very preliminary laboratorial treatments only. Nonetheless, if the %
Cs values calculated for the wide range carbon black materials graphitized under
Tgraph ≥ 2000°C are referred
, none of the %
Cs approximated for the present waste and non-waste Maxell and Eveready C-Zn batteries derived carbon materials are worse. Instead, they all lie in between the range speculated for the carbon black materials graphitized under 2500°C (%
C = 1.5%) ≤
Tgraph ≥ 2000°C (%
C = 5.1%) temperature regimes. It deduces that the waste battery derived carbon materials can be reutilized as the successive carbon precursors for the efficient phase transformations followed by the substantial creations of the advanced hierarchical porous carbon derivatives alike to many other fresh carbons. Similarly, if the %
C = 12.6% estimated for the pet coke (petroleum refinery) material is referred
| [16] | Isa, N. X-ray amorphous pattern characterization of petronas petroleum coke product as a potential for advanced carbon-carbon composite material precursors. Bachelor of Engineering (Hons.), Universiti Teknologi PETRONAS, Peras, Malaysia, 2012. |
[16]
, all the currently extracted carbon materials need very less rigorous graphitic phases restructurings and transformations criteria than that required for the pet coke. It again proclaims that much more attentions are to be given to the waste battery derived carbon materials even more than the petroleum refinery products as they showcase far better structural versatility and internal phase transitions & transformations promptness generously.
Table 2. The calculated values of crystallinity (%C) and graphitization degrees (%DOG) of the carbons extracted from the C-Zn battery rods of 0% and 100% charged states. carbon samples extracted from the carbon battery rods of dissimilar charge states.
Carbon Samples | Area under the 2θmax band (mm2) | Crystallinity (C) (%) | Degree of Graphitization (DOG) (%) | Metamorphic Temp. (Tmet) (°C) |
MC | 9427.06 | 2.078 | 99.77 | 599.26 |
MD | 20693.81 | 0.957 | 99.02 | 596.86 |
EC | 7684.89 | 2.536 | 99.75 | 599.20 |
ED | 9605.72 | 2.039 | 99.77 | 599.26 |
3.3.2. Degrees of Graphitization (%DOGs)
Alike to the %
C, the %
DOG is equally regarded as a quite significant descriptor in order to represent the internal graphitization degrees and the quantitative extents by which the sporadical graphene layouts are restructured into the semigraphite & graphite like configurations and periodicities. The quantitative values of it approximates how closely the internally aligned and reconfigured graphitic phases held into the carbon cores are resembled to that existing in the semigraphite and graphite
| [15] | Vlahov, A. XRD graphitization degrees: a review of the published data and new calculations, correlations, and applications. Geologica Balcanica. 2021, 50(1), 11-35. https://doi.org/10.52321/GeolBalc.50.1.11 |
[15]
. The %
DOGs (Eq. (
7) calculated for the present MC, MD, EC, and ED carbon materials derived from the Maxell and Eveready batteries of 100% and 0% charged states are summarized in
Table 2, wherein none of them are found to exhibit the percentage graphitization extents less than 99%. The relatively ultrahigh %
DOGs of the carbon materials extracted from the carbon-rods of fully charged batteries (MC and EC samples) are very obvious as the highly graphitized carbon materials are preferably used industrially in designing the battery parts and spares whose heat treatment scales are mostly in the range ≤ 2500°C, but the %
DOGs restored in the carbon materials extracted from the heavily discharged waste batteries guaranty their incredible recycling & reemploying qualities and promising electrochemical workability & battery functionality. If these graphitization percentages are referred to that determined for the wide range carbon samples, none of the %
DOGs are found to be in the lower range: carbon black
Tgraph ≥ 2000°C (%
DOG ≥ 96%), meta-anthracite (%
DOG = 70%), semi-graphites (%
DOGs = 70%-81%), graphite (%
DOGs = 81% - 100%), etc.
| [15] | Vlahov, A. XRD graphitization degrees: a review of the published data and new calculations, correlations, and applications. Geologica Balcanica. 2021, 50(1), 11-35. https://doi.org/10.52321/GeolBalc.50.1.11 |
| [27] | Marahatta, A. B. XRD Studies on Metamorphic Changes of the Dissimilarly Graphitized Carbonaceous Materials. Asian Journal of Applied Chemistry. 2024, 15(4), 194-215. https://doi.org/10.9734/ajacr/2024/v15i4306 |
[15, 27]
. It implicates that the substantially reshuffled (
i.e. 99%) graphitic phases holding carbon materials are employed in designing both the Maxell and Eveready batteries carbon rods, and almost the same microstructural domains & internal graphitic compositions are retained into their carbons upon heavy discharging. Again, in respect to the %
DOG = 95% determined for the petroleum coke materials
| [16] | Isa, N. X-ray amorphous pattern characterization of petronas petroleum coke product as a potential for advanced carbon-carbon composite material precursors. Bachelor of Engineering (Hons.), Universiti Teknologi PETRONAS, Peras, Malaysia, 2012. |
[16]
, and that speculated for the diverse carbon materials approaching structurally to the semi-graphite and graphite (%
DOGs = 70%-98%)
| [15] | Vlahov, A. XRD graphitization degrees: a review of the published data and new calculations, correlations, and applications. Geologica Balcanica. 2021, 50(1), 11-35. https://doi.org/10.52321/GeolBalc.50.1.11 |
[15]
, none of the waste batteries based carbon materials are found to be of low quality. Instead, they hold remarkable graphitic patterns and C-configurations internally, and can pledge for the prompt structural modifications abilities that are, in fact regarded as the quite essential features required for advancing the applicative microstructural domains of the carbonaceous materials
| [23] | Le, P. A., Le, V. Q., Nguyen, N. T., Nguyen, V. T., Thanh, D. V., Phung, T. V. B. Multifunctional applications for waste zinc–carbon battery to synthesize carbon dots and symmetrical solid-state supercapacitors. RSC Advances. 2011, 12, 10608–10618. https://doi.org/10.1039/D2RA00978A |
[23]
. Retrospectively, the extremely high %
DOGs always explicate the substantially lower range yet ultrapure graphites resembling
d-spaces existing in between any two of their intermittent graphene planes. And, the more closer the
d-space values of the carbon materials to that of the graphitic materials, the far better are their %
DOGs, which in turn lead them to bear the better microstructural homogeneities and graphitic layouts crosslinked to each other through the weaker Van der Waals binding forces. Based on these perspectives as well, the presently extracted carbon-rods based carbon materials of the waste C-Zn batteries are reclaimed to possess the genuine microstructural domains indispensable for prompt industrial/laboratorial reemployments and reutilizations as prototype carbons alike to many other natural and non-natural C-masses derivatives.
3.3.3. Degree of Metamorphoses
This is an indicator responsible for theorizing the actual metamorphic effects and the internal metamorphoses levels of the carbon materials caused primarily by the progressive metamorphic heat treatment and internal kinetic temperature (
Tmet) regimes. In fact, the
Tmet always vows to quantify the exact effects of the graphitization on internal shifting of the core C-atomic positions in the graphene layers upon increasing the internal kinetic energy. Generally, higher the %
DOGs, greater is the internal metamorphic temperature regime,
and hence, more is the degree of the metamorphoses and thereafter acquired metamorphic effects. The
Tmet estimated for the presently extracted Maxell and Eveready batteries based carbon materials MC (
Tmet = 599°C), MD (
Tmet = 597°C), EC (
Tmet = 599°C), and ED (
Tmet = 599°C) are listed in the
Table 2, wherein all the metamorphic temperature scales are in a quite comparable range. Actually, the
Tmet ≥ 588°C of the carbonaceous materials is usually regarded as that level internal kinetic energy regime which causes an optimum metamorphic changes in them inclusive with the extravagant reordering, restructuring, reconfiguring, reshuffling of the BSUs, and the aggressive swapping of the C atoms to each other
| [15] | Vlahov, A. XRD graphitization degrees: a review of the published data and new calculations, correlations, and applications. Geologica Balcanica. 2021, 50(1), 11-35. https://doi.org/10.52321/GeolBalc.50.1.11 |
[15]
. In the view point of this, the
Tmet scales approximated for the present waste and non-waste battery based carbon materials are quite comparable, and have good strengths for causing the intensive metamorphoses; justifying that no pronounced degradations of the basic microstructural domains and the entire BSUs configurations plus more severe internal metamorphoses are taken place into the granular core carbons of the C-rods while discharging the battery packs heavily. Instead, the original restructuring patterns of the graphene planes and the graphitic layouts are well restored in their heavy discharged states. However, the internally gained heat energy and kinetic energy governed granular stresses and strains plus the overall internal particulates pressure confinements in the charged and discharged C-rods carbon samples might be in the different scales which may lead them to offer the slightly unequal applicative microstructural domains and inequitable morphological attributes. If the relationship between the
d-space and the
Tmet is interlinked to the metamorphic effects and the internal metamorphic temperature regimes acquired by the present carbon samples, the
d-space values (
Table 1) affixing any two of their intermittent graphene planes are very much reasonable and justifiable. Practically, every increase in the
Tmet by 24°C always squeezes the
d-space value by around 0.0001nm, and the pronounced contractions of the basal graphene planes start to occur when the
Tmet crosses 400°C
| [15] | Vlahov, A. XRD graphitization degrees: a review of the published data and new calculations, correlations, and applications. Geologica Balcanica. 2021, 50(1), 11-35. https://doi.org/10.52321/GeolBalc.50.1.11 |
[15]
. Based on these evidences, the internal metamorphic temperatures speculated more especially for the SOC = 0% states carbon materials (MD, & ED), and therewith associated basal graphene plane contraction regimes plus their XRD derived
d-space values are quite reasonable. Hence, they can be functionalized facilely alike to the semigraphite type carbon materials. In conclusion, the microstructural domains, internal graphitic phase departures, and the overall restructuring extents predicted retrospectively from the
Tmet ranges acquired by the internal particulate grains of the waste battery carbon materials are aligned fully to those theorized from the %
Cs
(subsection 3.3.1), %
DOGs (subsection 3.3.2), and XRD profile descriptors (subsection 3.2.4).
3.3.4. Degree of Structural Disorder/Order
The actual structural disorders
(orders
) that measure the internal graphitic phase heterogeneities (homogeneities) in the wide rage carbonaceous materials are usually determined from the Franklin's relations mentioned in Eqs. 9a and 9b. These observables directly showcase the %
DOGs of the carbon materials, and speculate the range by which the granular structural domains of them are differed to that of the amorphous and/or semicrystalline carbon materials. The explicit quantitative scales determined for the MC (
= 0.731,
= 0.268), MD (
= 0.412,
= 0.587), EC (
= 0.731,
= 0.268), and ED (
= 0.731,
= 0.268) carbon materials are presented in the
Table 3. The lower magnitudes of the
always ratify their lower extents graphitic disorders, and the higher magnitudes of the
often ensure their greater structural orderliness. Based on this analytical matrix, the carbon sample MC is noted to have relatively more (less) degrees of the graphitic disorderliness (orderliness) than the MD; speculating that the discharged states and the associated cell reactions (anodic and cathodic), ionic and molecular specimens intercalated into the porous structures of the carbon rod plus the electrochemically inactive chemical pastes deposited around it and therein developed passivation layers may involve in reconfiguring the internal arrangements of the graphitic units to the fewer extents. However, the exactly equal degrees of the structural disorderliness and orderliness observed among the Eveready batteries derived EC and ED samples elucidate the null effects of the cell-reactions and subsequent discharging reactions products. If the literature values determined for the wide range carbon materials are referred: meta-anthracite
= 0.45; semigraphites
= 0.46-0.57; carbon blacks (T
graph ≥2500°C)
= 0.40-0.62; graphites
= 0.58-1.0
| [15] | Vlahov, A. XRD graphitization degrees: a review of the published data and new calculations, correlations, and applications. Geologica Balcanica. 2021, 50(1), 11-35. https://doi.org/10.52321/GeolBalc.50.1.11 |
| [27] | Marahatta, A. B. XRD Studies on Metamorphic Changes of the Dissimilarly Graphitized Carbonaceous Materials. Asian Journal of Applied Chemistry. 2024, 15(4), 194-215. https://doi.org/10.9734/ajacr/2024/v15i4306 |
[15, 27]
, all the present carbon samples exhibit comparatively lower (higher) extent structural orderliness (disorderliness) than either of them. It depicts that the internal graphitic phases present in the both waste and non-waste battery rods carbon matrices experience the greater degrees of the granular stresses and strains causing them to rearrange more sporadically in their crystalline lattice. This structural non-periodicity and disorderliness, however, can be restructured and reordered facilely via the various structural modifications and phase transformation strategies. Nevertheless, none of the
values determined for the present carbon samples are found to be greater than the unity, instead approaching closer to it; signifying that either of them has a very much comparable interlayer distance
-space to that of the fully ordered ultrapure graphite (the exact correlation between them is formulated in Eq. (
9)). This explanation eventually reconfirms that the waste battery derived carbon materials do have a satisfactory structural compactness and good packing ratio of the graphene planes arranged somewhat in the parallel architectures alike to that in the semigraphitic and graphitic structures. This structural integrity obviously featured out that the waste battery carbon-rods carbons would be the better alternative prototype materials for advancing the applicative microstructural domains genuinely.
Table 3. The calculated values of X-ray density, BET surface area, & specific capacitance of the carbons extracted from the C-Zn battery rods of 0% and 100% charged states.
Carbon Samples | Degree of | X-ray density () (g/cm3) | BET surface area ( ≈ ) (m2/g) | Specific capacitance (F/g) |
structural disorder (ρ) | structural order (u) |
MC | 0.731 | 0.268 | 2.2593 | 53.644 | 6.019 |
MD | 0.412 | 0.587 | 2.2426 | 148.246 | 16.634 |
EC | 0.731 | 0.268 | 2.2593 | 89.984 | 10.096 |
ED | 0.731 | 0.268 | 2.2593 | 62.469 | 7.009 |
3.4. Assessments of Structure-Dependent Functional Properties
3.4.1. BET Surface Area
Though the BET adsorption capacities of the carbon materials are experimentally measurable observables, and are subjected to change as per the adsorbate-adsorbent chemical affinities, nonbonding and bonding chemical interaction propensities, and many other closely associated unimolecular and/or multimolecular layer adsorption proneness, the mathematically approximated BET surface area (
SBET (m
2/g)) (Eq. (
10) enables us to quantify the exact availability of the adsorbing sites and the overall morphological textures of the entire carbon matrices. The quantitative scale of it always depicts the physical conditions of the carbon materials such as exterior/interior structures, porosity, pores networks, edge & basal plane ratio, graphitic edge terraces & heterogeneities, and many other microstructural features consociated with the specific surface area. And, the same characteristic features ultimately become the highly valuable structural assets towards functionalizing the carbon materials in the multidisciplinary applicative arenas such as electrodes and electrolyte pastes, electrocatalysts and electroactive motifs, electrolyte wetting and diffusive materials, ultrafiltration and microfiltration, effective energy storage and conversion, prominent CO
2 capture, etc. The
SBET values calculated for the MC, MD, EC, and ED carbon materials extracted from the Maxell and Eveready batteries of 0% and 100% charged states are listed out in the
Table 3. Among the Maxell batteries carbon samples (MC (
SBET = 54 m
2/g), and MD (
SBET = 149 m
2/g)), the
SBET is found to be increased almost by three times upon discharging the battery pack heavily, but among the Eveready batteries carbon samples (EC (
SBET = 90 m
2/g) and ED (
SBET = 62 m
2/g)), the
SBET is found to be decreased by about 28 m
2/g while doing the same. The reasons explaining these irregularities in the
SBET values among the almost same quality carbon materials, but contaminated with the disproportional electrolyte specimens unequally are not straightforward, however they make us very much clear that these carbon materials do have the disparate specific surface areas and textural morphologies upon changing the states of the charges heavily. We can just hypothesize that the predominant roles of the original electrolyte paste matrices, progressive cell-reaction products & thereby released inactive electrochemical motifs lying around the central carbon rods, and the natures of the passivation layers developed in the course of heavy discharging processes of the batteries do exist significantly in altering the textures of the exterior and/or interior walls surfaces and blocking their porosity networks. Present authors are unable to further trace out their aftermaths and the resulting repercussions due to the shortage of high resolution surface imaging techniques and the related electron microscopies.
Nevertheless, if the literature
SBET values reported for the diverse carbon materials are referred
| [31] | Llauradó, C. High Surface area Graphite. Ch. 3.8. pp. 115-124. Available online: https://www.tdx.cat/bitstream/handle/10803/8595/22.pdf?sequence=26&isAllowed=y (accessed on 5/2/ 2025). |
| [32] | Ajay, K. M., Dinesh, M. N. Influence of various Activated Carbon based Electrode Materials in the Performance of Super Capacitor. IOP Conference Series: Material Science and Engineering. 2018, 310, 012083. https://doi.org/10.1088/1757-899X/310/1/012083 |
| [33] | Shornikova, O. N., Kogan, E. V., Sorokina, N. E., Avdeev, V. V. The Specific Surface Area and Porous Structure of Graphite Materials. Russian Journal of Physical Chemistry A. 2009, 83(6), 1022–1025. https://doi.org/10.1134/S0036024409060260 |
| [34] | South Star Battery Metals: Product Information Bulletin. Available online: https://www.southstarbatterymetals.com/products/ (accessed on 5/2/2025). |
| [35] | 1-point BET measurement for carbon black by BELCAT: Application note. Available online: chromeextension://efaidnbmnnnibpcajpcglclefindmkaj/ https://www.microtrac.com/files/4549/single-point-bet-measurement-of-carbon-black-via-belcat.pdf |
[31-35]
, none of them determined for the present carbon samples of both-states batteries of both manufacturers are worse: (a) high specific surface area graphite with slit shaped pores
has
SBET = 103 m
2/g
; (b) graphite powder has
SBET = 150 m
2/g
| [32] | Ajay, K. M., Dinesh, M. N. Influence of various Activated Carbon based Electrode Materials in the Performance of Super Capacitor. IOP Conference Series: Material Science and Engineering. 2018, 310, 012083. https://doi.org/10.1088/1757-899X/310/1/012083 |
[32]
; (c) exfoliated graphite and graphite foil has
SBET = 90 m
2/g
| [33] | Shornikova, O. N., Kogan, E. V., Sorokina, N. E., Avdeev, V. V. The Specific Surface Area and Porous Structure of Graphite Materials. Russian Journal of Physical Chemistry A. 2009, 83(6), 1022–1025. https://doi.org/10.1134/S0036024409060260 |
[33]
; (d) natural flake crystalline graphite extracted from the Santa Cruz Graphite mine, Brazil has
SBET <10 m
2/g
; (e) BELCAT carbon black has
SBET = 72.7 m
2/g
; (f) dissimilar regimes expanded graphites have
SBET = 45 m
2/g & 90 m
2/g
| [33] | Shornikova, O. N., Kogan, E. V., Sorokina, N. E., Avdeev, V. V. The Specific Surface Area and Porous Structure of Graphite Materials. Russian Journal of Physical Chemistry A. 2009, 83(6), 1022–1025. https://doi.org/10.1134/S0036024409060260 |
[33]
. We believe that the effective adsorption area of each of the present carbon samples is in a considerable range that can further be maximized substantially alike to others not only by the rigorous powdering methods such as high energy ball-milling, exfoliations, etc. but also via the sequential hydrothermal treatment, templating methods, catalytic activations, and many other heat and chemical oxidative techniques
| [23] | Le, P. A., Le, V. Q., Nguyen, N. T., Nguyen, V. T., Thanh, D. V., Phung, T. V. B. Multifunctional applications for waste zinc–carbon battery to synthesize carbon dots and symmetrical solid-state supercapacitors. RSC Advances. 2011, 12, 10608–10618. https://doi.org/10.1039/D2RA00978A |
| [36] | Li, H. Q., Wang, Y. G., Wang, C. X., Xia, Y. Y. A competitive candidate material for aqueous supercapacitors: High surface-area graphite. Journal of Power Sources. 2008, 185(2), 1557-1562. https://doi.org/10.1016/j.jpowsour.2008.08.079 |
[23, 36]
. The versatile implications underlying with all these significant range adsorption areas of the present carbon materials, and therewith associated structural & morphological imputes of them make us to forecast their multiple microstructural accredits and therein enrooted functional domains: the waste C-Zn battery derived carbon materials do have the significant level pores & porosity networks, graphitic edges, terraces, and heterogeneities, edge & basal planes, surface roughness & granular irregularities, interior/exterior pores distributions, unequal sizes pores entrances, shapes, & pore volumes, and non-periodic hierarchies among the pores, etc. Therefore, they satisfy almost all the prerequisites required to become the most potential precursor materials, and hence can be transformed facilely into the more advanced carbon materials and reemployed feasibly for the diverse electrochemical functions alike to many other freshly produced carbon derivatives.
3.4.2. Specific Capacitance (CSP)
Specific capacitance (
CSP (F/g)) (Eq. (
12) is an electrochemical parameter that shows a direct mathematical relation with the
SBET (m
2/g), and depicts the physical structures & porous networks of the carbon materials semiquantitatively by means of which they offer the exceptional adsorbing capacities and promising electrolyte wetting & transportations pathways. It specifically notifies these structural features by quantifying the net amount of the charge stored per unit mass of them while employing as electrode and electrolyte paste materials for the diverse electrochemical assemblies. In general, greater is the specific surface area cum
SBET of them, higher is the charge storing capacity cum
CSP. The calculated values of the
CSP for the MC, MD, EC, and ED carbon materials extracted from the Maxell and Eveready batteries of 0% and 100% charged states are summarized in the
Table 3. Among the Maxell battery samples, the MD (
CSP = 17 F/g) exhibits almost 2.5 folds higher specific capacitance than the MC (
CSP = 6
F/g) whereas among the Eveready battery samples, the EC (
CSP = 10
F/g) carbon shows almost 1.4 times greater affinity than the ED (
CSP = 7 F/g). This result indicates that the specific capacitance of the carbon materials are the direct functions of the net amount of the voltages stored by the battery packs originally in their fully charged states, and the impacts of the discharge reactions products on their granular structures and surficial textures. Ideologically, if the hierarchical porous structures & pore networks of the carbon matrices of the central conductive carbon rods are blocked by the excessively diffused and therein intercalated electrolyte specimens, and thereafter proceeding electrochemical & surficial phenomena, the electrolyte wetting & capturing surface area, diffusion & transportation pathways, etc. they can offer to the conductive electrochemical specimens will be pronouncedly lowered. If so, the net quantity of the charges that the per unit mass of the carbon materials can store will be declined for sure. The same could be the most probable reasons of getting the disparate
CSP (F/g) values for the Maxell and Eveready batteries based carbon materials in their absolutely charged and discharged states. Comparatively, the
CSP values determined for them, and therewith forecasted pore structures irregularities, hierarchical porosity diversities, and the overall surficial & granular textures allow us to rank their electrochemical applications in the order MD > EC > ED > MC despite not following the same trends in respect to their microstructural functionalizing domains. Point to be noted herewith that this decreasing serviceability order among the four carbon samples is subjected to change considerably upon their successive recycling, refreshing, and retreating structurally. Nevertheless, if their
CSP values are compared explicitly with that reported for the wide range carbon materials: (a) graphite powder;
CSP = 16.1
F/g
| [32] | Ajay, K. M., Dinesh, M. N. Influence of various Activated Carbon based Electrode Materials in the Performance of Super Capacitor. IOP Conference Series: Material Science and Engineering. 2018, 310, 012083. https://doi.org/10.1088/1757-899X/310/1/012083 |
[32]
; (b) expandable graphites EG1 and EG2 have
CSP = 5
F/g and 10
F/g
| [33] | Shornikova, O. N., Kogan, E. V., Sorokina, N. E., Avdeev, V. V. The Specific Surface Area and Porous Structure of Graphite Materials. Russian Journal of Physical Chemistry A. 2009, 83(6), 1022–1025. https://doi.org/10.1134/S0036024409060260 |
[33]
respectively; (c) colloidal graphite has
CSP = 20-22
F/g
, the amounts of the charges stored by the unit mass of them are very much consistent. It further reconfirms that none of the waste battery carbon specimens are worse than many other highly graphitic carbon derivatives not only due to showcasing the recognizable capacity of storing electric charges effectively but also pledging for the greatest possibilities of improvising the surficial features deterministic to the optimum
SBET value. These promising features eventually claim that the waste C-Zn batteries produced carbon materials are microstructurally transformable, and electrochemically reusable types. Hence, much more industrial and laboratorial attentions must be given to them in the days to come so that the natural C-masses can be sustained greatly, and the environmental hazards caused by the direct disposals of the waste batteries are mitigated substantially.