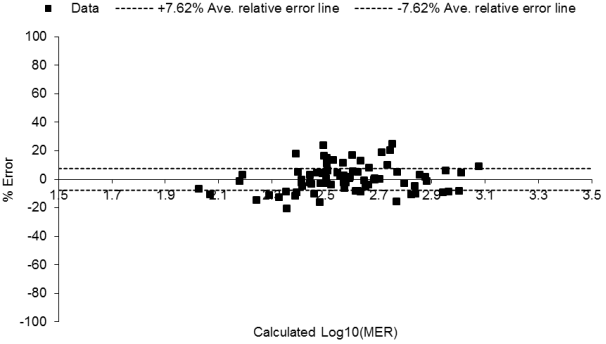
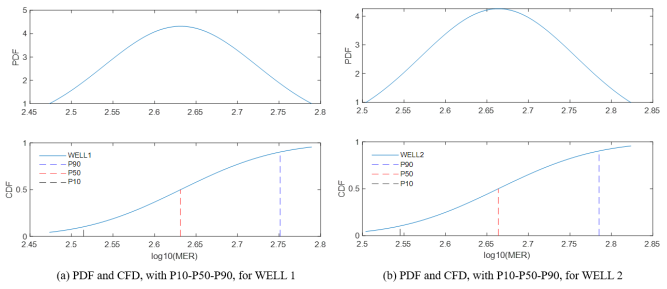
Maximum efficient rate (MER) and erosional velocity are known to be vital concepts in oil and gas production, and producing a well at a maximum efficient rate remains a critical concern to the oil and gas operators, the production engineer and the regulator. Well testing and equilibrium concept are commonly used by oil and gas players to determine the MER of a well. However, little adjustment of the plot axes of the production rate, choke size and tubing head pressure can affect the accuracy of the MER determination. Additionally, there are no known generalized correlations to compare results with that of the MER tests. Furthermore, oil regulatory bodies in Nigeria have no known published models for estimating the technical allowable rate, unlike other regulatory bodies in other countries. This work therefore presents the outcomes of the formulation of MER and the improved erosional velocity-based correlations for vertical oil wells, using MER test data from the Niger Delta region of Nigeria. Multiple linear regression (MLR) and probabilistic modeling approaches were considered. The predicted normalized MER results compared favorably well with the MER test data, with an absolute average error of 7.62%. For the case examples, de-normalization of the predicted MER results increases the absolute average error. Among the predicted P10, P50 and P90 MER results, the predicted P10 results are the nearest to the MER test results. Improvement in the predicted probabilistic results depends on the mean value of the predicted normalized MER considered. The combination of the MER model and the improved erosional velocity-based correlation can be a useful tool for MER test results verification and determination, and in overall for optimization of oil wells.
| Published in | Petroleum Science and Engineering (Volume 9, Issue 1) |
| DOI | 10.11648/j.pse.20250901.12 |
| Page(s) | 13-21 |
| Creative Commons |
This is an Open Access article, distributed under the terms of the Creative Commons Attribution 4.0 International License (http://creativecommons.org/licenses/by/4.0/), which permits unrestricted use, distribution and reproduction in any medium or format, provided the original work is properly cited. |
| Copyright |
Copyright © The Author(s), 2025. Published by Science Publishing Group |
Technical Allowable Rate, Well Optimization, Optimum Production Rate, Production System Models, Erosional Velocity
Well type, geometry, artificial lift and strings | Tubing size (inch) | Tubing head pressure (psig) | Choke size (64th of an inch) | MER | GOR | Oil API | BSW (%) |
|---|---|---|---|---|---|---|---|
Natural flowing and Gas Lift | 2.375 - 4.5 | 108 - 3721 | 101 - 64 | 101 - 1850 | 57 - 27279 | 13.48 - 55.37 | 0.10 - 84 |
|
|
|
|
|
|---|---|---|---|---|
-0.012230978 | 0.410467617 | 0.317466263 | -0.00452942 | -0.92030048 |
WELL | MER, bopd | % ERROR | |
|---|---|---|---|
1 | 210 | 428 | -103.81 |
2 | 290 | 461 | -58.9655 |
3 | 180 | 320 | -77.7778 |
4 | 370 | 319 | 13.78378 |
5 | 464 | 484 | -4.31034 |
6 | 224.8 | 294 | -30.7829 |
7 | 450 | 212 | 52.83648 |
8 | 188.5 | 248 | -31.565 |
9 | 421 | 243 | 42.21165 |
10 | 536 | 297 | 44.58955 |
WELL | MER (bopd) (Test data) | Calculated X, log10 (MER) | MER (P10) | MER (P50) | MER (P90) | % ERROR (P10) | % ERROR (P50) | % ERROR (P90) | |
|---|---|---|---|---|---|---|---|---|---|
1 | 210 | 2.6314 | 327.0393 | 427.9569 | 564.157 | 428 | 55.73 | 103.79 | 168.65 |
2 | 290 | 2.6637 | 351.0751 | 460.999 | 609.8177 | 461 | 21.06 | 58.97 | 110.28 |
3 | 180 | 2.5051 | 247.6852 | 319.9632 | 416.198 | 320 | 37.60 | 77.76 | 131.22 |
4 | 370 | 2.5038 | 246.9449 | 319.0068 | 414.954 | 319 | -33.26 | -13.78 | 12.15 |
5 | 464 | 2.6848 | 367.7901 | 483.9494 | 641.5049 | 484 | -20.73 | 4.30 | 38.26 |
6 | 224.8 | 2.4683 | 228.1918 | 293.968 | 380.9781 | 294 | 1.51 | 30.77 | 69.47 |
7 | 450 | 2.3263 | 167.1091 | 211.9825 | 270.645 | 212 | -62.86 | -52.89 | -39.86 |
8 | 188.5 | 2.3944 | 194.1333 | 247.9705 | 318.86 | 248 | 2.99 | 31.55 | 69.16 |
9 | 421 | 2.3856 | 190.4145 | 242.9965 | 312.1764 | 243 | -54.77 | -42.28 | -25.85 |
10 | 536 | 2.4727 | 327.0393 | 427.9569 | 564.157 | 297 | 55.73 | 103.79 | 168.65 |
MER | Maximum Efficient Rate |
MLR | Multiple Linear Regression |
API | American Petroleum Institute |
THP | Tubing Head Pressure |
| Empirical Constant in Erosional Velocity Model |
| Erosional Velocity |
ID | Tubing Internal Diameter |
| Maximum Permissible Rate |
| Area Factor |
| Thickness Factor |
| Porosity Factor |
FSw | Interstitial Water Factor |
| Recovery Multiplier |
| Length in Metres of the Productive Portion of the Horizontal Wellbore of a Horizontal Well |
| Gas-Oil Ratio |
| Basic Sediment & Water |
| Choke Size |
Probability Density Function | |
CDF | Cumulative Distribution Function |
MATLAB® | Matrix Laboratory |
P10 | 10th Percentile |
P50 | 50th Percentile |
P90 | 90th Percentile |
| [1] | Cardoso Filho, C., and Orazem, M. E. (2001). Application of a Submerged Impinging Jet to Investigate the Influence of Temperature, dissolved CO2, and Fluid Velocity on Corrosion of Pipeline Grade Steel in Brine, CORROSION 2001, paper 01058. Paper No: C2001-01058, pp. 1-19; |
| [2] | Papavinasam, S., and Revie, R. W. (2004). Review of Testing Methods and Standards for oilfield corrosion inhibitor., Proceedings of EUROCORR 2004, Nice, paper 10. |
| [3] | Madani, S. F., Huizingab, S., Esaklul K. A., Nesic, S. (2019) Review of the API RP 14 Erosional Velocity Equation: Origin, Applications, Misuses, Limitations and Alternatives. Wear 426-427 (Part A): 620-636. |
| [4] | Shirazi, S., McLaury, B., Shadley, J., and Rybiki, E., (1995). Generalization of API TP 14E Guideline for Erosive Services. Journal of Petroleum Technology -J PETROL TECHNOL. 47: 693-698. |
| [5] | Ariana, M. A., Esmaeilzadeh F. and Mowla, D. (2018). Beyond the Limitations of API RP-14E Erosional Velocity A Field Study for Gas Condensate Wells Phys. Chem. Res., Vol. 6, No. 1, 193-207, |
| [6] | American Petroleum Institute, (1984). Recommended Practice (1984) Design and Installation of Offshore Production Platform Piping Systems, API Recommended Practice 14E (RP 14E), Fourth Edition. |
| [7] | Livinus, A. and Ukpong, S. E. (2023). How Oil and Gas Companies can derive C-Factors in the API RP 14E Erosional Velocity Models for their ‘Clean Service’ Pipelines. Pet Petro Chem Eng J 2023, 7(4): 000364. |
| [8] | Zangl, G., Hermann, R., Schweiger, C., (2014). Comparison of methods for stochastic multiphase flow rate estimation. In: Paper SPE 170866 MS Presented at the SPE Annual Technical Conference and Exhibition Held in Amsterdam. The Netherlands, 27 – 29 October 2014. |
| [9] | Savage W. K., Thachuk A. R., Hassan Beykpour and Lohrenz J. H., (1974). MER: Ultimate Recovery and Production Rate, SPE 4933 presented at the Rocky Mountain Regional Meeting of the Society of Petroleum Engineers of AIME, to be held in Billings, Mont., May 15-16, 1974. |
| [10] | Dan A. Bruce, (1976). Maximum Efficiency Rate – Its Use and Misuse in Production Regulation. Journal Article in Natural Resources Lawyer, Vol. 9, No. 3 (1976), pp 442. |
| [11] | Rebecca A. Gallun, (2001). Fundamentals of Oil and Gas Accounting. Chapter 1, pp 24, 2001. |
| [12] | Meyer H. I., Garder A. O. (1954) Mechanics of two immiscible fluids in porous media. J Appl Phys 25: 1400–1406. |
| [13] | Chierici GL, Ciucci GM, Pizzi G (1964) A systematic study of gas and water coning by potentiometric models. J Pet Technol 16: 923 929. |
| [14] | Høyland LA, Papatzacos P, Skjaeveland SM (1989) Critical rate for water coning: correlation and analytical solution. Society of Petro leum Engineers, London. |
| [15] | Menouar HK, Hakim AA (1995) Water coning and critical rates in vertical and horizontal wells. Society of Petroleum Engineers, London. |
| [16] | Zhang L, Zhao Y, Liu Z (2011) A novel steady-state productivity equa tion for horizontal wells in bottom water drive gas reservoirs. Petrol Sci 8: 63–69. |
| [17] | Tabatabaei M, Ghalambor A, Guo B (2012) An analytical solution for water coning in vertical wells. Society of Petroleum Engineers, London. |
| [18] | Obe, E., Davis, R., Reynolds, K., Ibrahim, J., Oragwu, A., Chukwu, F. & Inegbenose, A. (2011). Optimum Rate Estimation Guide in Mature Water-Prone Reservoirs. SPE 150792, the Nigeria Annual International Conference and Exhibition held in Abuja, Nigeria, 2011. |
| [19] | Aleruchi, W. M., Obinna, E., Sonny, T., (2019) Resolving Early time well performance rate issues using MER test data. NAPE Bulletin, V. 28 No. 2 (Nov. 2019), P. 84-88. |
| [20] | Sukubo I. and Obi P. (2018). A New Approach to Maximum Efficiency Rate Estimation in the Niger Delta. SPE-193491-MS, Nigeria Annual International Conference and Exhibition held in Lagos, Nigeria, 6–8 August 2018. |
| [21] | Georgeson, V. U., Wumi, I., Ajienka, J. A. (2019). A New Framework for the National Petroleum Production Capacity Determination. International Journal of Scientific and Technical Research in Engineering (IJSTRE) Volume 4 Issue 2, March 2019. |
| [22] | Directive PNG012 (2015). Allowable Rate of Production: Oil Wells. The Oil and Gas Conservation Act, Government of Saskatchewan, Canada. |
| [23] | Mustafar, I. B. and Razali, R. (2011). A Study on Prediction of Output in Oilfield Using Multiple Linear Regression. International Journal of Applied Science and Technology, 1(4): 107-113. |
| [24] | Gulstad, R. L. (1995). The Determination of Hydrocarbon Reservoir Recovery Factors by Using Modern Multiple Linear Regression Techniques, MSc Dissertation, TexasTech University, Lubbock Texas, USA. |
| [25] | Gilbert, W. E., (1954). Flowing and gas-lift well performance. API Drilling and Production Practice 126–157, 1954. |
| [26] | Ros, N. C. J. (1960). An analysis of critical simultaneous gas/liquid flow through a restriction and its application to flow metering. Applied Science Research 9, 374–388. |
| [27] | Al-Rumah, M., Bizanti, M., (2007). New Choke Correlation for Sabriyah Field Kuwait, Paper SPE 105103 Presented at the 2007 Middle East Oil and Gas Show and Conference, Bahrain, 11-14 March. Society of Petroleum Engineers. |
| [28] | Abdul-Majeed, G. H., (1988). Correlations developed to predict two-phase flow through wellhead chokes. June 12 - 16. In: Paper PETSOC-88-39-26 Presented at the 39th Annual Technical Meeting of the Petroleum Society of CIM Held in Calgary, pp. 1–14. |
| [29] | Beiranvand, M. S., Khorzoughi, M. B., (2012). Introducing a new correlation for multiphase f low through surface chokes with newly incorporated parameters. SPE Prod. Oper. 27(4), 422–428. |
| [30] | Choubineh, A., Ghorbani, H., Wood, D. A., Moosavi, S. R., Khalafi, E., Sadatshojaei, E., (2017). Improved predictions of wellhead choke liquid critical-flow rates: modelling based on hybrid neural network training learning-based optimization. Fuel 207, 547–560. |
| [31] | Ganat, T. A., Hrairi, M., (2018). A new choke correlation to predict flow rate of artificially f lowing wells. J. Petrol. Sci. Eng. 171, 1378–1389. |
| [32] | Jumaah, H. A., (2019). Modify chock performance equation for tertiary reservoir wells in khabaz oil field. 1st international conference on petroleum technology and petrochemicals. IOP Conf. Ser. Mater. Sci. Eng. 579, 012023, 2019. |
| [33] | Christensen U. (1984). Convection with pressure-and temperature-dependent non-Newtonian rheology. Geophysical Journal International, Vol. 77, Issue 2, May 1984, Pages 343-384. |
| [34] | Wackerly, D. D., Mendenhall III, W., Scheaffer, R. L. (2002). Mathematical Statistics with Applications. 7th Edition, Thomson Higher Education, Belmont, CA, USA. |
| [35] | Nevzorov, V. B., Balakrishnan, N., Ahsanullah, M. (2003). Simple characterizations of Student’s t2 distribution. Journal of the Royal Statistical Society: Series D (The Statistician), Vol. 52, Issue 3, p. 395-400. |
| [36] | Esmaeilzadeh, F. (2004). Future South Pars Development may include 9 5/8-in. Tubing, Oil Gas J., 2004, 102, 53-57. |
| [37] | Mansoori, H., Esmaeilzadeh, F., Mowla, D. et al. (2013) Case study: production benefits from increasing C-values, Oil Gas J., 2013. 111, 64-73. |
| [38] | Castle, M. J. and Teng, D. T. (1991). Extending Gas Well Velocity Limits: Problems and Solutions. SPE-22958-MS, Paper presented at the SPE Asia-Pacific Conference, Perth, Australia, November, 1991. |
| [39] | Erichsen, H. (1988). Nipple, Lock, and Flow Coupling Recommendations and Sub-Assembly Description for North Sea wells, Priv. Commun. Nor. Conoco, 1988. |
| [40] | Salama, M. M. (2000). An alternative to API 14E Erosional Velocity Limits for Sand-laden Fluids, J. Energy Resour. Technol., 2000, 122, 71-77. |
APA Style
Livinus, A., Ekpenyong, M. E., Morgan, A., Okon, E. I., Ukpong, S. E. (2025). Development of Maximum Efficient Rate Model and Improvement of Erosional Velocity-Based Correlation for Vertical Oil Wells in the Niger Delta. Petroleum Science and Engineering, 9(1), 13-21. https://doi.org/10.11648/j.pse.20250901.12
ACS Style
Livinus, A.; Ekpenyong, M. E.; Morgan, A.; Okon, E. I.; Ukpong, S. E. Development of Maximum Efficient Rate Model and Improvement of Erosional Velocity-Based Correlation for Vertical Oil Wells in the Niger Delta. Pet. Sci. Eng. 2025, 9(1), 13-21. doi: 10.11648/j.pse.20250901.12
@article{10.11648/j.pse.20250901.12,
  author = {Aniefiok Livinus and Moses Effiong Ekpenyong and Aniekan Morgan and Edet Ita Okon and Seyeneofon Emmanuel Ukpong},
  title = {Development of Maximum Efficient Rate Model and Improvement of Erosional Velocity-Based Correlation for Vertical Oil Wells in the Niger Delta
},
  journal = {Petroleum Science and Engineering},
  volume = {9},
  number = {1},
  pages = {13-21},
  doi = {10.11648/j.pse.20250901.12},
  url = {https://doi.org/10.11648/j.pse.20250901.12},
  eprint = {https://article.sciencepublishinggroup.com/pdf/10.11648.j.pse.20250901.12},
  abstract = {Maximum efficient rate (MER) and erosional velocity are known to be vital concepts in oil and gas production, and producing a well at a maximum efficient rate remains a critical concern to the oil and gas operators, the production engineer and the regulator. Well testing and equilibrium concept are commonly used by oil and gas players to determine the MER of a well. However, little adjustment of the plot axes of the production rate, choke size and tubing head pressure can affect the accuracy of the MER determination. Additionally, there are no known generalized correlations to compare results with that of the MER tests. Furthermore, oil regulatory bodies in Nigeria have no known published models for estimating the technical allowable rate, unlike other regulatory bodies in other countries. This work therefore presents the outcomes of the formulation of MER and the improved erosional velocity-based correlations for vertical oil wells, using MER test data from the Niger Delta region of Nigeria. Multiple linear regression (MLR) and probabilistic modeling approaches were considered. The predicted normalized MER results compared favorably well with the MER test data, with an absolute average error of 7.62%. For the case examples, de-normalization of the predicted MER results increases the absolute average error. Among the predicted P10, P50 and P90 MER results, the predicted P10 results are the nearest to the MER test results. Improvement in the predicted probabilistic results depends on the mean value of the predicted normalized MER considered. The combination of the MER model and the improved erosional velocity-based correlation can be a useful tool for MER test results verification and determination, and in overall for optimization of oil wells.
},
 year = {2025}
}
TY  - JOUR
T1  - Development of Maximum Efficient Rate Model and Improvement of Erosional Velocity-Based Correlation for Vertical Oil Wells in the Niger Delta

AU  - Aniefiok Livinus
AU  - Moses Effiong Ekpenyong
AU  - Aniekan Morgan
AU  - Edet Ita Okon
AU  - Seyeneofon Emmanuel Ukpong
Y1  - 2025/04/27
PY  - 2025
N1  - https://doi.org/10.11648/j.pse.20250901.12
DO  - 10.11648/j.pse.20250901.12
T2  - Petroleum Science and Engineering
JF  - Petroleum Science and Engineering
JO  - Petroleum Science and Engineering
SP  - 13
EP  - 21
PB  - Science Publishing Group
SN  - 2640-4516
UR  - https://doi.org/10.11648/j.pse.20250901.12
AB  - Maximum efficient rate (MER) and erosional velocity are known to be vital concepts in oil and gas production, and producing a well at a maximum efficient rate remains a critical concern to the oil and gas operators, the production engineer and the regulator. Well testing and equilibrium concept are commonly used by oil and gas players to determine the MER of a well. However, little adjustment of the plot axes of the production rate, choke size and tubing head pressure can affect the accuracy of the MER determination. Additionally, there are no known generalized correlations to compare results with that of the MER tests. Furthermore, oil regulatory bodies in Nigeria have no known published models for estimating the technical allowable rate, unlike other regulatory bodies in other countries. This work therefore presents the outcomes of the formulation of MER and the improved erosional velocity-based correlations for vertical oil wells, using MER test data from the Niger Delta region of Nigeria. Multiple linear regression (MLR) and probabilistic modeling approaches were considered. The predicted normalized MER results compared favorably well with the MER test data, with an absolute average error of 7.62%. For the case examples, de-normalization of the predicted MER results increases the absolute average error. Among the predicted P10, P50 and P90 MER results, the predicted P10 results are the nearest to the MER test results. Improvement in the predicted probabilistic results depends on the mean value of the predicted normalized MER considered. The combination of the MER model and the improved erosional velocity-based correlation can be a useful tool for MER test results verification and determination, and in overall for optimization of oil wells.

VL  - 9
IS  - 1
ER  -
Petroleum Engineering Department, University of Uyo, Uyo, Nigeria
Computer Science Department, University of Uyo, Uyo, Nigeria
Petroleum Engineering Department, University of Uyo, Uyo, Nigeria
Chemical Engineering Department, TopFaith University, Mkpatak, Nigeria
Chemical Engineering Department, TopFaith University, Mkpatak, Nigeria
Information