1. Introduction
Groundwater is one of the most crucial natural resources for household life, economic growth, and biological diversity
| [1] | Rashman. Identification of groundwater recharge potential zones in the Thiruverumbur block, Trichy district, using GIS and remote sensing. Journal of Hydrology, (2016), 167, 78-91. https://doi.org/10.1016/j.jhydrol.2017.02.006 |
[1]
. The occurrence and flow system of groundwater depends on geological characteristics of its porosity and permeability, the formation of landform such as high mountains, rift valleys, and flat areas, and the role of landform on surface runoff and infiltration to the ground. Groundwater is the water that is present beneath the surface in the soil and fractured rock formations
| [2] | Rajaveni SP, Brindha K, and Elango L. Geological and geomorphological controls on groundwater occurrence in a hard rock region. (2017). Appl Water Sci 7: 1377-1389.
https://doi.org/10.1007/s13201-016-0427-y |
[2]
.
A unit of rock or unconsolidated deposit is named an aquifer when it can yield a usable quantity of water. The entire quantity of permanent storage found in aquifers is referred to as groundwater potential. The amount of free area and porosity in the rock that could hold water determines the groundwater potential
.
Groundwater is one of the most important resources for preserving biological diversity and human health
| [4] | Waikar, M. & Nilawar A. Identification of Groundwater Potential Zone using Remote Sensing and GIS Technique. International Journal of Innovative Research in Science, Engineering and Technology, (2014), 3(5), 12163-12174.
https://doi.org/10.15680/IJIRSET.2014.0305114 |
[4]
. When surface water sources become severely depleted in different parts of the world, groundwater remains the ultimate source of freshwater for various uses
. Groundwater is a more suitable water resource for domestic and irrigation needs than surface water because it responds more slowly to climate variability and requires less treatment.
Roughly one-third of the world's population relies on groundwater for drinking and irrigation
| [6] | Jose S., Jayasree R., Kumar R. & Rajendran S. Identification of Ground Water Potential Zones in Palakkad District, Kerala, through Multicriteria Analysis Techniques using Geo-information Technology. Geosci Front, (2012), 2(1), 62-68. https://doi.org/10.1016/j.gsf.2011.11.006 |
[6]
. This reliance is higher in rural areas, where about 80% of residents use groundwater for domestic needs, compared to around 50% in urban regions (2018). With an annual storage capacity more than fifty times that of freshwater found in African lakes, Africa has substantial groundwater potential
| [7] | Vinay K. and Vidhya L. Identification of groundwater potential zones using GIS and remote sensing. International Journal of Pure and Applied Mathematics, (2018), 119(17), 3195-3210.
https://doi.org/10.12732/ijpam.v119i17.346 |
| [8] | MacDonald A., Bonsor H., Dochartaigh B. & Taylor, Quantitative maps of groundwater resources in Africa. British Geological Survey Groundwater Program me Internal Report. Environmental Research Letters. (2012), 7(2).
https://doi.org/10.1088/1748-9326/7/2/024009 |
[7, 8]
. Ethiopia is frequently referred to be Africa's "water tower." Despite this, groundwater use remains limited in both Africa and Ethiopia, leading to water shortages for domestic, agricultural, and industrial purposes in many areas
. High construction expenses, insufficient planning by authorities, and a lack of awareness among important players about groundwater quality and water resource identification could all contribute to this problem
. Inadequate groundwater assessment and site selection frequently lead to exploitation issues and failure or ineffective wells.
Variety of geophysical and hydrological elements, including geology, slope aspect, lineaments, drainage density, land use/land cover, rainfall, soil type, and the area's geomorphology, influence groundwater availability, accessibility, movement, and occurrence
| [11] | Banna Lammesa. Groundwater potential and recharge zone mapping by using GIS and remote sensing techniques in the case of the Middle Awash River Basins, Ethiopia. Addis AbabaUniversity (2017).
http://etd.aau.edu.et/handle/123456789/4619 |
[11]
.
Because it is cost- and time-effective, groundwater evaluation, exploitation, exploration, site selection/delineation, and map preparation require serious consideration. Because groundwater is outside of our site, deep in the subsurface, and there is no direct method to facilitate observation of water below the surface, groundwater evaluation, site selection, and delineation become more complicated
.
In most African countries, including Ethiopia, groundwater exploration is commonly conducted by conventional geological and hydrogeological studies, mainly through geophysical surveys without considering the complexity of the aquifer system
| [12] | Zelalem Leyew, Melkamu Meseret, Getnet Taye, Alebachew Tareke, Mulugeta Chanie, and Minyahl Teferi. Appraising groundwater potential zones using geospatial and multi-criteria decision analysis (MCDA) techniques in the Andasa-Tul watershed, Upper Blue Nile basin, Ethiopia. Research Square journal, (2020), 11(2), 322-359.
https://doi.org/10.21203/rs.3.rs-50795/v1 |
[12]
. As a consequence, in different regions of Ethiopia, including the study area, numerous unproductive or low-potential wells are frequently present, leading to approximately one-third of the study area's population experiencing a scarcity of water for various activities. This shows that the complexity of groundwater potential zonation in our country makes it difficult to apply the commonly used conventional exploration methods.
The study area is one of the fastest-growing towns in Ethiopia's Amhara regional state in terms of population and economic activity. As a result, there is a growing demand for accessible water for a variety of activities, including drinking, irrigational agriculture, and newly expanded factories and municipal purposes in the town. Groundwater is a vital source of water for varied activities because it is the safest and most reliable, and has a slow response to climate change
.
To investigate the groundwater potential of the research region, the Amhara Regional Bureau of Water Resources conducted a study involving hydrogeology and geology through the Water Works Construction Enterprise, employing time-consuming and costly hydrogeological methods. However, different studies have been conducted in different parts of Ethiopia using multi-criteria decision analysis to identify and demarcate groundwater potential zones, including
| [12] | Zelalem Leyew, Melkamu Meseret, Getnet Taye, Alebachew Tareke, Mulugeta Chanie, and Minyahl Teferi. Appraising groundwater potential zones using geospatial and multi-criteria decision analysis (MCDA) techniques in the Andasa-Tul watershed, Upper Blue Nile basin, Ethiopia. Research Square journal, (2020), 11(2), 322-359.
https://doi.org/10.21203/rs.3.rs-50795/v1 |
[12]
, which investigates groundwater potential zones employing multi-criteria decision analysis (MCDA) and geographic data in the Andasa-Tul watershed.
Additionally, the MCDA technique has not been used to identify the groundwater potential zones in the research area. When groundwater is the main supply of drinkable water, it is very important to evaluate the regional variability of groundwater potential. A thorough document that maps the groundwater potential in the research area using geospatial MCDA techniques and a water quality index is lacking. The current study uses GIS and remote sensing techniques with a combined analytical hierarchy process to fill the gap left by the lack of research in the groundwater potential zone.
Before a borehole is bored, feasible sites for groundwater potential delineation have long been analyzed using a variety of methods, including geological, hydrogeological, geophysical, and spatial techniques. Due to their capacity to create spatiotemporal information and spatial data analysis, geographic information systems and remote sensing technologies have emerged as crucial instruments for determining the distribution, recharge, and occurrence of groundwater potential
| [13] | Magesh N., Chandrasekar N., and Soundararajan J. Delineation of groundwater potential zones in Theni district, Tamil Nadu, using remote sensing, GIS, and MIF techniques. Geosci Front, (2012), 3: 189-196. https://doi.org/10.1016/j.gsf.2011.10.007 |
[13]
. For researching groundwater potential and gathering data on input factors, Geographic Information Systems (GIS) and Remote Sensing (RS) are both crucial instruments. In groundwater investigations, remote sensing and GIS can be useful instruments that improve data analysis, interpretation, and groundwater potential zone identification.
| [14] | Ndhlovu G. & Woyessa Y. Integrated Assessment of Groundwater Potential Using Geospatial Techniques in Southern Africa: A Case Study in the Zambezi River Basin. Water (2021), 13, 2610. https://doi.org/10.3390/w13192610 |
[14]
.
The MCDA approach takes into account the assessment and examination of many elements or criteria that are directly impacted and connected to the possibility, flow, and presence of groundwater in particular regions. MCDA is a method used by decision makers to make applying many parameters (criteria) easier. Due to its ability to solve complicated problems and make judgments, MCDA, one of the most significant methodologies, is widely recognized as a successful tool
| [15] | Agrwal & Grag. Remote Sensing and GIS-Based Groundwater Potential and Recharge Zones Mapping Using Multi-Criteria Decision-Making Technique (2015).
https://doi.org/10.4236/gep.2016.43003 |
[15]
. Groundwater potential appraisal employs a number of multi-criteria decision-making techniques, including the Multi-Influencing Factor (MIF), Analytical Hierarchy Process (AHP), Fuzzy Logic (FL), Frequency Ratio (FR), Certainty Factor (CF), and Weights of Evidence (WOE). The most popular MCDA methodology for groundwater delineation among these methods is the AHP potential zones. The AHP technique is one of the most efficient decision-making tools, and the results obtained are often reliable
| [16] | Andualem T and Demeke G. Groundwater potential assessment using GIS and remote sensing: A case study of the Guna Tana landscape, Upper Blue Nile Basin, Ethiopia. Journal of Hydro Stud, (2019), 24., https://doi.org/10.1016/j.ejrh.2019.100609 |
[16]
. The first to propose the analytic hierarchy process (AHP) approach, because was powerful and obvious practical applicability, AHP has been frequently employed for groundwater identification and assessments
. The AHP technique compares the alternatives for each criterion, evaluates the weights of the criteria according to their relative relevance, and determines an overall ranking of the alternatives
| [18] | Recep Celik. Evaluation of Groundwater Potential by GIS-Based Multicriteria Decision Making as a Spatial Prediction Tool: Case Study in the Tigris River Batman-Hasankeyf Sub-Basin, Turkey. Water MDPI (2019), 11, 2630.
https://doi.org/10.3390/w11122630 |
[18]
. AHP is currently the most popular MCDA. AHP is a methodical approach to decision-making that allows individuals or groups to analyze their choices in difficult circumstances
| [12] | Zelalem Leyew, Melkamu Meseret, Getnet Taye, Alebachew Tareke, Mulugeta Chanie, and Minyahl Teferi. Appraising groundwater potential zones using geospatial and multi-criteria decision analysis (MCDA) techniques in the Andasa-Tul watershed, Upper Blue Nile basin, Ethiopia. Research Square journal, (2020), 11(2), 322-359.
https://doi.org/10.21203/rs.3.rs-50795/v1 |
[12]
. Simple to solve a problem. AHP analyzes different datasets into a pairwise matrix, which is used to calculate the geometric mean and normalized weight of parameters
| [19] | Ibrahim-Bathis, K., & Ahmed, S. A. (2016). Geospatial technology for delineating groundwater potential zones in the Doddahalla watershed of the Chitradurga district, India. The Egyptian Journal of Remote Sensing and Space Sciences, 19(2), 223-234. https://doi.org/10.1016/j.ejrs.2016.03.001 |
[19]
. The current study focuses on the identification of groundwater potential zones in Chagni town and in its surrounding area by using remote sensing and GIS techniques of MCDA. These techniques are very simple to use, identifying groundwater potential zones in large and inaccessible areas.
2. Materials and Methods
2.1. Description of the Study Area, Geological and Hydrological Setting
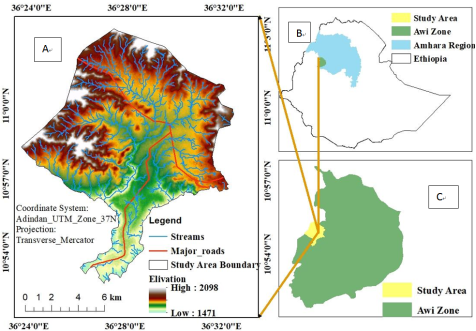
Chagni is an administrative town and the administrative center of Guangua Woreda, in the Awi zone.
Amhara region. The town and its surrounding area are bordered by Guangua Woreda kebeles in most of its directions. The area is bordered by Sigadi kebeles in the north, Lunsi-Degera kebeles in the south, Chereka in the west, and the Benishangul-Gumuz region in the southwest. It is located 57 km from the capital of the Awi zone, Enjibara, 176 km from Bahir Dar, the capital of the Amhara region, and 555 km from Addis Ababa, the capital of Ethiopia.
The geographic location of the study area extends from 100° 45’ 00’’ to 110° 02’ 00’ North and 36
0 23’00’’ to 36
0 35’ 00’ East (
Figure 1). The study area covers around 152 km² of land. Of the total area of land in the study area, around 30 km² is settlement areas, and 122 km² of land is cropland, grazing, and forest lands (Chagni town agricultural office 2021). The study area is structured into 7 kebeles. Around 91% of the local population lived in urban centers with different economic bases, and the rest, 9%, lived in agricultural areas. The total population of the study area is estimated at around 53,182; of these, 25,938 (48.77%) are male, and 27,244 (51.23%) are female in the year
| [20] | ANRSPC. Population Data of Woredas. Amhara National Regional State Plan Commission, Bahir Dar, Ethiopia, (2021). |
[20]
. The Woina-Dega agro-ecological climatic zone is the study's main focus. The average annual rainfall in the region ranges from 1600 to 1810 mm, and the average minimum and maximum temperatures are 19.30°C and 23.80°C, respectively
| [21] | EMA. Rainfall and temperature data of Chagni, National Metrology Agency of Ethiopia, Bahir Dar (2021). |
[21]
. It is between 1471 and 2098 meters above sea level. Although the study area's topography is generally flat, certain areas have steep hills. The research area's location and elevation are depicted in
Figure 1.
In the research area, there is still relatively little water available for domestic usage, particularly for drinking. Each person had access to no more than 13 liters of drinking water per day at the time of this study (Chagni Town Water and Sanitation Office report 2021). The Ethiopian research states that each person needs 50 liters of water per day on average for home consumption.
Geological Setting
The village of Chagni is located in a region with a varied geological environment that may include metamorphic rocks, plateau basalt, and Quaternary deposits. Near rivers and valleys, quaternary sediments like colluvium and alluvium are frequently found, offering potentially substantial groundwater storage. Depending on how much they have weathered and fractured, plateau basalt rocks may function as aquitards or aquifers. In cracked areas of the rock formations, metamorphic rocks, which are common in some areas, may provide groundwater storage.
Surface water and groundwater systems interact to shape Chagni town's hydrogeological environment. Groundwater recharge and flow patterns are impacted by various factors, including topography, soil properties, and land use practices. Assessing groundwater potential requires an understanding of the hydraulic characteristics of aquifers, such as porosity, permeability, and storativity. Sustainable groundwater management requires the identification of possible recharge regions, groundwater flow routes, and discharge zones.
2.2. Study Methodology
The study attempts to delineate groundwater potential areas, or zones A, in the study area. The study was carried out in Chagni town and its surrounding area using remote sensing and GIS-based multi-criteria decision analysis of AHP. The study was a quantitative study approach to identify the groundwater potential zone in the study area. This is because the data that were used in this study are quantitative data collected from different sources and analyzed using the quantitative method. The study design that was used in this study is a correlational study design method to analyze variables that were used to predict groundwater potential. The correlational research design was important to analyze the relation between the dependent and independent variables to predict the output.
Data Type and Sources
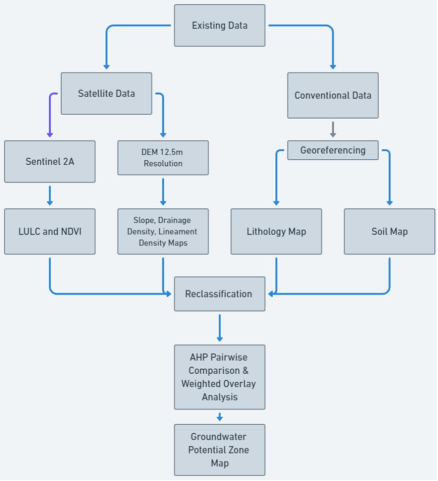
To accomplish the proposed research with respect to the nature of the research objectives, a combination of both primary and secondary data sources was used in the study. Satellite images were used for the land use/land cover (LULC) map and extraction of lineaments. Bands of Sentinel -2A images were acquired from USGS with spatial resolutions of 10 m to generate an LULC thematic map. ALOS-POLSAR DEM (Digital Elevation Model) was acquired from EDU.ALASKA with spatial resolutions of 12.5 meters, and was used to generate slope maps, geomorphology maps, and drainage density thematic maps. Geological map from the Regional Geological Survey at a 1:50,000 scale for the preparation of a lithological map of the area. The Amhara Regional State of Design and Supervision Work Enterprise created soil maps of the Amhara region at a scale of 1:20,000 to prepare the soil map thematic layer. The soil data was taken from secondary sources. In order to prepare the rainfall thematic layer, meteorological data was gathered from the Ethiopian Meteorological Agency and downloaded from https://www.power.larc.nasa.gov. In order to prepare the depth of the groundwater thematic layer and evaluate the groundwater potential zone result, field survey data and secondary data were gathered about the existing water points (boreholes, hand-dug wells) in the research region, primarily about their depth and yield. The study's overall methodological flowchart is displayed below (
Figure 2).
2.3. Methods of Data Analysis
Nine thematic layers (factor maps): slope, rainfall, drainage density, lineament density, geomorphology, lithology, soil, land use/land cover, and depth to groundwater level were utilized as input factors to determine the Groundwater Potential Zone (GWP) in the research area. For groundwater potential zonation, each of the thematic layers was reclassified based on its contribution to GWP.
2.3.1. Thematic Layer Preparation and Reclassification for Groundwater Potential
For the investigation of the groundwater potential zone in Chagni Town and the surrounding area, nine thematic layers have been produced and analyzed. The thematic layers include slope, rainfall, drainage density, lineament density, geomorphology, lithology, soil texture, land use/land cover, and groundwater depth. Based on their contribution to groundwater potential, each thematic layer was reclassified, and weights were assigned. The weights of each thematic layer determining the spatial distribution, recharge, and potential of groundwater vary from 5 (highest contribution) to 1 (lowest). Thematic layers of slope, rainfall, drainage density, lineament density, land use/land cover, and groundwater depth were classified into five classes from 5 to 1
| [16] | Andualem T and Demeke G. Groundwater potential assessment using GIS and remote sensing: A case study of the Guna Tana landscape, Upper Blue Nile Basin, Ethiopia. Journal of Hydro Stud, (2019), 24., https://doi.org/10.1016/j.ejrh.2019.100609 |
| [22] | Mogaji K., Aboyeji O., and Omosuyi G. Mapping of lineaments for groundwater targeting in the basement complex region of Ondo State, Nigeria, using remote sensing and geographic information system (GIS) techniques. International Journal of Water Resources and Environmental Engineering, (2011), 3(7), 150-160. https://doi.org/10.5897/IJWREE11.050 |
[16, 22]
. Geomorphology and soil texture are classified into four respective classes, from 4 (highest) to 1 (lowest). Only the lithology of the study area was classified into three classes, from 3 (highest) to 1 (lowest).
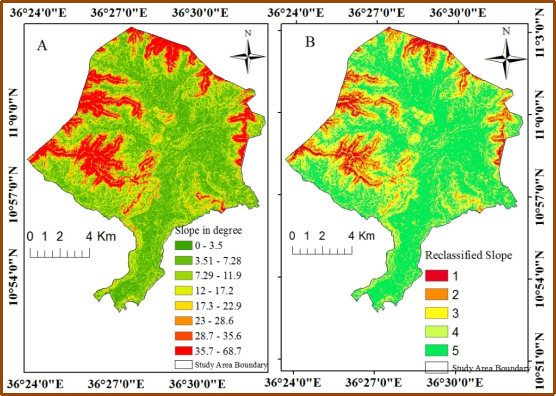
(i). Slope Map
Since slope controls the movement of water in a region, it is regarded as one of the primary determinants for water flow. Slope is the rate at which elevation changes. The type of runoff and groundwater recharge is directly impacted by the slope. Additionally, a 12.5m spatial resolution ALOS-POLSAR DEM that was retrieved from ASF.Alaska.edu on April 20, 2022, was used to create a slope map of the research region. Slope extraction in the ArcGIS software's spatial analysis tool was used to extract the slope thematic layer from the DEM picture.
Slope is the steepness or the change of elevation between two locations, and it has a direct influence on groundwater recharge
. High-slope areas have high runoff and a low infiltration rate, which are not suitable for groundwater recharge and potentially because water cannot get enough time to infiltrate into the ground
. Based on their contribution to groundwater potential, the research area's slope was classed and placed into five classes: flat (less than 30), mild (30-100), moderate (100-180), steep (180-250), and extremely steep (>250) slopes (
Figure 3). The lowest rank was given to extremely steep slopes due to heavy runoff and low infiltration rates, which result in low groundwater recharge
| [16] | Andualem T and Demeke G. Groundwater potential assessment using GIS and remote sensing: A case study of the Guna Tana landscape, Upper Blue Nile Basin, Ethiopia. Journal of Hydro Stud, (2019), 24., https://doi.org/10.1016/j.ejrh.2019.100609 |
[16]
. The highest rank was given to flat slopes because of their great capacity to hold water, which makes it very easy for water to reach the bottom.
About 73 percent of the study areas are categorized under flat and gentle slope areas, which have a high contribution to groundwater potential, while 13 percent of the area has a steep /very steep slope, which has a lower contribution to groundwater potential (
Table 1).
Table 1. Displays the slope along with its rank according to groundwater potential contribution.
Factor | Classification in degree | Contribution to groundwater | Rank | Area/km2 | Percentage |
Slope | <3 | Very high | 5 | 72 | 47 |
3-10 | High | 4 | 40 | 26 |
10-18 | Moderate | 3 | 18 | 12 |
18-25 | Low | 2 | 13 | 9 |
25-60 | Very low | 1 | 6 | 4 |
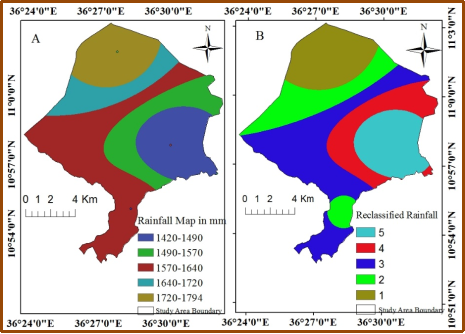
(ii). Rainfall Map
The Ethiopian Meteorological Agency (EMA) of the Bahir-Dar branch provided the research area's recorded rainfall data, and three points were retrieved for interpolation from https://www.power.Larc.nasa.gov. Inverse Distance Weight (IDW) interpolation in ArcGIS was used to interpolate rainfall data points at various locations to create the rainfall maps.
One of the most crucial elements in the development of groundwater recharge and potential is rainfall. The quantity of recharge determines the sustainability of groundwater
. Using the natural break approach in ArcGIS, the research area's mean annual rainfall, which ranges from 1427 mm to 1794 mm, was categorized into five classes based on their contribution to groundwater recharge. Groundwater potential is directly correlated with rainfall
. As a result, the highest rainfall value in the research area receives the highest weight, while the lowest rainfall distribution receives the lowest weight. According to
Figure 4, around 36% of the study area was found to have high rainfall distribution, which contributes more to groundwater, and 17% of the area has a low contribution due to low recharge ability (
Table 2).
Table 2.
Rainfall and its ranking according to groundwater potential contribution. Factor | Classification of rainfall in mm | Contribution to groundwater | Rank | Area km/km2 | Percentage |
Rainfall | 1427-1490 | Very low | 1 | 24.7 | 17 |
1490-1570 | Low | 2 | 23.6 | 15 |
1570-1640 | Moderate | 3 | 49 | 32 |
1640-1720 | High | 4 | 25 | 17.5 |
1720-1794 | Very high | 5 | 27 | 18.5 |
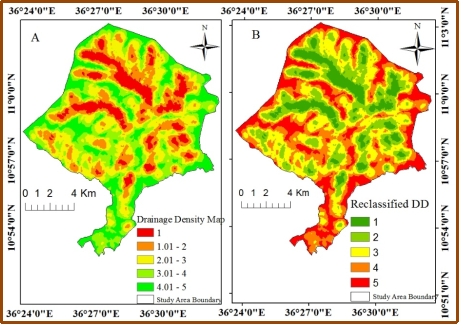
(iii). Map of Drainage Density
Groundwater recharge capacity is influenced by permeability and infiltration rate, which are shown by drainage density. Maps showing drainage density were created using the 12.5 m spatial resolution ALOS-POLSAR DEM (Digital Elevation Model). The sinks from the imported DEM data were filled first, followed by the creation of flow direction and flow accumulation, the generation of stream orders from the flow accumulation, and the use of ArcGIS to transform the stream order into drainage density. Using density calculation in the spatial analysis tool of line density in ArcGIS 10.8, the drainage density layer was computed from the drainage network (extracted from the DEM). Thematic river maps obtained from a flow accumulation and stream in the basin region were divided to extract the drainage-density map
| [25] | Getachew Hadush Asmerom. Groundwater contribution and recharge estimation in the upper Blue Nile flow (Ethiopia). International Institute of Geo-Information Science and Earth Observatory, ENSCHEDE, the Netherlands, (2008).
https://purl.itc.nl/library/12833 |
[25]
.
where DD is Drainage Density, L is drainage length, and A is area of the catchment.
Rock permeability and infiltration capacity are shown by drainage density. Because there is less surface water flow in rivers in locations where rocks are porous, their infiltration rate to groundwater is significant; yet, in areas where rocks have low permeability, there is minimal water infiltration to the earth because of increasing surface water runoff
| [16] | Andualem T and Demeke G. Groundwater potential assessment using GIS and remote sensing: A case study of the Guna Tana landscape, Upper Blue Nile Basin, Ethiopia. Journal of Hydro Stud, (2019), 24., https://doi.org/10.1016/j.ejrh.2019.100609 |
[16]
. Therefore, low drainage density contributes to higher groundwater recharge and higher groundwater potential. The drainage density of the study area was reclassified and ranked into five classes based on their importance for groundwater potential, namely, very high (less than 1 km), high (1-2), medium (2-3), low (3-4), and very low (greater than 4). More than 58% of the study area belongs to the medium and high drainage density class (
Figure 5). A high drainage density value has high runoff and indicates a low possibility of groundwater availability. Hence, higher weights are assigned to the low drainage density area, and lower weights are given to the low drainage density (
Table 3).
Table 3.
Drainage density and its rank based on its contribution for groundwater. Factor | Classification km/km² | Contribution to groundwater | Rank | Area/km2 | Percentage |
Drainage density | 0-1 | Very high | 5 | 16 | 12 |
1-2 | High | 4 | 29.8 | 19 |
2-3 | Moderate | 3 | 40 | 27 |
3-4 | Low | 2 | 36.7 | 24 |
4-5 | Very low | 1 | 28.9 | 18 |
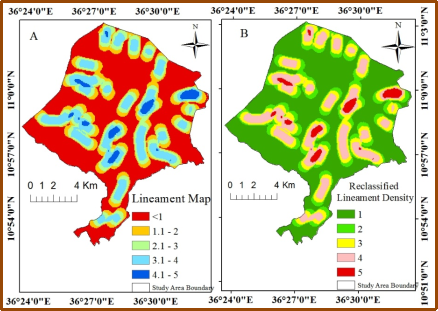
(iv). Map of Lineament Density
The cracks were caused by tectonic activity, and the lineaments are linear characteristics. The porosity and permeability of groundwater are determined by the characteristics of fractures. The connectivity between the length and space of fractures has a key influence on the occurrence and movement of groundwater resources. A line density map of the area was produced from a DEM picture of 12.5-meter resolution. The DEM of the study was analyzed by ArcGIS software and confirmed with field-collected structural data. Using the spatial analysis tool of the line density function in the ArcGIS environment, the retrieved lineaments were transformed into a lineament density map.
Lineament (fault) density (LD) is the total length of lineaments in a unit area
| [26] | Hamza Abrar, Abiyot Legesse Kura, Engida Esayas Dube & Dereje Likisa Beyene AHP-based analysis of groundwater potential in the western escarpment of the Ethiopian Rift Valley. Geology, Ecology, and Landscapes, (2021).
https://doi.org/10.1080/24749508.2021.1952763 |
[26]
.
LineamentDensity(LD)=∑〖Li/A〗(2)
Where Li = length of each lineament within the study area and A = total area.
The structural discontinuities of the Earth's surface, such as joints, fractures, and faults, are known as lineaments. For water to infiltrate and flow to the earth, it must be curved, linear, or slightly curved
| [26] | Hamza Abrar, Abiyot Legesse Kura, Engida Esayas Dube & Dereje Likisa Beyene AHP-based analysis of groundwater potential in the western escarpment of the Ethiopian Rift Valley. Geology, Ecology, and Landscapes, (2021).
https://doi.org/10.1080/24749508.2021.1952763 |
[26]
. Low lineament densities are less suited for groundwater recharge and potential, while high lineament density locations are favorable for groundwater recharge. Because lineament density and groundwater potential are directly correlated, locations with very high lineament density receive the highest weight due to their high groundwater infiltration rate, while locations with low lineament density receive the lowest weight due to their low groundwater infiltration rate
| [16] | Andualem T and Demeke G. Groundwater potential assessment using GIS and remote sensing: A case study of the Guna Tana landscape, Upper Blue Nile Basin, Ethiopia. Journal of Hydro Stud, (2019), 24., https://doi.org/10.1016/j.ejrh.2019.100609 |
| [22] | Mogaji K., Aboyeji O., and Omosuyi G. Mapping of lineaments for groundwater targeting in the basement complex region of Ondo State, Nigeria, using remote sensing and geographic information system (GIS) techniques. International Journal of Water Resources and Environmental Engineering, (2011), 3(7), 150-160. https://doi.org/10.5897/IJWREE11.050 |
[16, 22]
. According to
Figure 6, only 19% of the study area has high lineament density and contributes more to the groundwater potential, but around 66% of the area has a low contribution to groundwater potential due to low lineament density (
Table 4).
Table 4.
Lineament density and its rank based on its contribution for groundwater. Factor | Classification | Contribution to groundwater | Rank order | Area km/km2 | Percentage |
Lineament density | 0-1 | Very low | 1 | 78.8 | 52 |
1-2 | Low | 2 | 21 | 14 |
2-3 | Moderate | 3 | 23.6 | 16 |
3-4 | High | 4 | 24.4 | 16 |
4-5 | Very high | 5 | 4.1 | 3 |
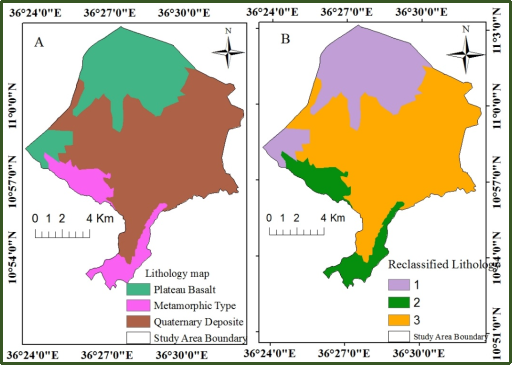
(v). Geological or Lithology Map
Lithology plays a significant role in the distribution, occurrence, and availability of groundwater. It directly determines the porosity, the size of pore space, and the permeability of the geologic feature, which affects the availability of groundwater in an area. To identify the type, nature, and effects of geology, the study area shape file and a field survey of the local lithology were used to extract the lithology map of the research area from a regional geological survey map created at a scale of 1:2,000,000.
The lithological formation and type are crucial parameters for groundwater flow and transfer in an area. The hydrological structure, porosity values, and permeability are all determined by the types of rocks
| [22] | Mogaji K., Aboyeji O., and Omosuyi G. Mapping of lineaments for groundwater targeting in the basement complex region of Ondo State, Nigeria, using remote sensing and geographic information system (GIS) techniques. International Journal of Water Resources and Environmental Engineering, (2011), 3(7), 150-160. https://doi.org/10.5897/IJWREE11.050 |
[22]
. Lithological units with higher porosity and higher permeability contribute to higher groundwater storage and higher groundwater yields
| [26] | Hamza Abrar, Abiyot Legesse Kura, Engida Esayas Dube & Dereje Likisa Beyene AHP-based analysis of groundwater potential in the western escarpment of the Ethiopian Rift Valley. Geology, Ecology, and Landscapes, (2021).
https://doi.org/10.1080/24749508.2021.1952763 |
[26]
. The study area comprises a variety of rocks, including the tertiary basaltic rocks in the mountain and hilly areas, which cover around 28% of the area. The quaternary basalt deposition covers a larger area (61%) and is found in the central and southern parts of the area, while metamorphic rock types cover a small portion of the study area (11%) and are found mainly in the western and southeastern parts of the border of the Benishangul-Gumuz region. The lithological units of the study area have been given weights on the basis of their contribution to the groundwater potential and recharge. A higher weight and rank have been given to quaternary deposit rocks, and a lower weight and rank have been given to tertiary basaltic rocks due to their permeability and porosity. The spatial distribution of lithological units (
Figure 7) and the assigned weights are depicted in
Table 5.
Quaternary Deposits: Because of their high porosity and permeability
| [26] | Hamza Abrar, Abiyot Legesse Kura, Engida Esayas Dube & Dereje Likisa Beyene AHP-based analysis of groundwater potential in the western escarpment of the Ethiopian Rift Valley. Geology, Ecology, and Landscapes, (2021).
https://doi.org/10.1080/24749508.2021.1952763 |
[26]
, Quaternary deposits, which include more recent sediments like alluvium, colluvium, and terrace deposits, can be significant aquifers. In many areas, these deposits are frequently excellent sources of groundwater. In order to evaluate the groundwater potential in Chagni town, it is essential to comprehend the distribution, thickness, and hydraulic characteristics of Quaternary deposits.
Depending on how they fracture, basalt formations like those found in plateau regions can function as both aquitards and aquifers. While undisturbed basalt can obstruct groundwater flow, fractured basalt layers have the capacity to store and transfer substantial volumes of groundwater
| [22] | Mogaji K., Aboyeji O., and Omosuyi G. Mapping of lineaments for groundwater targeting in the basement complex region of Ondo State, Nigeria, using remote sensing and geographic information system (GIS) techniques. International Journal of Water Resources and Environmental Engineering, (2011), 3(7), 150-160. https://doi.org/10.5897/IJWREE11.050 |
[22]
. Assessing groundwater resources in Chagni town requires a thorough understanding of the thickness, permeability, and breadth of plateau basalts.
Metamorphic rocks generally have low primary porosity but can host secondary fractures and faults that act as important groundwater pathways
| [26] | Hamza Abrar, Abiyot Legesse Kura, Engida Esayas Dube & Dereje Likisa Beyene AHP-based analysis of groundwater potential in the western escarpment of the Ethiopian Rift Valley. Geology, Ecology, and Landscapes, (2021).
https://doi.org/10.1080/24749508.2021.1952763 |
[26]
. Understanding the structural characteristics, degree of fracturing, and groundwater behavior within metamorphic rocks in the area is crucial for assessing groundwater potential.
Table 5.
Lithology and its rank based on its contribution for groundwater potential. Factor | Classification types of rock | Contribution to groundwater | Rank | Area/km2 | Percentage |
Lithology | Plateau basalt | Low | 1 | 43 | 28 |
Metamorphic | Moderate | 2 | 16 | 11 |
Quaternary deposit | High | 3 | 92 | 61 |
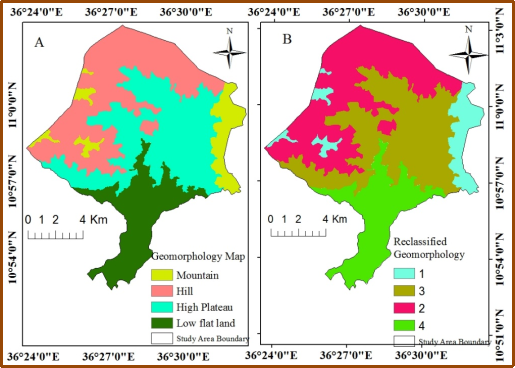
(vi). Geomorphology Map
Geomorphology, which reflects various landforms and topographical features of an area, is one of the most important criteria for identifying groundwater potential zones, and it aids in comprehending the features of a particular region's hydrological formations
| [25] | Getachew Hadush Asmerom. Groundwater contribution and recharge estimation in the upper Blue Nile flow (Ethiopia). International Institute of Geo-Information Science and Earth Observatory, ENSCHEDE, the Netherlands, (2008).
https://purl.itc.nl/library/12833 |
[25]
. The topographic map of the research region, which was acquired from the Ethiopia Mapping Agency (EMA), was digitized at a scale of 1:50,000 using DEM to create the geomorphology map. One of the most crucial factors for determining groundwater potential zones is geomorphology, which represents the different landforms and topographical aspects of a region and aids in comprehending the peculiarities of the hydrological formations of a particular area
| [16] | Andualem T and Demeke G. Groundwater potential assessment using GIS and remote sensing: A case study of the Guna Tana landscape, Upper Blue Nile Basin, Ethiopia. Journal of Hydro Stud, (2019), 24., https://doi.org/10.1016/j.ejrh.2019.100609 |
| [23] | Tiwari, G. & Shukla, J. P. A review on remote sensing and GIS techniques in water resource development and management, Water MDPI (2015), 4, 10-16.
https://doi.org/10.4236/jwarp.2015.72002 |
[16, 23]
. Because the infiltration rate of the various geomorphic features varies, the values of geomorphology fluctuate in terms of their characteristics and spatial distribution for groundwater potential and recharge processes. The geomorphology of the study area is classified into four units: mountain cover (9%), hill cover (30%), high plateau (36%), and low flatlands (19%). Mountains and hills largely found in the northern, northwestern, and northeastern parts of the study area have a lower contribution for groundwater potential. While the plateaus and flatlands in the central and southern parts of the area have a high contribution. The following (
Table 6 and
Figure 8) shows the rank and contribution of the geomorphologic units of the study area.
Table 6.
Geomorphology and its rank based on its contribution for groundwater potential. Factor | Classification | Contribution to groundwater | Rank order | Area km/km2 | Percentage |
Geomorphologic units | Mountain | Very low | 1 | 14 | 9 |
Hill | Low | 2 | 48 | 30 |
High plateau | High | 3 | 55 | 36 |
Low flat land | Very high | 4 | 35 | 25 |
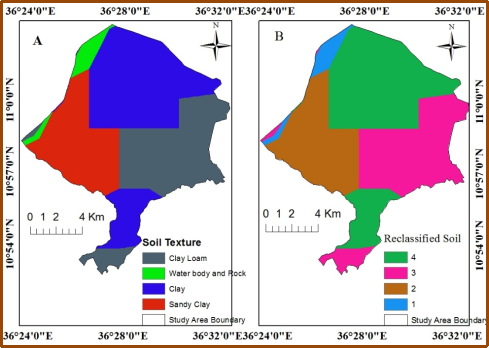
(vii). Soil Map
Water infiltration into the earth has been significantly impacted by the properties of the soil. The soil's particle size has a significant impact on the rate of infiltration. Using the extraction tool of the spatial analysis tool of the ArcGIS environment based on the research area shape file, the study area's soil map was taken from a regional soil map created by the Amhara Regional State of Design and Supervision Work Enterprise at a scale of 1:20,000.
The runoff and infiltration rate of water to the ground surface are significantly influenced by the properties of the soil. An area's soils differ in terms of size, drainage, depth, and texture.
The soil textures are the most determining factor of groundwater occurrence and availability, since the amount of infiltration and runoff largely depends on the particle size or texture of the soils
| [16] | Andualem T and Demeke G. Groundwater potential assessment using GIS and remote sensing: A case study of the Guna Tana landscape, Upper Blue Nile Basin, Ethiopia. Journal of Hydro Stud, (2019), 24., https://doi.org/10.1016/j.ejrh.2019.100609 |
[16]
. The particle size of the soil in the study area varies from clay loam to sandy soil. In relation to groundwater potential, the soil of the study area was classified into four classes based on
| [27] | Durlevic, U., Valjarevic, A., Novkovic, I., Curcic, N. B., Smilijic, M., Morar, C., Stoica, A., Barisic, D., & Lukic, T.(2022). GIS-Based Spatial Modeling of Snow Avalanches Using Analytic Hierarchy Process. A Case Study of the Sar Mountains, Serbia. Atmosphere, (2022), 13(8), 1229.
https://doi.org/10.3390/atmos13081229 |
[27]
, namely clay covers (42%), and clay loam (32%), and sandy clay (23%), and water body and rock cover (4%). Due to their difference in infiltration and porosity, the weight of soil texture is assigned on the basis of their infiltration rate. A higher weight has been given to the water body and rocks due to higher porosity and infiltration (
Table 7), while a lower weight has been given to clay due to its poor drainage ability
| [19] | Ibrahim-Bathis, K., & Ahmed, S. A. (2016). Geospatial technology for delineating groundwater potential zones in the Doddahalla watershed of the Chitradurga district, India. The Egyptian Journal of Remote Sensing and Space Sciences, 19(2), 223-234. https://doi.org/10.1016/j.ejrs.2016.03.001 |
[19]
. Around 42 percent of the study area covered by low-drained clay soil has a lower contribution to groundwater potential (
Figure 9).
Table 7.
Soil composition and its ranking in relation to groundwater potential. Factors | Classification | Contribution to groundwater | Rank | Area/km2 | % |
Soil texture | Clay | Low | 1 | 64 | 42 |
Clay loam | Moderate | 2 | 46.3 | 31 |
Sandy clay | High | 3 | 35.5 | 23 |
Water body and rocks Very | Very high | 4 | 6 | 4 |
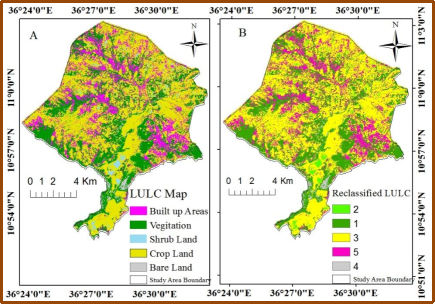
(viii). Land Use/Land Cover (LULC) Map
Land use and land cover are important characteristics of the runoff process that affect the rate of infiltration and evapotranspiration. A 2022 Sentinel-2A satellite picture was used to interpret a land use/land cover (LULC) map of the region. A LULC thematic map was created using bands of the Sentinel-2A picture that were freely obtained at https://earthexplorer.usgs.gov with spatial resolutions of 10 meters. The multispectral band of Sentinel-2A satellite pictures with 10 m spatial resolution of spectral channels was used to prepare the area's land use cover. The LULC map was created using a maximum likelihood supervised image classification technique following radiometric correction in ERDAS Imagine 15. An accuracy assessment was done to check the accuracy of the LULC classification. For the purpose of accuracy assessment, 150 reference points were collected on the field, and some inaccessible points with the help of Google Earth software. Finally, using ERDAS Imagine software, the accuracy of the LULC class was verified. The overall classification accuracy shows 85.33%, or 0.7812 Kappa coefficients, were correctly classified.
Land use and land cover are important factors that influence runoff, infiltration rate, erosion, and evapotranspiration
| [16] | Andualem T and Demeke G. Groundwater potential assessment using GIS and remote sensing: A case study of the Guna Tana landscape, Upper Blue Nile Basin, Ethiopia. Journal of Hydro Stud, (2019), 24., https://doi.org/10.1016/j.ejrh.2019.100609 |
[16]
. Classifying land use and land cover is important because the types of land use and land cover in an area can increase or decrease infiltration rate
| [14] | Ndhlovu G. & Woyessa Y. Integrated Assessment of Groundwater Potential Using Geospatial Techniques in Southern Africa: A Case Study in the Zambezi River Basin. Water (2021), 13, 2610. https://doi.org/10.3390/w13192610 |
[14]
. In the study area, five major land use/land cover classes were identified: cultivated land (51%), forest cover (28%), built-up areas (17%), Shrubland (2.6%), and bare land (1.3%) (
Figure 10). Vegetated areas, such as forests and Shrubland, have low runoff, which increases the rate of infiltration, whereas built-up areas, such as roads, settlements, and barren lands, have higher runoff, which decreases the rate of infiltration
| [28] | Enifer MA, Jha MK. Comparison of Analytic Hierarchy Process, Catastrophe, and Entropy techniques for evaluating groundwater prospects of hard-rock aquifer systems. J Hydrology, (2017), 548: 605-624.
https://doi.org/10.1016/j.jhydrol.2017.03.045 |
[28]
. Forest areas have a high contribution and are given a high weight for their contribution to groundwater potential, whereas built-up areas have a low contribution and are given a low weight (
Table 8).
Table 8.
Land use Land cover and its rank based on its contribution for groundwater. Factors | Classification | Contribution to groundwater | Rank | Area/km2 | Percentage |
LULC | Forest | Very high | 5 | 43 | 28.3 |
Shrub lands | High | 4 | 4 | 2.6 |
Cultivated land | Moderate | 3 | 77 | 51 |
Bare land | Low | 2 | 2 | 1.3 |
Built-up area | Very low | 1 | 26 | 17 |
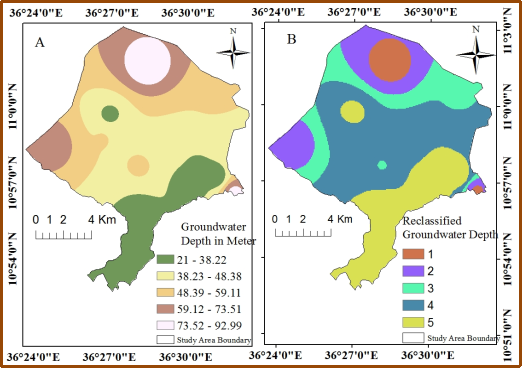
(ix). Groundwater Depth Map
A depth-to-groundwater-level map of existing water well point data of the study area was collected from the Chagni town water and sanitation office and field survey using handheld GPS. About 14 groundwater well data were collected, which vary from 21 m to 93 m in depth (
Table 9). All spatially referenced groundwater well data is imported to ArcGIS software. Based on the known points of the groundwater well depth, the unknown areas of the study area were interpolated using the Inverse Distance Weight (IDW) interpolation technique in ArcGIS for the preparation of the depth to the groundwater thematic layer.
Table 9.
Groundwater depth data (the study area’s water and sanitation office). Well name | Depth in meter |
Well 1 | 81 |
Well 2 | 29 |
Well 3 | 54 |
Well 4 | 93 |
Well 5 | 35 |
Well 6 | 49 |
Well 7 | 31 |
Well 8 | 51 |
Well 9 | 71 |
Well 10 | 44 |
Well 11 | 27 |
Well 12 | 21 |
Well 13 | 41 |
Well 14 | 36 |
One crucial indicator of the research area's groundwater potential zone is groundwater depth. A groundwater depth map of the research area was created by interpolating data from about 14 groundwater wells using ArcGIS's IDW approach. The region's groundwater depth ranges from 21 to 93 meters below the surface. Using ArcGIS's natural breaks classification technique, the resulting map has been categorized into five classes, ranked from lowest to highest. The lowest groundwater depth is given a higher weight and a high probability of GWP based on its signal of groundwater potential
| [12] | Zelalem Leyew, Melkamu Meseret, Getnet Taye, Alebachew Tareke, Mulugeta Chanie, and Minyahl Teferi. Appraising groundwater potential zones using geospatial and multi-criteria decision analysis (MCDA) techniques in the Andasa-Tul watershed, Upper Blue Nile basin, Ethiopia. Research Square journal, (2020), 11(2), 322-359.
https://doi.org/10.21203/rs.3.rs-50795/v1 |
| [24] | Salwa, F. An overview of integrated remote sensing and GIS for groundwater mapping in Egypt. Ain Shams Engineering Journal, (2015), 6(1), 1-15.
https://doi.org/10.1016/j.asej.2014.08.008 |
| [26] | Hamza Abrar, Abiyot Legesse Kura, Engida Esayas Dube & Dereje Likisa Beyene AHP-based analysis of groundwater potential in the western escarpment of the Ethiopian Rift Valley. Geology, Ecology, and Landscapes, (2021).
https://doi.org/10.1080/24749508.2021.1952763 |
[12, 24, 26]
. The maximum groundwater depth has a lower rank and contributes little to the groundwater potential zone (
Table 10 and
Figure 11).
Table 10.
Groundwater depth and its rank based on its contribution for groundwater. Factors | Classification in meter | Contribution to groundwater | Rank | Area/km2 | Percentage |
Groundwater Depth | 21-38.22 | Very high | 5 | 34 | 22.4 |
38.23-48.38 | High | 4 | 61 | 40.1 |
48.39-50.11 | Moderate | 3 | 26 | 17.1 |
59.12-73.51 | Low | 2 | 23 | 15.1 |
73.52-92.99 | Very low | 1 | 8 | 5.3 |
2.3.2. Developing an Analytical Hierarchy Process (AHP)
The influence of subjective attitude in deciding the weight of the criteria is the primary feature of the Analytical Hierarchy Process (AHP) technique. The findings of earlier studies in the same field serve as the basis for the subjective attitude toward the relative value of certain criteria. In that instance, a more objective presentation of the results may arise from the user's subjectivity on the order of natural conditions by importance
| [28] | Enifer MA, Jha MK. Comparison of Analytic Hierarchy Process, Catastrophe, and Entropy techniques for evaluating groundwater prospects of hard-rock aquifer systems. J Hydrology, (2017), 548: 605-624.
https://doi.org/10.1016/j.jhydrol.2017.03.045 |
[28]
. For identifying the groundwater potential zone and decision-making process, the AHP method was used. Therefore, by using the AHP, problems can be decomposed into different hierarchies/levels. The objective of identifying groundwater potential zones is the first level of the hierarchy. The criteria used to determine if the potential zone might be recognized are at the second level of the hierarchy. Using various metrics or factor maps, the third level discusses criteria for choosing a groundwater potential zone (reclassification was done for each parameter). Finally, the options were classified as very high, high, moderate, low, and bad based on the study area's groundwater potential zones.
(i). Pairwise Comparison Matrix (PCM) Establishment
Table 11.
Preference scale for two parameters in AHP. Importance | Definition | Explanation |
1 | Equal importance | Two criteria contribute equally to the objective |
3 | Moderate importance | Judgment slightly favors one criterion over another |
5 | Strong importance | strongly favors one criterion over another |
7 | Very strong importance | very strongly favors one criterion over another |
9 | Extreme importance | favoring one criterion over another is highest |
2, 4, 6, 8 | Intermediate values | When compromise is needed |
Reciprocals | Values for inverse comparison | If criterion i had one of the above numbers assigned to it when compared with criterion j, then j has the reciprocal value when compared with i. |
Nine factor maps and theme layers with distinct classifications were applied to determine groundwater potential zones. To identify which trait becomes more significant than the others, a matrix for comparing all the thematic layers was established. The preference scale was used to establish the relative weights and priorities (
Table 11)
.
First, the square matrix of pairwise comparison was created using the row and column elements and M = mij. One can compute the reciprocal values of the top diagonal using 1/mij.
(3)
Using Satty’s AHP matrix, the different criteria and classes within each of the criteria were compared with reference to the expert's decision, experience, and local hydrogeological conditions.
Second: Several parameters were used to compute the geometric mean. The total score weight divided by the total number of parameters yields the geometric mean.
Geometricmean=totalscoreweight/totalnumberofparameters,(4)
Third: Normalized weights were calculated. It is an indicator of multiparameter analysis of groundwater mapping. Normalized weight is calculated by assigning the weight of the parameter feature class to the geometric mean.
Normalizedweight=(Assignedweightofparameterfeatureclass)/(geometricmean)(5)
Fourth: calculating the consistency ratio to confirm that the conclusions are coherent. The following formula was used in AHP to determine the consistency ratio.
Where CR is the consistency ratio, CI is the consistency index, and RCI is the random consistency index for the same order of matrices. The acceptable CR is 0.10 or less to zero to continue the AHP analysis.
The fifth step is to compute the consistency index. The following formula will be utilized to determine the consistency index:
Where n is the number of parameters used in the comparison, and λmax is the pairwise comparison matrix's maximum eigenvalue.
The consistency index (RCI) of a randomly generated PCM is dependent on the size of the PCM, or the number of elements being compared. I have calculated the RCI using Saaty (
Table 12).
Table 12.
The number of comparisons and the random consistency index (RCI) . N | 1 | 2 | 3 | 4 | 5 | 6 | 7 | 8 | 9 | 10 |
RCI | 0 | 0 | 0.58 | 0.90 | 1.12 | 1.24 | 1.32 | 1.41 | 1.45 | 1.49 |
(ii). Weighted Linear Combination (WLC)
To determine the study area's groundwater potential zone, the computed weights for each thematic layer were combined utilizing ArcGIS software's weighted overlay analysis. All thematic layers were prepared with the same coordinate system and area extent, then added and overlaid with weighted overlay techniques. The output potential map was reclassified into different zones (high, medium, low, and poor potential zones).
Where GWP is groundwater potential, WI is the weight for each thematic layer, and Ri is the rate for the classes in each thematic layer.
3. Result and Discussion
3.1. Identification of the Groundwater Potential Zone
Thematic layers (slope, rainfall, drainage density, lineament density, geomorphology, lithology, soil texture, land use/land cover, and groundwater depth) were given relative weights based on expert knowledge gained from similar groundwater potential zone mapping work or the assessment of research projects
| [10] | Tesfaye Tessema. Groundwater Potential Evaluation Based on Integrated GIS and Remote Sensing Techniques in the Bilate River Catchment: South Rift Valley of Ethiopia. American Scientific Research Journal for Engineering, Technology, and Sciences,(2015), 10(1), 85-120.
https://asrjetjournal.org/index.php/American_Scientific_Journal/article/view/421 |
| [12] | Zelalem Leyew, Melkamu Meseret, Getnet Taye, Alebachew Tareke, Mulugeta Chanie, and Minyahl Teferi. Appraising groundwater potential zones using geospatial and multi-criteria decision analysis (MCDA) techniques in the Andasa-Tul watershed, Upper Blue Nile basin, Ethiopia. Research Square journal, (2020), 11(2), 322-359.
https://doi.org/10.21203/rs.3.rs-50795/v1 |
| [29] | Tebege, E. G., Molla, Z., Takele, S. G., & Jothimani, M. (2025). Geospatial mapping and multi-criteria analysis of groundwater potential in Libo Kemkem watershed, upper Blue Nile River basin, Ethiopia. Scientific African, 27, Article e02549.
https://doi.org/10.1016/j.sciaf.2025.e02549 |
[10, 12, 29]
. Based on the significance of each theme layer to groundwater potential, the Pairwise Comparison Matrix (PCM) was constructed, and weights were determined for each thematic layer. PCM evaluates the significance of two layers, one of which has a bigger impact on groundwater occurrence than the other. In this study, a nine-by-nine comparison matrix with rankings from 1 to 9 was employed. Equation (
3) states that the extremely important characteristic is assigned a greater value (rank), while the less important factors are awarded a lesser value (
Table 13).
Table 13.
Pairwise comparison matrix for the relative weight of thematic layers based on the research area's hydrology specialists, literature, and geology. Criteria | SL | RF | DD | LD | GM | LT | SO | LULC | DE | Weight |
SL | 1 | 2 | 3 | 4 | 5 | 6 | 7 | 8 | 9 | 0.31 |
RF | 1/2 | 1 | 2 | 3 | 4 | 5 | 6 | 7 | 8 | 0.22 |
DD | 1/3 | ½ | 1 | 2 | 3 | 4 | 5 | 6 | 7 | 0.15 |
LD | 1/4 | 1/3 | ½ | 1 | 2 | 3 | 4 | 5 | 6 | 0.11 |
GM | 1/5 | ¼ | 1/3 | ½ | 1 | 2 | 3 | 4 | 5 | 0.08 |
LT | 1/6 | 1/5 | ¼ | 1/3 | ½ | 1 | 2 | 3 | 4 | 0.05 |
SO | 1/7 | 1/6 | 1/5 | ¼ | 1/3 | ½ | 1 | 2 | 3 | 0.04 |
LULC | 1/8 | 1/7 | 1/6 | 1/5 | ¼ | 1/3 | 1/2 | 1 | 2 | 0.03 |
DE | 1/9 | 1/8 | 1/7 | 1/6 | 1/5 | ¼ | 1/3 | 1/2 | 1 | 0.02 |
Total | 2.829 | 4.718 | 7.593 | 11.45 | 16.283 | 22.083 | 28.833 | 36.5 | 45 | |
SL = Slope, RF= Rainfall, DD= Drainage density, LD= lineament Density, GM=Geomorphology, LT=lithology, SO= Soil, LULC= Land use Land cover, and DE= Depth
3.2. Normalization Weight
Equation (
5), which is computed by averaging the values in each row to obtain the corresponding ranking and the outcomes of normalized weights of each parameter, was used to normalize the weights. According to the outcome, compared to other factors, the observed slope has the highest value (
Table 13). Since a higher infiltration rate leads to a greater contribution for groundwater recharge and high groundwater potential zones, it suggests that a lower slope has a low chance of runoff. On the other hand, a high slope suggests poor groundwater potential because of quick runoff.
3.3. Principal Eigenvector and Consistency Ratio
Equations (
7) and (
8) were used to determine the primary eigenvector value (λmax) in order to calculate the consistency ratio (equation (
6)) and verify the weight allocated to each parameter in the normalized weight matrix (
Table 13). The primary eigenvector value (λmax) was calculated by multiplying the total value of the same thematic layer obtained in the pairwise comparison matrix (as shown in
Table 13) by the weight of each thematic layer (as shown in
Table 13). For instance, the total slope value in the PCM column, 2.829, is multiplied by the normalized weight of slope, 0.31 (
Table 13).
Table 14.
Consistency Ratio, Consistency Index, and Principal Eigenvector. Criteria | Normalized Weight | Total value of each column in the PCM | Principal Eigenvectors | Consistency Index (CI) | Consistency Ratio (CR) |
Slope | 0.31 | 2.83 | 0.87 | | |
Rainfall | 0.22 | 4.72 | 1.03 | | |
Drainage density | 0.15 | 7.59 | 1.17 | | |
Lineament Density | 0.11 | 11.45 | 1.25 | | |
Geomorphology | 0.08 | 16.28 | 1.24 | | |
Lithology | 0.05 | 22.08 | 1.18 | | |
Soil | 0.04 | 28.83 | 1.07 | | |
LULC | 0.03 | 36.50 | 0.95 | | |
Depth | 0.02 | 45.00 | 0.85 | | |
| | | λmax = 10 | 0.123 | 0.09 |
In order to determine the consistency ratio, the consistency index was calculated using equation (
7), yielding a consistency index of 0.13. The consistency ratio (CR) = 0.09 was the computed result after the consistency ratio was determined using equation (
6). Since CR is greater than 0 and less than 0.1, the weights provided were appropriate for additional analysis.
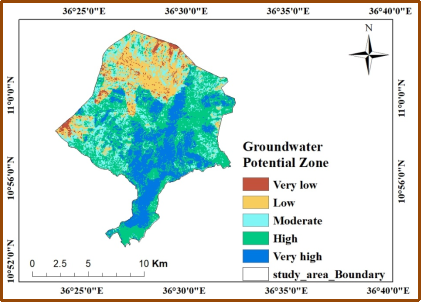
3.4. Groundwater Potential Zone Map
The study area's groundwater potential zone was determined by integrating all thematic maps according to how each contributed to the delineation of groundwater potential zones. Using a weighted linear combination, all nine thematic maps were superimposed to create the groundwater potential zones. The ArcGIS spatial analysis tool was used to integrate thematic maps according to their weights. Equation (
8) was used to calculate each layer in order to create the groundwater potential zone map.
GWPZ = (0.31*SL) + (0.22*RF) + (0.15*DD) + (0.11*LD) + (0.08*GM) + (0.05*LT) + (0.04*SO) + (0.03*LULC) + (0.02*DE)
Where Groundwater Potential Zone, SL = slope, RF = rainfall, DD = drainage density, LD = lineament density, GM = geomorphology, LT = lithology, SO = soil, LULC = land use/land cover, and DE = depth.
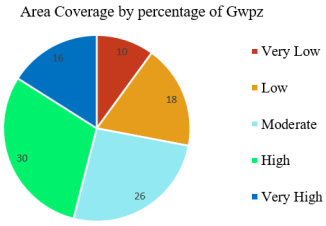
Using the natural breaks categorization technique in the ArcGIS environment, the groundwater potential zone findings from 1.76 to 4.93 have been divided into five potential zones. According to
Table 15 and
Figure 13, the groundwater potential values were classified as very high (16%), high (30%), moderate (26%), low (18%), and very low (10%). The northern and western regions of the research area, which have extremely steep slopes, mountains, tertiary basaltic rocks, and clay soils, are mostly home to very low and low groundwater potential zones, which make up around 28% of the total area, or 33 km². On the other hand, high to very high groundwater potential zones cover around 46 percent, or 69 km², of areas found along the southern, eastern, and central parts of the study area, which have flat slopes, high rainfall, flat land, and deposits of quaternary lava (
Figure 12).
Groundwater availability is typically higher in settlements situated in regions with high water tables, sufficient precipitation, and favorable Quaternary deposit geological conditions. Significant groundwater resources are also more likely to exist in areas with permeable and porous soil or rock formations like quaternary deposits, which are highly weathered.
It's crucial to remember that local geological and hydrological circumstances can have a significant impact on groundwater potential. More precise and detailed information regarding the groundwater potential for a given community could be obtained by carrying out a hydrogeological survey.
Table 15.
Groundwater potential zones and their respective areal coverage. | Potential zone | Areal coverage | Percentage |
Groundwater Potential zone | Very Low | 15 | 10 |
Low | 28 | 18 |
Moderate | 40 | 26 |
High | 45 | 30 |
Very High | 24 | 16 |
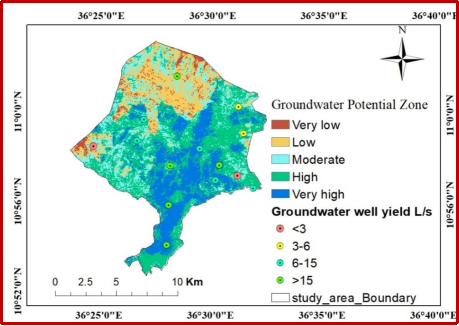
3.5. Validation of Groundwater Potential Map
Groundwater points, which comprised 14 wells gathered from the field and water and sanitation offices of the research region, were used to validate the groundwater potential zone results. The classified groundwater potential zone map was superimposed with the well yield data that had been gathered. Since there is no set criteria for classifying groundwater yield potential, groundwater yield data were divided into various groups for validation purposes
| [12] | Zelalem Leyew, Melkamu Meseret, Getnet Taye, Alebachew Tareke, Mulugeta Chanie, and Minyahl Teferi. Appraising groundwater potential zones using geospatial and multi-criteria decision analysis (MCDA) techniques in the Andasa-Tul watershed, Upper Blue Nile basin, Ethiopia. Research Square journal, (2020), 11(2), 322-359.
https://doi.org/10.21203/rs.3.rs-50795/v1 |
| [24] | Salwa, F. An overview of integrated remote sensing and GIS for groundwater mapping in Egypt. Ain Shams Engineering Journal, (2015), 6(1), 1-15.
https://doi.org/10.1016/j.asej.2014.08.008 |
| [26] | Hamza Abrar, Abiyot Legesse Kura, Engida Esayas Dube & Dereje Likisa Beyene AHP-based analysis of groundwater potential in the western escarpment of the Ethiopian Rift Valley. Geology, Ecology, and Landscapes, (2021).
https://doi.org/10.1080/24749508.2021.1952763 |
[12, 24, 26]
. Four categories of groundwater yield were used in these studies: very high yield (> 15 L/s), high yield (6 L/s-15 L/s), moderate yield (3 L/s-6 L/s), and low yield (< 3 L/s). Eleven of the fourteen wells in the study region match the expected map, while three do not. Thus, the result of the prediction shows 78.57% of the analysis is found to match well with the data collected (
Table 16 and
Figure 14).
Table 16.
Validation result. GWP zone | Expected groundwater yield | Expected wells in each GWP zone | Existing groundwater wells in each zone | Rate of accuracy |
Very low & Low | Less than 3L/s | 2 | 1 | 50% |
Moderate | 3 - 6L/s | 2 | 2 | 100% |
High | 6 -15L/s | 5 | 4 | 80% |
Very high | Greater than 15L/s | 5 | 4 | 80% |
Total | | 14 | 11 | 78.57% |
4. Conclusion and Recommendation
4.1. Conclusion
This study's objectives were to evaluate, locate, and define Chagni's and the surrounding area's groundwater potential zone. Long-term sustainable management and use of water resources is essential. The spatial variance of groundwater in the study area was investigated using GIS-based multi-criteria decision analysis. Using information from multiple sources that affect the spatial distribution of GWP zones, nine factor maps (thematic layers) were created and examined.
To delineate the GWP zones, thematic layers such as slope, rainfall, drainage density, lineament density, geomorphology, lithology, soil, land use/land cover, and groundwater depth are used.
Each thematic layer's weights were calculated and assigned using the Analytical Hierarchy Process (AHP). Slope and rainfall become the most influential factors for the occurrence of groundwater potential. While the existing groundwater depth found the lowest factor for identifying the GWP zones. According to the finding, the identified GWP zones were classified as very high (16%), high (30%), moderate (26%), low (18%), and very low (10 percent). The finding reveals the southern and northern parts of the area have very high GWP zones, particularly in areas of level slope, flat lands, and Quaternary volcanic rocks. The low and very low groundwater potential zones are found in the study's northern and western regions, which contain mountains and steep slope landforms. The outcome of the GWP zone map was validated using groundwater yield data. The validation result shows around 78.57% of the analyses were effective in predicting and matching the existing groundwater potential zones.
In this study, integrated GIS-based MCDA and remote sensing techniques were found to be a very useful, time-saving, and cost-effective tool for assessing and identifying groundwater potential zones. Geographic Information System's ability to analyze multiple thematic layers or factors was effective.
The people and government of Chagni town would especially benefit from the groundwater potential zone results. Residents can make well-informed decisions about water use, well drilling, and sustainable water management techniques by being aware of the groundwater potential zones in the area. This data can be used by local authorities to plan for drought mitigation techniques, water delivery infrastructure, and general water resource management in Chagni town. This information can assist in guaranteeing the community's long-term water supply and the sustainable use of groundwater resources.
4.2. Recommendation
For proper identification of groundwater potential areas, GIS and remote sensing methods are very important in the study area. Based on the result of the present study, the following recommendations were suggested:
As a result of population growth, the requirement of water for household consumption in the study area has been increasing. On the other hand, the town does not provide the required amount of drinking water for the population. Therefore, the concerned body should select the potential area to drill groundwater by considering multiple physical, geological, hydrological, and biophysical factors to improve the provision of water.
This study considers only nine physical, geological, hydrological, and biophysical factors to select the groundwater potential zone, but other factors also influence GWP zone identification and should be considered in evaluating criteria like climate factor, quality of the water, cost of construction, distance from users, and others.