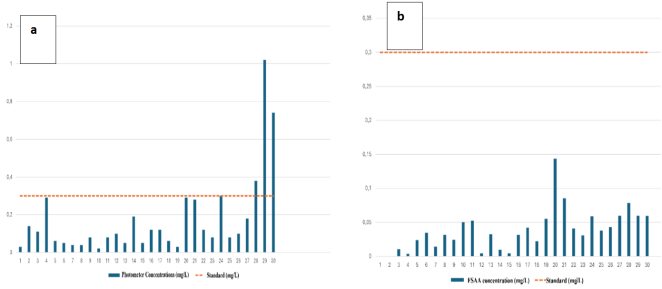
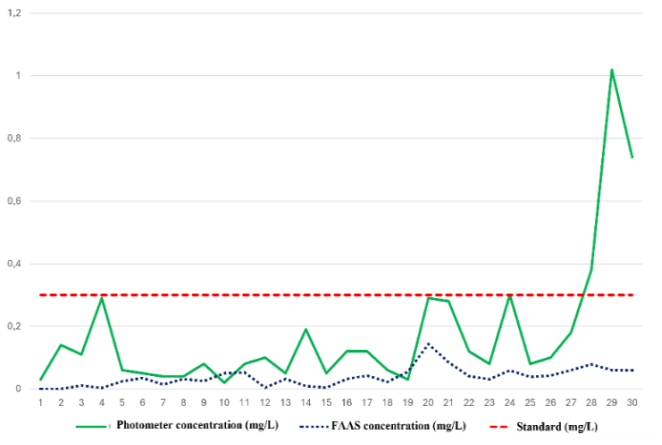
This study aimed to compare the performance of photometric analysis and flame atomic absorption spectrophotometry (FAAS) in determining iron concentrations in water samples. Thirty samples were collected from wells located in the Anani and Gonzacque-ville neighborhoods and analyzed using both techniques. Photometric results indicated that 26 out of 30 samples had iron concentrations below the Ivorian regulatory limit of 0.3mg/L, while three samples exceeded this threshold. In contrast, AAS measurements showed that all samples complied with the standard, with no exceedances recorded. Statistical analysis revealed a significant difference between the two methods, with photometric readings generally yielding higher iron concentrations than those obtained via AAS. This discrepancy highlights the importance of employing more precise analytical techniques such as FAAS for routine water quality monitoring, particularly when assessing critical parameters like iron.
| Published in | Science Journal of Analytical Chemistry (Volume 13, Issue 3) |
| DOI | 10.11648/j.sjac.20251303.11 |
| Page(s) | 63-67 |
| Creative Commons |
This is an Open Access article, distributed under the terms of the Creative Commons Attribution 4.0 International License (http://creativecommons.org/licenses/by/4.0/), which permits unrestricted use, distribution and reproduction in any medium or format, provided the original work is properly cited. |
| Copyright |
Copyright © The Author(s), 2025. Published by Science Publishing Group |
Photometer, Flame Atomic Absorption Spectrophotometer, Iron, Water
Sample number | Photometer assay (mg/l) | FAAS assay (mg/l) |
|---|---|---|
E1 | 0.03 | < at the detection limit |
E2 | 0.14 | < at the detection limit |
E3 | 0.11 | 0.0105 |
E4 | 0.29 | 0.0034 |
E5 | 0.06 | 0.0237 |
E6 | 0.05 | 0.0345 |
E7 | 0.04 | 0.0141 |
E8 | 0.04 | 0.0312 |
E9 | 0.08 | 0. 0245 |
E10 | 0.02 | 0.0502 |
E11 | 0.08 | 0.0520 |
E12 | 0.10 | 0,0044 |
E13 | 0.05 | 0,0319 |
E14 | 0.19 | 0,0094 |
E15 | 0.05 | 0,0043 |
E16 | 0.12 | 0,0318 |
E17 | 0.12 | 0,0424 |
E18 | 0.06 | 0,0223 |
E19 | 0.03 | 0,0550 |
E20 | 0.29 | 0,1435 |
E21 | 0.28 | 0,0851 |
E22 | 0.12 | 0,0409 |
E23 | 0.08 | 0,0308 |
E24 | 0.30 | 0,0588 |
E25 | 0.08 | 0,0378 |
E26 | 0.10 | 0,0425 |
E27 | 0.18 | 0,0596 |
E28 | 0.38 | 0,0781 |
E29 | 1.02 | 0,0596 |
E30 | 0.74 | 0,0592 |
Average | 0.174 | 0.038 |
Standard deviation | 0.217 | 0.030 |
Mean standard error | 0.039 | 0.005 |
FAAS | Flame Atomic Absorption Spectrophotometry |
| [1] | Water S D. Le droit à l’eau potable et à l’assainissement, sa mise en œuvre en Europe. Académie de l’Eau, 2012, 518 p. |
| [2] | Odoulami L. Problématique de l’eau potable et de la santé humaine dans la ville de Cotonou (République du Bénin) [thèse de doctorat]. Cotonou: Université d’Abomey-Calavi, 2009, 230 p. |
| [3] | Umvie. L’eau non potable: explication, conséquences et solutions. [consulté le 20 mai 2024]. Disponible sur: |
| [4] | DÉGBEY, Cyriaque, MAKOUTODE, Michel, OUENDO, Edgard-Marius, et al. La qualité de l’eau de puits dans la commune d’Abomey-Calavi au Bénin. Environnement, Risques & Santé, 2008, 4(7), p. 279-83. |
| [5] | Amin NC, N’kousse, Kpaibe SAP, Seki TO, Degny GS, Gbagbo TAG, Perception des ménages de la qualité de l’eau d’adduction publique en Côte d’Ivoire. Bulletin de Santé Publique de Côte d'Ivoire. 2024, 03(02), p 30-34. |
| [6] | Douglas A, Skoog F, James H, Stanley R. Principles of Instrumental Analysis. 7th ed. Cengage Learning, 27 janvier 2017, 992 p. |
| [7] | Makoutode M, Assani AK, Ouendo EM, et al. Qualité et mode de gestion de l’eau de puits en milieu rural au Bénin: Cas de la sous-préfecture de Grand-Popo. Médecine D’Afrique Noire. 1999, 46(11), p 528‑34. |
| [8] | Seki TO, Yapo TW, Kpaibe SAP, et al. Caractérisation physicochimique et microbiologique des eaux de puits à usage de boisson à Aboisso (sud-est de la Côte d’Ivoire). Int J Biol Chem Sci. 2024; 18(1), p 311-25. |
| [9] | WHO. Guidelines for drinking-water quality. WHO Chron. 2011; 38(4): 104 8. |
APA Style
André, K. S., Marcelle, Y., Nina, A., Simon, Y. J., Chimelle, O., et al. (2025). Evaluation of Two Spectrometric Approaches for Measuring Metal Concentrations in Drinking Water. Science Journal of Analytical Chemistry, 13(3), 63-67. https://doi.org/10.11648/j.sjac.20251303.11
ACS Style
André, K. S.; Marcelle, Y.; Nina, A.; Simon, Y. J.; Chimelle, O., et al. Evaluation of Two Spectrometric Approaches for Measuring Metal Concentrations in Drinking Water. Sci. J. Anal. Chem. 2025, 13(3), 63-67. doi: 10.11648/j.sjac.20251303.11
AMA Style
André KS, Marcelle Y, Nina A, Simon YJ, Chimelle O, et al. Evaluation of Two Spectrometric Approaches for Measuring Metal Concentrations in Drinking Water. Sci J Anal Chem. 2025;13(3):63-67. doi: 10.11648/j.sjac.20251303.11
@article{10.11648/j.sjac.20251303.11,
  author = {Kpaibé Sawa André and Yao Marcelle and Ablé Nina and Yao Jean Simon and Ogré Chimelle and Amin N’cho Christophe},
  title = {Evaluation of Two Spectrometric Approaches for Measuring Metal Concentrations in Drinking Water
},
  journal = {Science Journal of Analytical Chemistry},
  volume = {13},
  number = {3},
  pages = {63-67},
  doi = {10.11648/j.sjac.20251303.11},
  url = {https://doi.org/10.11648/j.sjac.20251303.11},
  eprint = {https://article.sciencepublishinggroup.com/pdf/10.11648.j.sjac.20251303.11},
  abstract = {This study aimed to compare the performance of photometric analysis and flame atomic absorption spectrophotometry (FAAS) in determining iron concentrations in water samples. Thirty samples were collected from wells located in the Anani and Gonzacque-ville neighborhoods and analyzed using both techniques. Photometric results indicated that 26 out of 30 samples had iron concentrations below the Ivorian regulatory limit of 0.3mg/L, while three samples exceeded this threshold. In contrast, AAS measurements showed that all samples complied with the standard, with no exceedances recorded. Statistical analysis revealed a significant difference between the two methods, with photometric readings generally yielding higher iron concentrations than those obtained via AAS. This discrepancy highlights the importance of employing more precise analytical techniques such as FAAS for routine water quality monitoring, particularly when assessing critical parameters like iron.
},
 year = {2025}
}
TY  - JOUR
T1  - Evaluation of Two Spectrometric Approaches for Measuring Metal Concentrations in Drinking Water

AU  - Kpaibé Sawa André
AU  - Yao Marcelle
AU  - Ablé Nina
AU  - Yao Jean Simon
AU  - Ogré Chimelle
AU  - Amin N’cho Christophe
Y1  - 2025/10/09
PY  - 2025
N1  - https://doi.org/10.11648/j.sjac.20251303.11
DO  - 10.11648/j.sjac.20251303.11
T2  - Science Journal of Analytical Chemistry
JF  - Science Journal of Analytical Chemistry
JO  - Science Journal of Analytical Chemistry
SP  - 63
EP  - 67
PB  - Science Publishing Group
SN  - 2376-8053
UR  - https://doi.org/10.11648/j.sjac.20251303.11
AB  - This study aimed to compare the performance of photometric analysis and flame atomic absorption spectrophotometry (FAAS) in determining iron concentrations in water samples. Thirty samples were collected from wells located in the Anani and Gonzacque-ville neighborhoods and analyzed using both techniques. Photometric results indicated that 26 out of 30 samples had iron concentrations below the Ivorian regulatory limit of 0.3mg/L, while three samples exceeded this threshold. In contrast, AAS measurements showed that all samples complied with the standard, with no exceedances recorded. Statistical analysis revealed a significant difference between the two methods, with photometric readings generally yielding higher iron concentrations than those obtained via AAS. This discrepancy highlights the importance of employing more precise analytical techniques such as FAAS for routine water quality monitoring, particularly when assessing critical parameters like iron.

VL  - 13
IS  - 3
ER  -
Department of Analytical Sciences and Public Health, Félix Houphouët-Boigny University, Abidjan, Côte d’Ivoire; Hygiene Laboratory, National Institute of Public Hygiene, Abidjan, Côte d’Ivoire
Department of Analytical Sciences and Public Health, Félix Houphouët-Boigny University, Abidjan, Côte d’Ivoire
Department of Analytical Sciences and Public Health, Félix Houphouët-Boigny University, Abidjan, Côte d’Ivoire
Department of Analytical Sciences and Public Health, Félix Houphouët-Boigny University, Abidjan, Côte d’Ivoire
Department of Analytical Sciences and Public Health, Félix Houphouët-Boigny University, Abidjan, Côte d’Ivoire; Hygiene Laboratory, National Institute of Public Hygiene, Abidjan, Côte d’Ivoire
Information