Groundwater quality assessment is critical for achieving Sustainable Development Goal 6 (SDG-6), which aims to ensure the availability and sustainable management of water and sanitation for all. In Burkina Faso, groundwater is a vital natural resource supporting socio-economic development, particularly in arid and semi-arid regions where water scarcity and quality are significant challenges. Climatic conditions in the country made of a long, hot and dry season followed by a short rainy period, result in considerable variability in water availability. Rapid population growth exacerbates these challenges by increasing water demand in both urban and rural areas; therefore, putting additional pressure on the already limited water resources. Moreover, the expansion of mining and agricultural activities further stresses these resources with contaminations from use of hazardous substances and over-extraction. The use of fertilizers and pesticides contributes to pollution, posing serious risks to human health and local ecosystems. Given the strategic importance of groundwater for Burkina Faso development amidst these growing challenges, a comprehensive understanding of groundwater quality is essential. This study focuses on the Eastern Region of Burkina Faso and aims to analyze the spatial distribution of physicochemical parameters related to groundwater quality in order to support sustainable water resource management and public health initiatives. Water samples from 42 sites were collected and analyzed for parameters such as pH, electrical conductivity (EC), total dissolved solids (TDS), and concentrations of calcium, magnesium, sodium, potassium, chloride, sulfate, bicarbonate, and nitrate. The data were processed using the Inverse Distance Weighted (IDW) interpolation method in ArcGIS 10.8 to produce spatial maps of these parameters. A Water Quality Index (WQI) was calculated to classify groundwater quality as "Excellent" (WQI < 50), "Good" (50 ≤ WQI ≤ 100), or "Poor" (WQI > 100). The results revealed significant spatial variability in groundwater quality with concentrations sometimes exceeding WHO-standards. Specifically, 38.10% of the analyzed samples exceeded the standard for nitrates while 28.57% of the samples show turbidity above recommended thresholds. TDS levels vary considerably, reaching maximum values of 1,336 mg/L and electrical conductivity values reached 1,336 µS/cm. These results demonstrate marked heterogeneity in water quality parameters across the region. The generated maps could serve as valuable tool for decision-makers to enable identification of areas requiring particular attention for groundwater quality management.
| Published in | American Journal of Environmental Protection (Volume 13, Issue 5) |
| DOI | 10.11648/j.ajep.20241305.14 |
| Page(s) | 147-161 |
| Creative Commons |
This is an Open Access article, distributed under the terms of the Creative Commons Attribution 4.0 International License (http://creativecommons.org/licenses/by/4.0/), which permits unrestricted use, distribution and reproduction in any medium or format, provided the original work is properly cited. |
| Copyright |
Copyright © The Author(s), 2024. Published by Science Publishing Group |
Physico-chemical Parameters, Water Quality Index, GIS, Statistical Analysis, East-Region, Burkina Faso
Sample N° | NO3- (mg/l) | Ca2+ (mg/l) | Mg2+ (mg/l) | Na+ (mg/l) | K+ (mg/l) | HCO3 (mg/l) | Cl- (mg/l) | SO42- (mg/l) | EC (S/m) | TDS (mg/l) | T (°C) | pH | Turbidity (NTU) |
|---|---|---|---|---|---|---|---|---|---|---|---|---|---|
S1 | 105.6 | 50.36 | 16.67 | 23.7 | 21.7 | 225.7 | 4.14 | 4.0 | 554 | 554 | 32 | 6.09 | 1.56 |
S2 | 51.48 | 17.04 | 20.33 | 6.00 | 1.00 | 124.44 | 1.7 | 2.0 | 207 | 208 | 31.3 | 6.04 | 0.46 |
S3 | 64.24 | 48,0 | 28.14 | 23.5 | 1.9 | 291.58 | 2.61 | 7.0 | 495 | 495 | 29.8 | 6.62 | 0 |
S4 | 107.8 | 53.16 | 27.68 | 14.4 | 1.00 | 197.8 | 3.24 | 2.0 | 527 | 527 | 31.6 | 6.92 | 0 |
S5 | 127.6 | 49.88 | 30.61 | 18.0 | 2.2 | 245.7 | 3.57 | 10.0 | 561 | 561 | 32.4 | 6.51 | 0.03 |
S6 | 73.48 | 88.32 | 51.74 | 35.3 | 3.2 | 488.6 | 3.55 | 10 | 850 | 850 | 32.1 | 7.03 | 0.53 |
S7 | 62.92 | 31.6 | 14.25 | 27.6 | 1.5 | 160.3 | 2.23 | 2.00 | 385 | 385 | 31.8 | 6.68 | 2.58 |
S8 | 93.28 | 51,0 | 21.90 | 6.0 | 0.8 | 205.5 | 2.6 | 5 | 494 | 494 | 33.7 | 6.93 | 0 |
S9 | 74.8 | 57.76 | 32.35 | 5.8 | 1 | 274.13 | 3.75 | 11 | 593 | 593 | 33.3 | 7.09 | 0.1 |
S10 | 51.04 | 55.16 | 31.14 | 22.9 | 3.00 | 318.42 | 2.25 | 2 | 542 | 542 | 31.4 | 7.02 | 0.87 |
S11 | 183.04 | 104.52 | 67.64 | 37.8 | 5.00 | 503.6 | 1.54 | 18 | 1173 | 1173 | 31.7 | 6.92 | 0.86 |
S12 | 59.84 | 34,0 | 21.61 | 20.9 | 1.2 | 189.1 | 2 | 4 | 398 | 398 | 31.1 | 6.61 | 1.13 |
S13 | 71.55 | 52,0 | 32.06 | 80.2 | 1 | 469.1 | 12.4 | 2 | 623 | 623 | 30.6 | 7.42 | 1.77 |
S14 | 68.64 | 55.2 | 33.08 | 19.5 | 0.6 | 338.92 | 1.7 | 6 | 572 | 572 | 31.2 | 7.07 | 2.58 |
S15 | 115.72 | 84.56 | 48.86 | 26.8 | 2.3 | 404.67 | 5.31 | 19 | 415 | 415 | 32 | 6.75 | 0.7 |
S16 | 3.96 | 31.96 | 6.41 | 6.7 | 1.2 | 139.08 | 0.77 | 5 | 190 | 190 | 29.6 | 7.73 | 60.6 |
S17 | 47.52 | 39.72 | 20.76 | 18.5 | 2.1 | 206.7 | 1.81 | 2 | 410 | 410 | 31.8 | 6.84 | 5.02 |
S18 | 8.8 | 25.96 | 24.34 | 11.1 | 0.9 | 209 | 0.68 | 2 | 301 | 301 | 33 | 6.83 | 1.55 |
S19 | 3.96 | 34.04 | 32.35 | 12 | 1.5 | 276.82 | 0.65 | 2 | 355 | 355 | 30.5 | 7.32 | 0.34 |
S20 | 1.32 | 38.2 | 23.38 | 3.8 | 0.8 | 265.96 | 1.5 | 2 | 338 | 338 | 33.8 | 7.3 | 0.74 |
S21 | 1.76 | 28.56 | 14.18 | 5.0 | 0.9 | 164.21 | 0.84 | 2 | 260 | 260 | 32.7 | 7 | 1.18 |
S22 | 0.44 | 45.92 | 24.37 | 54.9 | 1.3 | 419.9 | 0.73 | 22 | 721 | 721 | 32.4 | 7.32 | 1.85 |
S23 | 11.44 | 14.04 | 13.09 | 1.8 | 0.6 | 106.3 | 0.58 | 4 | 37.5 | 37.5 | 30.2 | 5.84 | 39.75 |
S24 | 15.4 | 15.32 | 24.05 | 2.1 | 1.3 | 148.23 | 0.76 | 3 | 92.2 | 92 | 27.2 | 5.91 | 101.8 |
S25 | 1.32 | 33.44 | 16.09 | 3.2 | 0.5 | 195.81 | 0.35 | 2 | 164.6 | 164.6 | 32.7 | 6.04 | 106.1 |
S26 | 0.88 | 50.8 | 12.83 | 5.1 | 0.9 | 235.46 | 0.58 | 2 | 342 | 342 | 33.01 | 6.66 | 2.04 |
S27 | 10.12 | 75.48 | 31.58 | 3.7 | 1.2 | 377.47 | 0.81 | 2 | 429 | 429 | 32.1 | 7.27 | 0.8 |
S28 | 9.68 | 26.36 | 12.61 | 3,00 | 2.4 | 152.5 | 0.49 | 2.0 | 207 | 207 | 29.4 | 6.96 | 14.96 |
S29 | 3.96 | 36.24 | 9.53 | 1.8 | 3.4 | 175.92 | 0.41 | 2.0 | 282 | 282 | 29.1 | 7 | 41.54 |
S30 | 10.56 | 29.28 | 9.46 | 9.4 | 1.2 | 164.7 | 1.02 | 2.0 | 228 | 228 | 32.1 | 6.56 | 4.22 |
S31 | 3.52 | 32.48 | 30.03 | 36.1 | 1.3 | 352.9 | 1,00 | 5.0 | 449 | 449 | 32.2 | 6.7 | 2.96 |
S32 | 2.64 | 20.64 | 38.38 | 13.8 | 1.5 | 275.72 | 0.79 | 3.0 | 376 | 376 | 32.9 | 7.05 | 2.87 |
S33 | 7.92 | 23.6 | 13.36 | 9.8 | 2.2 | 164.7 | 0.88 | 2.0 | 264 | 264 | 32.5 | 6.64 | 3.1 |
S34 | 6.6 | 54.6 | 45.04 | 29 | 3 | 404.9 | 0.73 | 2.00 | 561 | 561 | 31 | 6.94 | 4.17 |
S35 | 3.96 | 24.56 | 14.18 | 2.2 | 1.2 | 161.28 | 0.83 | 2.00 | 169 | 169 | 28.4 | 6.45 | 7.83 |
S36 | 10.56 | 50.32 | 35.48 | 7.6 | 0.7 | 347.33 | 1.58 | 3 | 520 | 520 | 31.6 | 7.03 | 2.16 |
S37 | 71.55 | 52,0 | 32.06 | 80.2 | 1 | 469.1 | 12.4 | 2 | 623 | 623 | 30.6 | 7.42 | 1.77 |
S38 | 10.56 | 12.8 | 17.74 | 4.2 | 0.7 | 141.40 | 0.55 | 2 | 158 | 158 | 31.9 | 6.13 | 2.2 |
S39 | 0.44 | 10.8 | 5.88 | 0.6 | 2.4 | 82.23 | 0.6 | 2 | 63.4 | 63 | 23.1 | 7.81 | 26.5 |
S40 | 7.04 | 28.16 | 17.13 | 7.1 | 0.9 | 194.71 | 0.53 | 2 | 224 | 224 | 27.8 | 6.36 | 6.36 |
S41 | 3.96 | 17.64 | 10.53 | 1.0 | 2.3 | 118.34 | 0.51 | 2 | 64.1 | 64 | 28.7 | 7.15 | 14.33 |
S42 | 0.44 | 125.72 | 75.48 | 18.1 | 70.8 | 859.2 | 0.85 | 2 | 1336 | 1336 | 30.7 | 6.9 | 85.12 |
Parameter | WHO (2011) Standard (Si) | Weightages factor (wi) | Relative weight (Wi) |
|---|---|---|---|
pH | 7,5 | 4 | 0.129 |
Total Dissolved Solids (TDS) | 500 | 4 | 0.129 |
Calcium (Ca2+) | 75 | 2 | 0.0645 |
Magnesium (Mg2+) | 30 | 2 | 0.0645 |
Sodium (Na+) | 200 | 2 | 0.0645 |
Potassium (K+) | 12 | 2 | 0.0645 |
Bicarbonate (HCO3-) | 500 | 3 | 0.0967 |
Chloride (Cl-) | 250 | 3 | 0.0967 |
Sulphate (SO42-) | 200 | 4 | 0.129 |
Nitrates (NO3-) | 50 | 5 | 0.1612 |
Total | - | 31 | 0.9996 |
WQI value | Water quality type |
|---|---|
< 50 | Excellent |
50 - 100 | Good |
100 - 200 | Poor |
Parameter | No | WHO standards (2011) | Concentration observed | No of samples out of WHO standards | Percentage (%) of samples exceed WHO standards | |||
|---|---|---|---|---|---|---|---|---|
Minimum | Mean | Maximum | SD | |||||
pH (-) | 42 | 6.5 - 8.5 | 5.84 | 6.83 | 7.81 | 0.46 | 8 | 19.04 |
EC (µS/cm) | 42 | 1000 | 37.5 | 417.95 | 1336 | 268.24 | 2 | 4.76 |
TDS (mg/L) | 42 | 1000 | 37.5 | 417.95 | 1336 | 268.25 | 2 | 4.76 |
Sodium (mg/L) | 42 | 200 | 0.6 | 17.15 | 80.2 | 18.81 | - | 0.00 |
Potassium (mg/L) | 42 | 12 | 0.5 | 3.70 | 70.8 | 11.08 | - | - |
Bicarbonate (mg/L) | 42 | 250 | 82.22 | 267.80 | 859.2 | 147.55 | - | - |
Chloride (mg/L) | 42 | 250 | 0.35 | 2.04 | 12.4 | 2.62 | - | 0.00 |
Nitrate (mg/L) | 42 | 50 | 0.44 | 37.41 | 183.04 | 44.78 | 16 | 38.10 |
Sulphate (mg/L) | 42 | 250 | 2 | 4.50 | 22 | 4.87 | - | 0.00 |
Calcium (mg/L) | 42 | 200 | 10.8 | 43.12 | 125.72 | 24.52 | 4 | 9.52 |
Magnesium (mg/L) | 42 | 50 | 5.88 | 25.92 | 75.47 | 15.13 | 3 | 7.14 |
Temperature (°C) | 42 | - | 23.1 | 31.11 | 33.08 | 2.00 | - | - |
Turbidity (NTU) | 42 | 5 | 0 | 13.21 | 106.1 | 26.99 | 12 | 28.57 |
AEG | Agence de l’Eau du Gourma/Gourma Water Agency |
ANTEA | French Firm Group Name on Engineering and Counselling |
BGR | Bundesanstalt für Geowissenschaften und Rohstoffe - German Federal Institute for Geosciences and Natural Resources |
BGS | British Geological Survey |
BRGM | Bureau de Recherches Géologiques et Minières/Geological and Mining Research Office |
DGRE | Direction Générale des Ressources en Eau/ General Directorate for Water Resources |
DO | Dissolved Oxygen |
°C | Degree Celsius |
EAWAG | Eidgenössische Anstalt für Wasserversorgung, Abwasserreinigung und Gewässerschutz - Swiss Federal Institute of Aquatic Science and Technology |
EC | Electrical Conductivity |
ECOWAS/CEDEAO | Economic Community Of West African States/Communauté Economique Des Etats de l’Afrique de l’Ouest |
ESA | European Space Agency |
GIS | Geographic Information System |
IDW | Inverse Distance Weighted |
IGRAC | International Groundwater Resources Assessment Centre |
LULC | Land Use Land Change |
MEF | Ministère de l'Environnement et des Forêts |
mg/L - mg/l | Milligrams Per Liter |
NTU | Nephelometric Turbidity Unit |
PANA | Programme d’Action National d’Adaptation aux Changements Climatiques |
pH | Potential of Hydrogen |
SDG-6 | Sixth Sustainable Development Goal |
TDS | Total Dissolved Solids |
µS/cm | Micro Siemens Per Centimeter |
UNESCO | United Nations Education, Science and Cultural Organization |
USGS: | United States Geological Survey |
WHO | World Health Organization |
WQI | Water Quality Index |
| [1] | Addo, M. A., Darko, E. O., Gordon, C & Nyarko, B. J. B. (2013). Water quality analysis and human health risk assessment of groundwater from open-wells in the vicinity of a cement factory at Akporkloe, Southeastern Ghana. e-Journal of Science & Technology, 8(4): 15-30. |
| [2] | Adhikary, P. P., Dash, C. J., Chandrasekharan, H., & Goswami, R. (2012). Assessment of groundwater quality for irrigation and drinking purpose in a certain part of the region using IDW interpolation technique. Environmental Monitoring and Assessment, 184(7), 4499–4517. |
| [3] | Anand, B., Karunanidhi, D., Subramani, T., Srinivasamoorthy, K. & Suresh, M. (2020). Long-term trend detection and spatiotemporal analysis of groundwater levels using GIS techniques in Lower Bhavani River basin, Tamil Nadu, India, Environment, Development, and Sustainability, 22 (2020) 2779–2800. |
| [4] | Aravindan S, Shankar K, Ganesh BP, Rajan KD (2010). Hydrogeochemical mapping of in the hard rock area of Gadilam River basin, using GIS technique. Tamil Nadu Indian J Appl Geochem 12(2): 209–216. Print ISSN: 0972-1967. |
| [5] | Belemtougri, A. P., Ducharne, A., & Karambiri, H. (2021). Improvement of river network representation in Africa: application of an approach based on digital elevation data and environmental characteristics. Proceedings of the International Association of Hydrological Sciences, 384, 19-23. |
| [6] | BGR, BGS, BRGM, EAWAG & UNESCO (2022). Ressources en eaux souterraines dans la région de la CEDEAO – Groundwater resources in the ECOWAS region. 1: 5 000 000. |
| [7] | Burrough, P. A., & McDonnell, R. A. (1998). Principles of Geographical Information Systems (2nd ed.). Oxford University Press. |
| [8] | Castaing C, Billa M, Milesi JP, Thieblemont D, Le Metour J, Egal E, Donzeau M (BRGM) (Coordonnateurs) et Guerrot C, Cochere A, Chevremont P, Egal E (BRGM), Zida B, Ouédraogo I, Koté S, Kaboré BE, Ouédraogo C (BUMIGEB), Ki JC, Zunino C (ANTEA) (2003). Notice explicative de la carte géologique et minière du Burkina Faso à 1/1000 000. |
| [9] | Catroll, D. (1962). Rain water as a chemical agent of geological process: a view. USGS water supply, 1533, 18-20. |
| [10] | Coulibaly P., Silga M., Mihin J. P. et Sauret E. S., (2019). Rapport de l’étude de la stratégie de suivi et d’évaluation des ressources en eau. Partie 1: Rapport Diagnostic. 240p. |
| [11] | Dandge, K. P., & Patil, S. S. (2022). Spatial distribution of ground water quality index using remote sensing and GIS techniques. Applied Water Science, 12, 1-18. |
| [12] | De Marsily, G. (1986). Quantitative hydrogeology; groundwater hydrology for engineers. Academic Press, Orlando, p 440. |
| [13] | Egereonu UU, Nwachukwu UL (2005). Evaluation of the surface and groundwater resources of Efuru River Catchment, Mbano, South Eastern. Nigeria J Assoc Adv Model Simulat Tech Enterpr 66: 53–71. |
| [14] | Heckmann M, Brugeron A, Ó’Dochartaigh BÈ & Lewis M (2022): Groundwater resources in the ECOWAS region. Expected aquifer productivity. Technical note, BGR, BGS, BRGM, EAWAG, IGRAC, & UNESCO. [EN]. |
| [15] |
Horton, R. K. (1965). An Index Number System for Rating Water Quality. Journal of the Water Pollution Control Federation, 37, 300-306.
http://www.scirp.org/(S(i43dyn45teexjx455qlt3d2q))/reference/Ref |
| [16] | Isaaks, E., Srivastava, R. (1989). An introduction to applied geostatistics. Oxford University Press, New York. |
| [17] | Jehan, S., Khan, S., Khattak, S. A., Muhammad, S., Rashid, A., & Muhammad, N. (2019). Hydrochemical properties of drinking water and their sources apportionment of pollution in Bajaur agency, Pakistan. Measurement, 139, 249-257. |
| [18] | Kawo, N. S. and Karuppannan, S. (2018). Groundwater quality assessment using water quality index and GIS technique in Modjo River Basin, central Ethiopia. Journal of African Earth Sciences, 147 (2018) 300–311. |
| [19] | Ministère de l'Environnement et des Forêts (MEF) (1999). Etude thématique sur le milieu physique. Rapport final. |
| [20] | MacDonald, A. M., Taylor, R. G. and Bonsor, C. H. (2013). (eds.) Groundwater in Africa – is there sufficient water to support the intensification of agriculture from “Land Grabs”." Hand book of land and water grabs in Africa, 9pp, p 376‐383., 2013. |
| [21] | Majumdar D, Gupta N (2000). Nitrate pollution of groundwater and associated human health disorders. Indian J Environ Health 42: 28–39. |
| [22] | Meireles, A. C. M., Andrade, E. Md., Chaves, L. C. G. (2010). A new proposal of the classification of irrigation water. Rev. Cien. Agron. 41: 349–57. |
| [23] | Mueller, T. G., Pusuluri, N. B., Mathias, K. K., Cornelius, P. L., Barnhisel, R. I., & Shearer, S. A. (2004). Map quality for ordinary kriging and inverse distance weighted interpolation. Soil Science Society of America Journal, 68(6), 2042-2047. |
| [24] | Oseke, F. I., Anornu, G. K., Adjei, K. A., & Eduvie, M. O. (2021). Assessment of water quality using GIS techniques and water quality index in reservoirs affected by water diversion. Water-Energy Nexus, 4, 25-34. |
| [25] | Ouedraogo, I., Vanclooster, M., (2016). A meta-analysis and statistical modelling of nitrates in groundwater at the African scale. In: Hydrology and Earth System Sciences, Vol. 20, no. 6, p. 2353- 2381. |
| [26] | PANA, (2007). Programme National d’adaptation à la variabilité et aux changements climatiques. Ministère de l’environnement et du cadre du vie, Burkina Faso. |
| [27] | Pius A, Jerome C, Sharma N (2012). Evaluation of groundwater quality in and around Peenya industrial area of Bangalore, South India using GIS techniques. Environ Monit Assess 184: 4067–407. |
| [28] | Podgorski, J., & Berg, M. (2020). Global threat of arsenic in groundwater. Science, 368(6493), 845-850. |
| [29] | Rao NS (2006). Nitrate pollution and its distribution in the groundwater of Srikakulam district, Andhra Pradesh, India. Environ Geol 51: 631–645. |
| [30] | Sadat-Noori SM, Ebrahimi K, Liaghat AM (2014). Groundwater quality assessment using the Water Quality Index and GIS in Saveh Nobaran aquifer. Iran Environ Earth Sci 71: 3827–3843. http://dx.doi.org/10.1007/s12665-013-2770-8 |
| [31] | Sandwidi W. J. P., (2007). Groundwater potential to supply population demand within the Kompienga dam basin in Burkina Faso. PhD thesis. ZEF, University of Bonn (Germany). ISBN 978-3-940124-04-3. |
| [32] | Sarfo, A. K., Karuppannan, S., (2020). Application of Geospatial Technologies in the COVID-19 Fight of Ghana, Transactions of Indian National Academy of Engineering 5, 193-204. |
| [33] | Shankar, K., Elangovan, G., Balamurugan, P., & Saravanan, R. (2022). Spatial distribution of Groundwater quality assessment using Water Quality Index and GIS techniques in Thanjavur Taluk, Thanjavur District, Tamil Nadu, India. Int J Civ Environ Agric Eng, 4(2), 32-58. http://dx.doi.org/10.34256/ijceae2212 |
| [34] | Sinha, S. N & Biswas, M. (2011). Analysis of physico-chemical characteristics to study the water quality of a lake in Kalyani, West Bengal. Asian Journal of Experimental. Biological Sciences, 2(1): 18-22. |
| [35] | Srivastava. A., Kr. R., Gupta. V., Agarwal. G., Srivastava. S., Singh. I. (2011). Water Quality Assessment of Ramganga River at Moradabad by Physico-Chemical Parameters Analysis. VSRD-TNTJ, 2(3): 119-127. |
| [36] | Tabios, G. Q., Salas, J. D. (1985). A comparative analysis of techniques for spatial interpolation of precipitation. JAWRA J Am Water Resour Assoc 21: 365–380. |
| [37] | Tiwari, K., Goyal, R., & Sarkar, A. (2017). GIS-based spatial distribution of groundwater quality and regional suitability evaluation for drinking water. Environmental Processes, 4, 645-662. |
| [38] | Tomczak, M. (1998). Spatial interpolation and its uncertainty using automated anisotropic inverse distance weighting (IDW) - Cross-Validation/Jackknife approach. J Geogr Inf Decis Anal 2: 18–30. |
| [39] | Venkataraman, T., & Manikumari, N. (2019). Spatial distribution of water quality parameters with using GIS. International Journal of Innovative Technology and Exploring Engineering (IJITEE) ISSN, 2278-3075. |
| [40] | WHO, World Health Organization (2011). Guidelines for drinking water quality. Switzerland, Geneva. |
| [41] | Xu, Y., and Usher, B. (2006). Groundwater pollution in Africa, Taylor&Francis/Balkema, The Netherlands. 353pp. |
| [42] | Zanaga, D., Van De Kerchove, R., Daems, D., De Keersmaecker, W., Brockmann, C., Kirches, G., Wevers, J., Cartus, O., Santoro, M., Fritz, S., Lesiv, M., Herold, M., Tsendbazar, N. E., Xu, P., Ramoino, F., Arino, O., (2022). ESA WorldCover 10 m 2021 v200. |
APA Style
Ouedraogo, I., Bambara, A., Sandwidi, W. J. P., Lele, R. F. (2024). Spatial Distribution Analysis of Groundwater Quality Parameters in the East Region of Burkina Faso Using GIS Techniques. American Journal of Environmental Protection, 13(5), 147-161. https://doi.org/10.11648/j.ajep.20241305.14
ACS Style
Ouedraogo, I.; Bambara, A.; Sandwidi, W. J. P.; Lele, R. F. Spatial Distribution Analysis of Groundwater Quality Parameters in the East Region of Burkina Faso Using GIS Techniques. Am. J. Environ. Prot. 2024, 13(5), 147-161. doi: 10.11648/j.ajep.20241305.14
AMA Style
Ouedraogo I, Bambara A, Sandwidi WJP, Lele RF. Spatial Distribution Analysis of Groundwater Quality Parameters in the East Region of Burkina Faso Using GIS Techniques. Am J Environ Prot. 2024;13(5):147-161. doi: 10.11648/j.ajep.20241305.14
@article{10.11648/j.ajep.20241305.14,
  author = {Issoufou Ouedraogo and Apolline Bambara and Wennegouda Jean Pierre Sandwidi and Rodrigue Fotie Lele},
  title = {Spatial Distribution Analysis of Groundwater Quality Parameters in the East Region of Burkina Faso Using GIS Techniques
},
  journal = {American Journal of Environmental Protection},
  volume = {13},
  number = {5},
  pages = {147-161},
  doi = {10.11648/j.ajep.20241305.14},
  url = {https://doi.org/10.11648/j.ajep.20241305.14},
  eprint = {https://article.sciencepublishinggroup.com/pdf/10.11648.j.ajep.20241305.14},
  abstract = {Groundwater quality assessment is critical for achieving Sustainable Development Goal 6 (SDG-6), which aims to ensure the availability and sustainable management of water and sanitation for all. In Burkina Faso, groundwater is a vital natural resource supporting socio-economic development, particularly in arid and semi-arid regions where water scarcity and quality are significant challenges. Climatic conditions in the country made of a long, hot and dry season followed by a short rainy period, result in considerable variability in water availability. Rapid population growth exacerbates these challenges by increasing water demand in both urban and rural areas; therefore, putting additional pressure on the already limited water resources. Moreover, the expansion of mining and agricultural activities further stresses these resources with contaminations from use of hazardous substances and over-extraction. The use of fertilizers and pesticides contributes to pollution, posing serious risks to human health and local ecosystems. Given the strategic importance of groundwater for Burkina Faso development amidst these growing challenges, a comprehensive understanding of groundwater quality is essential. This study focuses on the Eastern Region of Burkina Faso and aims to analyze the spatial distribution of physicochemical parameters related to groundwater quality in order to support sustainable water resource management and public health initiatives. Water samples from 42 sites were collected and analyzed for parameters such as pH, electrical conductivity (EC), total dissolved solids (TDS), and concentrations of calcium, magnesium, sodium, potassium, chloride, sulfate, bicarbonate, and nitrate. The data were processed using the Inverse Distance Weighted (IDW) interpolation method in ArcGIS 10.8 to produce spatial maps of these parameters. A Water Quality Index (WQI) was calculated to classify groundwater quality as "Excellent" (WQI  100). The results revealed significant spatial variability in groundwater quality with concentrations sometimes exceeding WHO-standards. Specifically, 38.10% of the analyzed samples exceeded the standard for nitrates while 28.57% of the samples show turbidity above recommended thresholds. TDS levels vary considerably, reaching maximum values of 1,336 mg/L and electrical conductivity values reached 1,336 µS/cm. These results demonstrate marked heterogeneity in water quality parameters across the region. The generated maps could serve as valuable tool for decision-makers to enable identification of areas requiring particular attention for groundwater quality management.
},
 year = {2024}
}
TY  - JOUR
T1  - Spatial Distribution Analysis of Groundwater Quality Parameters in the East Region of Burkina Faso Using GIS Techniques

AU  - Issoufou Ouedraogo
AU  - Apolline Bambara
AU  - Wennegouda Jean Pierre Sandwidi
AU  - Rodrigue Fotie Lele
Y1  - 2024/10/31
PY  - 2024
N1  - https://doi.org/10.11648/j.ajep.20241305.14
DO  - 10.11648/j.ajep.20241305.14
T2  - American Journal of Environmental Protection
JF  - American Journal of Environmental Protection
JO  - American Journal of Environmental Protection
SP  - 147
EP  - 161
PB  - Science Publishing Group
SN  - 2328-5699
UR  - https://doi.org/10.11648/j.ajep.20241305.14
AB  - Groundwater quality assessment is critical for achieving Sustainable Development Goal 6 (SDG-6), which aims to ensure the availability and sustainable management of water and sanitation for all. In Burkina Faso, groundwater is a vital natural resource supporting socio-economic development, particularly in arid and semi-arid regions where water scarcity and quality are significant challenges. Climatic conditions in the country made of a long, hot and dry season followed by a short rainy period, result in considerable variability in water availability. Rapid population growth exacerbates these challenges by increasing water demand in both urban and rural areas; therefore, putting additional pressure on the already limited water resources. Moreover, the expansion of mining and agricultural activities further stresses these resources with contaminations from use of hazardous substances and over-extraction. The use of fertilizers and pesticides contributes to pollution, posing serious risks to human health and local ecosystems. Given the strategic importance of groundwater for Burkina Faso development amidst these growing challenges, a comprehensive understanding of groundwater quality is essential. This study focuses on the Eastern Region of Burkina Faso and aims to analyze the spatial distribution of physicochemical parameters related to groundwater quality in order to support sustainable water resource management and public health initiatives. Water samples from 42 sites were collected and analyzed for parameters such as pH, electrical conductivity (EC), total dissolved solids (TDS), and concentrations of calcium, magnesium, sodium, potassium, chloride, sulfate, bicarbonate, and nitrate. The data were processed using the Inverse Distance Weighted (IDW) interpolation method in ArcGIS 10.8 to produce spatial maps of these parameters. A Water Quality Index (WQI) was calculated to classify groundwater quality as "Excellent" (WQI  100). The results revealed significant spatial variability in groundwater quality with concentrations sometimes exceeding WHO-standards. Specifically, 38.10% of the analyzed samples exceeded the standard for nitrates while 28.57% of the samples show turbidity above recommended thresholds. TDS levels vary considerably, reaching maximum values of 1,336 mg/L and electrical conductivity values reached 1,336 µS/cm. These results demonstrate marked heterogeneity in water quality parameters across the region. The generated maps could serve as valuable tool for decision-makers to enable identification of areas requiring particular attention for groundwater quality management.

VL  - 13
IS  - 5
ER  -
Mining Engineering Department, University Yembila-Abdoulaye-TOGUYENI, Fada N' Gourma, Burkina Faso; Geosciences and Environment Laboratory, Joseph KI-ZERBO University, Ouagadougou, Burkina Faso
Water Department, Sahara and Sahel Observatory, Tunis, Tunisia
Mining Engineering Department, University Yembila-Abdoulaye-TOGUYENI, Fada N' Gourma, Burkina Faso; Geosciences and Environment Laboratory, Joseph KI-ZERBO University, Ouagadougou, Burkina Faso
Geosciences and Environment Laboratory, Joseph KI-ZERBO University, Ouagadougou, Burkina Faso
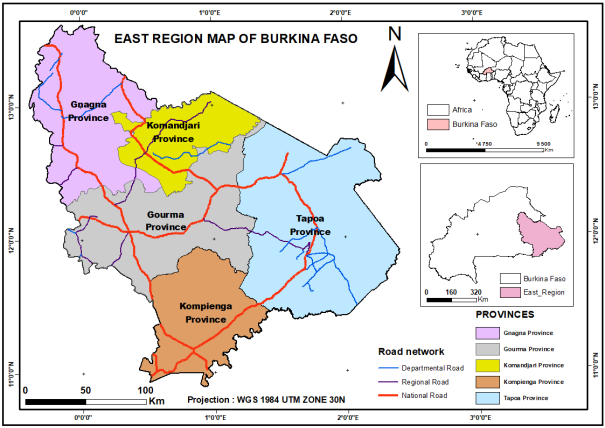
Figure 1. Location of the study area in Burkina Faso.
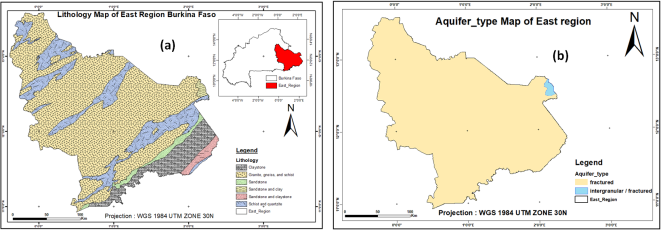
Figure 2. (a) The geology map and (b) Aquifer flow type of the study area.
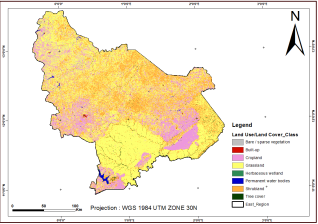
Figure 3. Land use map in East Region.
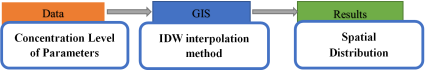
Figure 4. Methodology flowchart used in the study.
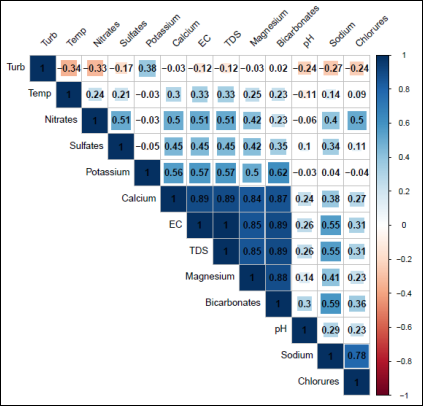
Figure 5. Correlation matrix of water quality parameters.
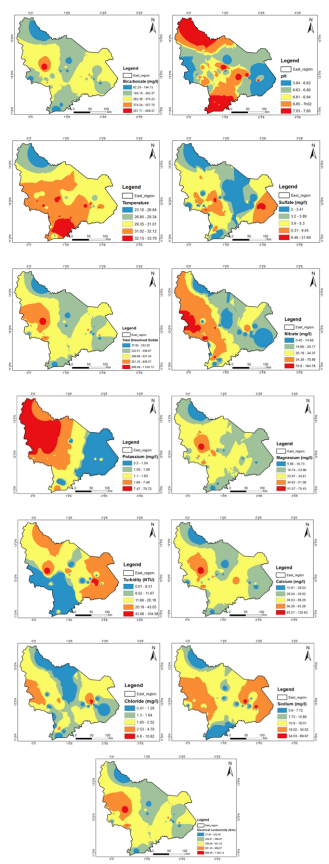
Figure 6. Spatial distribution map of seven parameters of water quality in East Region.
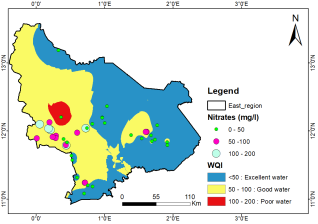
Figure 7. Spatial distribution of WQI in the East Region of Burkina Faso.
Information

