
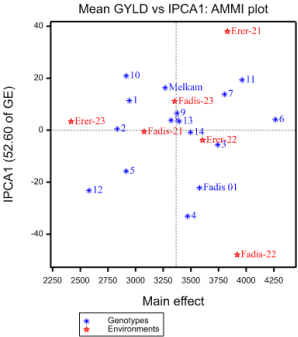
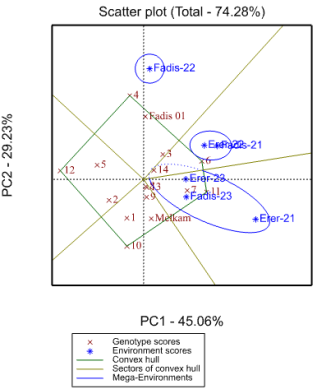
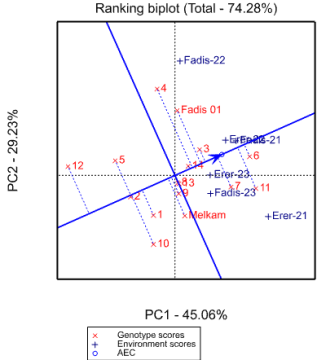
Sorghum (Sorghum bicolor (L.) Moench) is a critical staple cereal in semi-arid tropics, yet its productivity is highly constrained by genotype × environment interaction (GEI), which complicates variety selection and recommendation. This study aimed to estimate the magnitude of GEI, evaluate grain yield performance, and identify stable, high-yielding and early-maturing sorghum genotypes for potential release in East Hararghe, Ethiopia. Fourteen sorghum genotypes alongside two standard checks (Fadis 01 and Melkam) were tested across six environments, combining two locations (Fadis and Erer) over three consecutive main cropping seasons (2022–2024) using a randomized complete block design with three replications. Data on grain yield and agronomic traits were subjected to combined analysis of variance, Additive Main Effects and Multiplicative Interaction (AMMI) analysis, and Genotype Main Effect plus GEI (GGE) biplot analysis. Combined ANOVA revealed highly significant (P < 0.001) effects for genotype, environment, and GEI, confirming differential genotypic responses across testing environments. AMMI analysis partitioned the total grain yield variation, attributing 18.54% to genotype, 25.15% to environment, and 28.86% to GEI, indicating that environmental factors and their interaction with genotypes were the dominant sources of variation. The first two interaction principal component axes (IPCA1 and IPCA2) jointly explained 75.56% of the GEI variation, with IPCA1 contributing 52.6% and IPCA2 contributing 22.96%. Genotype G6 (ETSC14576-5-1) recorded the highest mean grain yield (4265 kg ha⁻¹) and demonstrated exceptional stability across environments, as evidenced by its proximity to the IPCA zero line in the AMMI1 biplot, favorable AMMI stability value, and low genotype selection index. GGE biplot analysis further ranked G6 closest to the ideal genotype, confirming its superior mean performance and stability. Polygon view identified three mega-environments, with G6 emerging as the winning genotype in one of them. Based on the integrated assessment using mean yield, AMMI parameters, and GGE biplot outputs, genotype ETSC14576-5-1 (G6) is identified as the most stable and high-yielding genotype across the tested environments. Therefore, this genotype is recommended for variety verification and subsequent release for cultivation in East Hararghe and similar agro-ecologies.
| Published in | American Journal of Bioscience and Bioengineering (Volume 14, Issue 4) |
| DOI | 10.11648/j.bio.20261404.13 |
| Page(s) | 67-74 |
| Creative Commons |
This is an Open Access article, distributed under the terms of the Creative Commons Attribution 4.0 International License (http://creativecommons.org/licenses/by/4.0/), which permits unrestricted use, distribution and reproduction in any medium or format, provided the original work is properly cited. |
| Copyright |
Copyright © The Author(s), 2026. Published by Science Publishing Group |
AMMI, GGE, Genotypes, Grain Yield, Sorghum, Stability
Genotype Code | Genotype | Pedigree |
|---|---|---|
G1 | ETSC14793-1-1 | ICSR56/13sudanint#27 |
G2 | ETSC15376-4-1 | WSV387/(P9404/2372) |
G3 | ETSC14828-3-3 | SILA/13sudanint#14 |
G4 | ETSC14596-4-1 | Meko-1/13sudanint#27 |
G5 | ETSC14577-9-7 | Dekeba/13sudanint#11-3 |
G6 | ETSC14576-5-1 | Meko-1/13sudanint#11-3 |
G7 | ETSC14725-3-2 | 13MIF5#5024/13sudanint#27 |
G8 | ETSC14719-1-4 | (Meko-1/SRN39)/13sudanint#14 |
G9 | ETSC14590-1-1 | Gambella1107/13sudanint#13-2 |
G10 | ETSC14214-7-3 | SILA/SRN39 |
G11 | ETSC14252-4-1 | ETSL101866/S35 |
G12 | ETSC14726-1-1 | 13MIF5#5076/13sudanint#27 |
G13 | ETSC14669-3-1 | Mominay4/13sudanint#14 |
G14 | ETSC14652-2-2 | Tseadachimure/13sudanint#13-2 |
- | Fadis 01 | M-36121 X P-9403 |
- | Melkam | WSV387 |
Source | Df | SS | MS |
|---|---|---|---|
Genotype (G) | 15 | 55,266,900 | 3,684,460*** |
Location (L) | 1 | 2,670,893 | 2,670,893* |
Year (Y) | 2 | 37,461,217 | 18,730,608*** |
G × L | 15 | 14,758,997 | 983,933* |
G × Y | 30 | 41,839,508 | 1,394,650*** |
L × Y | 2 | 31,585,562 | 15,792,781*** |
G × L × Y | 30 | 23,530,589 | 784,353* |
Residual | 190 | 73,204,131 | 385,285 |
Genotype Codes | GYLD (kg ha-1) | DTF | DTM | PLH (cm) | PL (cm) |
|---|---|---|---|---|---|
G1 | 2944.23 fg | 85.3 b | 138.3 a | 216 ab | 27.1 a |
G2 | 2835.08 g | 81.4 e-g | 137.1 ab | 175.2 h | 24.3 ef |
G3 | 3743.77 b-d | 79 h | 137.1 ab | 180 f-h | 25.3 c-e |
G4 | 3470.22 c-e | 79.6 gh | 136.7 a-c | 187.8 e-g | 25.4 b-e |
G5 | 2915.52 fg | 82.5 c-f | 135.7 b-d | 224.7 a | 25.8 a-e |
G6 | 4265.5 a | 82 c-f | 135.5 b-d | 179.5 f-h | 23.8 fg |
G7 | 3805.48 bc | 80.4 f-h | 135.2 c-e | 191 ef | 25.7 a-e |
G8 | 3321.96 ef | 83.7 b-d | 135.1 c-f | 178.1 gh | 26 a-d |
G9 | 3374.28 de | 81.4 e-g | 134.8 d-f | 187.9 e-g | 22.6 g |
G10 | 2915.71 fg | 81.5 d-g | 134.6 d-f | 186.4 e-h | 24.4 ef |
G11 | 3963.24 ab | 78.5 h | 134.4 d-f | 195.5 de | 26 a-d |
G12 | 2579.53 g | 90.5 a | 134.4 d-f | 202.9 cd | 26.8 ab |
G13 | 3395.1 c-e | 82.3 c-f | 133.9 d-f | 211 bc | 26.2 a-d |
G14 | 3496.5 c-e | 83.1 b-e | 133.6 ef | 209.7 bc | 24.7 d-f |
Fadis 01 | 3579.35 b-e | 83.8 bc | 133.3 f | 182.2 f-h | 26.4 a-c |
Melkam | 3267.86 ef | 78.8 h | 130.4 g | 155.6 i | 27.1 a |
Mean | 3365.69 | 82.11 | 135.00 | 191.46 | 25.47 |
CV | 18.63 | 4.24 | 2.02 | 9.30 | 8.91 |
LSD | 413.01 | 2.29 | 1.80 | 11.73 | 1.49 |
Source | d.f. | SS | MS | G × E explained (%) | Cumulative (%) |
|---|---|---|---|---|---|
Genotypes | 15 | 55286032 | 3685735** | 18.54 | |
Environments | 5 | 75016883 | 15003377** | 25.15 | |
Block | 12 | 5441200 | 453433 ns | 1.82 | |
Interactions | 75 | 86163689 | 1148849** | 28.89 | |
IPCA 1 | 19 | 45323212 | 2385432** | 52.6 | 52.6 |
IPCA 2 | 17 | 19783021 | 1163707** | 22.96 | 75.56 |
IPCA 3 | 15 | 12576836 | 838456* | 14.6 | 90.16 |
Residuals | 11 | 242021 | 22002 |
|
|
Genotype Code | Environments | Mean | Yield adv. (%) | |||||
|---|---|---|---|---|---|---|---|---|
Erer-22 | Erer-23 | Erer-24 | Fadis-22 | Fadis-23 | Fadis-24 | |||
1 | 4011.9 | 3208.8 | 1988.9 | 2586.7 | 3027.7 | 2841.5 | 2944.3 | |
2 | 3403.3 | 3064.1 | 2333.3 | 2423.7 | 3365.3 | 2420.7 | 2835.1 | |
3 | 4029.6 | 3978.4 | 2788.9 | 3285.9 | 4619.8 | 3760 | 3743.8 | |
4 | 3035.3 | 4100.5 | 1800 | 3555.6 | 5710.7 | 2619.3 | 3470.2 | |
5 | 2714.1 | 3124.8 | 1800 | 2381.6 | 4278.6 | 3194.1 | 2915.5 | |
6 | 4508.1 | 4068.9 | 3977.8 | 4045.9 | 4452.7 | 4539.3 | 4265.5 | 16.1 |
7 | 5125.9 | 4097.3 | 2988.9 | 3324.4 | 3841.5 | 3454.8 | 3805.5 | |
8 | 4131.5 | 3693.3 | 1155.6 | 3043 | 3905.5 | 4003 | 3322.0 | |
9 | 4382.8 | 3489.3 | 3138.9 | 2240 | 3845.1 | 3149.6 | 3374.3 | |
10 | 3919.4 | 2940.6 | 1933.3 | 2478.8 | 2423.6 | 3798.5 | 2915.7 | |
11 | 5462.2 | 4373.4 | 2777.8 | 4029.6 | 3628.3 | 3508.1 | 3963.2 | |
12 | 1523.5 | 2461.7 | 2700 | 1863.7 | 3997.9 | 2930.4 | 2579.5 | |
13 | 4100.7 | 3617.5 | 1888.9 | 2782.2 | 3969.4 | 4011.9 | 3395.1 | |
14 | 3778.9 | 3979.9 | 2333.3 | 3585.2 | 3909 | 3392.6 | 3496.5 | |
Fadis 01 | 3362.3 | 4105 | 2333.3 | 3810.4 | 5142.1 | 2723 | 3579.4 | ---- |
Melkam | 3792.60 | 3389.60 | 2733.30 | 3792.60 | 2583.50 | 3315.60 | 3267.87 | |
Env. Mean | 3830.13 | 3605.82 | 2417.01 | 3076.83 | 3918.79 | 3353.90 | 3367.08 | |
Genotype Code | Y | rY | Wi | rWi | ASI | rASI | ASV | rASV | GSI |
|---|---|---|---|---|---|---|---|---|---|
G1 | 2944.229 | 12 | 598001 | 4 | 6.042552 | 8 | 26.31795 | 8 | 20 |
G2 | 2835.076 | 15 | 388191 | 3 | 1.185433 | 1 | 5.163077 | 1 | 16 |
G3 | 3743.774 | 4 | 165543 | 1 | 2.974903 | 4 | 12.957 | 4 | 8 |
G4 | 3470.222 | 7 | 5173311 | 16 | 17.87709 | 16 | 77.86253 | 16 | 23 |
G5 | 2915.524 | 14 | 1272615 | 8 | 8.305478 | 10 | 36.17398 | 10 | 24 |
G6 | 4265.453 | 1 | 896980 | 6 | 4.342021 | 5 | 18.91139 | 5 | 6 |
G7 | 3805.481 | 3 | 1171988 | 7 | 7.330157 | 9 | 31.92603 | 9 | 12 |
G8 | 3321.961 | 10 | 2100160 | 10 | 4.715615 | 7 | 20.53856 | 7 | 17 |
G9 | 3374.278 | 9 | 1587256 | 9 | 4.448973 | 6 | 19.37722 | 6 | 15 |
G10 | 2915.711 | 13 | 2252962 | 11 | 11.06646 | 13 | 48.19927 | 13 | 27 |
G11 | 3963.243 | 2 | 2266609 | 12 | 10.66702 | 12 | 46.45951 | 12 | 14 |
G12 | 2579.529 | 16 | 4645374 | 15 | 14.12807 | 15 | 61.53389 | 15 | 31 |
G13 | 3395.1 | 8 | 869839 | 5 | 2.174235 | 3 | 9.469741 | 3 | 11 |
G14 | 3496.501 | 6 | 309111 | 2 | 1.40731 | 2 | 6.12945 | 2 | 8 |
Fadis 01 | 3579.349 | 5 | 2637357 | 14 | 11.94346 | 14 | 52.01897 | 14 | 19 |
Melkam | 3267.86 | 11 | 2385935 | 13 | 8.698498 | 11 | 37.88575 | 11 | 22 |
AMMI | Additive Main Effects and Multiplicative Interaction |
ANOVA | Analysis of Variance |
ASV | AMMI Stability Value |
CV | Coefficient of Variation |
d.f. | Degree of Freedom |
DTF | Days to 50% Flowering |
DTM | Days to Physiological Maturity |
FAO | Food and Agriculture Organization |
G | Genotype |
GEI | Genotype × Environment Interaction |
GGE | Genotype Main Effects and Genotype × Environment Interaction |
GSI | Genotype Selection Index |
GYLD | Grain Yield |
IPCA | Interaction Principal Component Axis |
L | Location |
LSD | Least Significant Difference |
MGE | Mega-Environment |
MS | Mean Square |
PL | Panicle Length |
PLH | Plant Height |
SNNPR | Southern Nations, Nationalities, and Peoples' Region |
SS | Sum of Square |
Y | Year |
| [1] | Assefa, Y., Staggenborg, S. A., & Prasad, V. P. V. (2020). Grain sorghum water requirement and responses to drought stress: A review. Crop Science, 60(1), 1-17. |
| [2] | Bean, S. R., Wilson, J. D., Moreau, R. A., & Tilley, M. (2016). Sorghum and millets: Their role in human nutrition. In Sorghum and Millets (pp. 1-14). AACC International Press. |
| [3] | Bibi, A., Sadaqat, H. A., & Akram, H. M. (2010). Genetic variability, correlation and path coefficient analysis of some quantitative traits in sorghum (Sorghum bicolor L.). Pakistan Journal of Botany, 42(6), 3939-3946. |
| [4] | Crossa, J., Fox, P. N., Pfeiffer, W. H., Rajaram, S., & Gauch, H. G. (1991). AMMI adjustment for statistical analysis of an international wheat yield trial. Theoretical and Applied Genetics, 81(1), 27-37. |
| [5] | FAO. (2021). FAOSTAT Statistical Database. Food and Agriculture Organization of the United Nations, Rome, Italy. |
| [6] | Farshadfar, E. (2008). Incorporation of AMMI stability value and grain yield in a single non-parametric index (GSI) in bread wheat. Journal of Agricultural Science, 14(1), 1-12. |
| [7] | Gauch, H. G., & Zobel, R. W. (1996). AMMI analysis of yield trials. In Genotype-by-Environment Interaction (pp. 85-122). CRC Press. |
| [8] | Kebede, H. (1991). Sorghum production in Ethiopia: Opportunities and constraints. Ethiopian Journal of Agricultural Sciences, 13(1), 1-14. |
| [9] | Nyoni, J., Mwambene, P., & Mwangi, M. (2020). Sorghum production in Sub-Saharan Africa: Challenges and opportunities. African Journal of Agricultural Research, 15(3), 321-330. |
| [10] | Purchase, J. L., Hatting, H., & Van Deventer, C. S. (2000). Genotype × environment interaction of winter wheat (Triticum aestivum L.) in South Africa: II. Stability analysis of yield performance. South African Journal of Plant and Soil, 17(3), 101-107. |
| [11] | Serna-Saldivar, S. O., Espinosa-Ramírez, J., & Pérez-Carrillo, E. (2019). Sorghum and millets: Grain quality and nutritional properties. In Sorghum and Millets: Chemistry, Technology, and Nutritional Attributes (pp. 1-25). AACC International Press. |
| [12] | Sharma, R. C., Morgounov, A. I., & Braun, H. J. (2010). Identifying high-yielding and stable wheat genotypes for the Central and West Asia and North Africa region. Euphytica, 173(1), 1-12. |
| [13] | Tirfessa, A., Adugna, A., & Tesso, T. (2023). Sorghum breeding and production in Ethiopia: A review. Journal of Crop Improvement, 37(2), 145-163. |
| [14] | Untung, O., Suwarno, W. B., & Trikoesoemaningtyas, S. (2015). AMMI analysis of rice genotype by environment interaction in Indonesia. Indonesian Journal of Agricultural Science, 16(1), 1-10. |
| [15] | Yan, W. (2001). GGE biplot—A Windows application for graphical analysis of multienvironment trial data and other types of two-way data. Agronomy Journal, 93(5), 1111-1118. |
| [16] | Yan, W., & Tinker, N. A. (2006). Biplot analysis of multi-environment trial data: Principles and applications. Canadian Journal of Plant Science, 86(3), 623-645. |
APA Style
Legesse, Z., Tadesse, F., Diribsa, B., Gudeta, J. (2026). AMMI Analysis for Grain Yield Stability of Early Maturing Sorghum Genotypes in East Hararghe, Ethiopia. American Journal of Bioscience and Bioengineering, 14(4), 67-74. https://doi.org/10.11648/j.bio.20261404.13
ACS Style
Legesse, Z.; Tadesse, F.; Diribsa, B.; Gudeta, J. AMMI Analysis for Grain Yield Stability of Early Maturing Sorghum Genotypes in East Hararghe, Ethiopia. Am. J. BioSci. Bioeng. 2026, 14(4), 67-74. doi: 10.11648/j.bio.20261404.13
@article{10.11648/j.bio.20261404.13,
  author = {Zeleke Legesse and Fikadu Tadesse and Berhanu Diribsa and Jifara Gudeta},
  title = {AMMI Analysis for Grain Yield Stability of Early Maturing Sorghum Genotypes in East Hararghe, Ethiopia},
  journal = {American Journal of Bioscience and Bioengineering},
  volume = {14},
  number = {4},
  pages = {67-74},
  doi = {10.11648/j.bio.20261404.13},
  url = {https://doi.org/10.11648/j.bio.20261404.13},
  eprint = {https://article.sciencepublishinggroup.com/pdf/10.11648.j.bio.20261404.13},
  abstract = {Sorghum (Sorghum bicolor (L.) Moench) is a critical staple cereal in semi-arid tropics, yet its productivity is highly constrained by genotype × environment interaction (GEI), which complicates variety selection and recommendation. This study aimed to estimate the magnitude of GEI, evaluate grain yield performance, and identify stable, high-yielding and early-maturing sorghum genotypes for potential release in East Hararghe, Ethiopia. Fourteen sorghum genotypes alongside two standard checks (Fadis 01 and Melkam) were tested across six environments, combining two locations (Fadis and Erer) over three consecutive main cropping seasons (2022–2024) using a randomized complete block design with three replications. Data on grain yield and agronomic traits were subjected to combined analysis of variance, Additive Main Effects and Multiplicative Interaction (AMMI) analysis, and Genotype Main Effect plus GEI (GGE) biplot analysis. Combined ANOVA revealed highly significant (P < 0.001) effects for genotype, environment, and GEI, confirming differential genotypic responses across testing environments. AMMI analysis partitioned the total grain yield variation, attributing 18.54% to genotype, 25.15% to environment, and 28.86% to GEI, indicating that environmental factors and their interaction with genotypes were the dominant sources of variation. The first two interaction principal component axes (IPCA1 and IPCA2) jointly explained 75.56% of the GEI variation, with IPCA1 contributing 52.6% and IPCA2 contributing 22.96%. Genotype G6 (ETSC14576-5-1) recorded the highest mean grain yield (4265 kg ha⁻¹) and demonstrated exceptional stability across environments, as evidenced by its proximity to the IPCA zero line in the AMMI1 biplot, favorable AMMI stability value, and low genotype selection index. GGE biplot analysis further ranked G6 closest to the ideal genotype, confirming its superior mean performance and stability. Polygon view identified three mega-environments, with G6 emerging as the winning genotype in one of them. Based on the integrated assessment using mean yield, AMMI parameters, and GGE biplot outputs, genotype ETSC14576-5-1 (G6) is identified as the most stable and high-yielding genotype across the tested environments. Therefore, this genotype is recommended for variety verification and subsequent release for cultivation in East Hararghe and similar agro-ecologies.},
 year = {2026}
}
TY  - JOUR
T1  - AMMI Analysis for Grain Yield Stability of Early Maturing Sorghum Genotypes in East Hararghe, Ethiopia
AU  - Zeleke Legesse
AU  - Fikadu Tadesse
AU  - Berhanu Diribsa
AU  - Jifara Gudeta
Y1  - 2026/07/30
PY  - 2026
N1  - https://doi.org/10.11648/j.bio.20261404.13
DO  - 10.11648/j.bio.20261404.13
T2  - American Journal of Bioscience and Bioengineering
JF  - American Journal of Bioscience and Bioengineering
JO  - American Journal of Bioscience and Bioengineering
SP  - 67
EP  - 74
PB  - Science Publishing Group
SN  - 2328-5893
UR  - https://doi.org/10.11648/j.bio.20261404.13
AB  - Sorghum (Sorghum bicolor (L.) Moench) is a critical staple cereal in semi-arid tropics, yet its productivity is highly constrained by genotype × environment interaction (GEI), which complicates variety selection and recommendation. This study aimed to estimate the magnitude of GEI, evaluate grain yield performance, and identify stable, high-yielding and early-maturing sorghum genotypes for potential release in East Hararghe, Ethiopia. Fourteen sorghum genotypes alongside two standard checks (Fadis 01 and Melkam) were tested across six environments, combining two locations (Fadis and Erer) over three consecutive main cropping seasons (2022–2024) using a randomized complete block design with three replications. Data on grain yield and agronomic traits were subjected to combined analysis of variance, Additive Main Effects and Multiplicative Interaction (AMMI) analysis, and Genotype Main Effect plus GEI (GGE) biplot analysis. Combined ANOVA revealed highly significant (P < 0.001) effects for genotype, environment, and GEI, confirming differential genotypic responses across testing environments. AMMI analysis partitioned the total grain yield variation, attributing 18.54% to genotype, 25.15% to environment, and 28.86% to GEI, indicating that environmental factors and their interaction with genotypes were the dominant sources of variation. The first two interaction principal component axes (IPCA1 and IPCA2) jointly explained 75.56% of the GEI variation, with IPCA1 contributing 52.6% and IPCA2 contributing 22.96%. Genotype G6 (ETSC14576-5-1) recorded the highest mean grain yield (4265 kg ha⁻¹) and demonstrated exceptional stability across environments, as evidenced by its proximity to the IPCA zero line in the AMMI1 biplot, favorable AMMI stability value, and low genotype selection index. GGE biplot analysis further ranked G6 closest to the ideal genotype, confirming its superior mean performance and stability. Polygon view identified three mega-environments, with G6 emerging as the winning genotype in one of them. Based on the integrated assessment using mean yield, AMMI parameters, and GGE biplot outputs, genotype ETSC14576-5-1 (G6) is identified as the most stable and high-yielding genotype across the tested environments. Therefore, this genotype is recommended for variety verification and subsequent release for cultivation in East Hararghe and similar agro-ecologies.
VL  - 14
IS  - 4
ER  -
Oromia Agricultural Research Institute (IQQO), Fadis Agriculture Research Center, Harar, Ethiopia
Oromia Agricultural Research Institute (IQQO), Fadis Agriculture Research Center, Harar, Ethiopia

Information



 Share This Article
 Twitter
 Linked In
 Facebook
 Copy
Copy Download