Proton magnetic resonance spectroscopy (1H-MRS) enables noninvasive in vivo detection of biochemical and neurotransmitter alterations in brain neurons, offering potential for early diagnosis of Alzheimer's disease (AD). This study investigates metabolite distribution patterns in bilateral frontal white matter and imaging biomarkers of early cognitive function across preclinical and prodromal stages of the AD continuum. A cohort of 362 right-handed participants underwent comprehensive neuropsychological assessments. Single-voxel 1H-MRS was employed to acquire metabolite spectra from bilateral frontal white matter, complemented by venous blood analysis for AD-associated genes and toxic proteins. Statistical analysis revealed the following key findings. Normal Controls (NC): (1) Higher relative concentrations of N-acetyl-aspartate/N-acetyl aspartyl-glutamate (NAA+NAAG) and glycerol-phosphocholine/phosphocholine (GPC+PCho) were observed in left versus right frontal white matter. (2) Age-related decline: NAA+NAAG levels in left frontal white matter demonstrated progressive reduction from younger to older age groups. (3) The elderly group exhibited significantly lower glutamate/glutamine (Glu+Gln) concentrations in left frontal white matter compared to middle-aged and younger groups. Mild Cognitive Impairment (MCI): (1) Inverse correlation between Auditory Verbal Learning Test (AVLT) scores and right frontal NAA+NAAG content. (2) Positive associations between Shape Trail Test (STT-A/B) completion times and right frontal myo-inositol (mIns) levels. Left frontal Glu+Gln concentrations correlated positively with plasma biomarkers: amyloid β-protein (Aβ1-42), total tau (t-tau), and phosphorylated tau181 (p-tau181). These 1H-MRS-detected metabolite alterations in bilateral frontal white matter may reflect both physiological brain aging and AD-related pathological changes, suggesting their utility as potential diagnostic indicators for early-stage AD. The integration of metabolic profiling with established biomarkers could enhance predictive accuracy in the AD continuum.
| Published in | Clinical Neurology and Neuroscience (Volume 10, Issue 2) |
| DOI | 10.11648/j.cnn.20261002.11 |
| Page(s) | 42-59 |
| Creative Commons |
This is an Open Access article, distributed under the terms of the Creative Commons Attribution 4.0 International License (http://creativecommons.org/licenses/by/4.0/), which permits unrestricted use, distribution and reproduction in any medium or format, provided the original work is properly cited. |
| Copyright |
Copyright © The Author(s), 2026. Published by Science Publishing Group |
Natural Aging, Subjective Cognitive Decline, Mild Cognitive Impairment, Proton Magnetic Resonance Spectroscopy, Neuro-metabolites, In Vivo
AD | Alzheimer's Disease |
Aβ | Amyloid β-protein |
ANOVA | Analysis of Variance |
AFT | Animal Fluency Test |
AVLT-H | Auditory Verbal Learning Test |
ApoE- ε 4 | Apolipoprotein E- ε 4 |
BNT | Boston Naming Test |
CU | Cognitively Unimpaired |
EHI | Edinburgh Handedness Inventory |
FAQ | Functional Activities Questionnaire |
GABA | γ-aminobutyric Acid |
GDS | Geriatric Depression Scale |
GLX | Glutamate Complex |
Glu | Glutamate |
Glu+Gln | Glutamate and Glutamine |
GPC | Glycerol-phosphocholine |
HAMD | Hamilton Depression Scale |
HAMA | Hamilton Anxiety Scale |
MCI | Mild Cognitive Impairment |
mIns | Myo-inositol |
NAA | N-acetylaspartate |
NAAG | N-acetyl Aspartyl-glutamate |
NC | Normal Control |
PCr | Phosphocreatine |
PCho | Phosphocholine |
PRESS | Point Resolved Spectroscopy |
p-tau181 | Phosphorylated Tau181 |
SCD | Subjective Cognitive Decline |
SCD-p | SCD-plus |
STT | Shape Trail Test |
tCR | Total Creatine |
t-tau | Total Tau |
Index | NC group (n=108) | SCD group (n=97) | SCD-Plus group (n=79) | MCI group (n=78) | P value |
|---|---|---|---|---|---|
Age (year) | 40.62±13.09 | 47.09±13.53a | 46.13±13.87 | 55.36±10.94abc | <0.001 |
Male/Female | 65/43 | 44/53 | 33/46 | 36/42 | 0.050 |
Education duration | 14.99±3.34 | 13.56±3.54a | 14.23±3.74 | 10.80±2.83abc | <0.001 |
Memory (Z value) | 0.79±1.33 | 0.56±1.50 | 0.23±1.56 | -2.03±1.43abc | <0.001 |
AVLT-N5 | 6.59±2.16 | 6.16±2.48 | 5.73±2.67 | 2.95±1.89abc | <0.001 |
AVLT-N7 | 22.20±1.55 | 22.07±1.72 | 21.66±1.78 | 18.99±2.24abc | <0.001 |
Execution (Z value) | 0.31±1.56 | 0.30±2.14 | 0.13±1.68 | -0.93±1.33abc | <0.001 |
STT-A (s) | 40.80±12.90 | 47.36±15.52a | 46.46±13.80 | 66.32±29.11abc | <0.001 |
STT-B (s) | 109.05±43.67 | 123.36±55.41 | 119.19±45.42 | 175.93±73.78abc | <0.001 |
Language (Z value) | 0.57±1.38 | 0.34±1.52 | 0.40±1.46 | -1.62±1.69abc | <0.001 |
AFT | 19.43±4.15 | 18.74±4.78 | 18.99±4.08 | 14.88±4.20abc | <0.001 |
BNT | 23.19±3.19 | 22.82±3.38 | 22.87±3.36 | 18.18±4.16abc | <0.001 |
Metabolite | Left | Right | P value |
|---|---|---|---|
NAA+NAAG | 1.54±0.20 | 1.38±0.18 | <0.001* |
GPC+PCh | 0.42±0.06 | 0.40±0.05 | 0.008* |
mIns | 0.99±0.21 | 1.06±0.22 | 0.052 |
Glu+Gln | 1.81±0.39 | 1.73±0.38 | 0.159 |
Index | Youth group (n=65) | Middle-aged group (n=30) | Older group (n=13) | P value | |
|---|---|---|---|---|---|
Gender (Male/Female) | 36/29 | 19/11 | 10/3 | 0.322 | |
Education duration (year) | 16.28±2.47 | 13.95±3.49a | 10.92±2.81ab | <0.001* | |
NAA+NAAG | L | 1.60±0.19 | 1.46±0.18a | 1.39±0.20ab | <0.001* |
R | 1.37±0.18 | 1.38±0.18 | 1.44±0.20 | 0.741 | |
GPC+PCh | L | 0.42±0.06 | 0.41±0.05 | 0.42±0.05 | 0.359 |
R | 0.39±0.06 | 0.41±0.04 | 0.42±0.05 | 0.087 | |
mIns | L | 0.94±0.21 | 1.07±0.17 | 1.09±0.23 | 0.078 |
R | 1.08±0.23 | 1.01±0.17 | 1.05±0.28 | 0.152 | |
Glu+Gln | L | 1.86±0.37 | 1.83±0.42 | 1.52±0.25ab | 0.008* |
R | 1.73±0.37 | 1.78±0.45 | 1.63±0.27 | 0.373 | |
Metabolite | Male (n=65) | Female (n=43) | P value | |
|---|---|---|---|---|
Aage (year) | 42.66±12.68 | 36.54±11.93 | 0.046* | |
Education duration (year) | 14.45±3.52 | 15.79±2.96 | 0.080 | |
NAA+NAAG | Left | 1.51±0.20 | 1.58±0.20 | 0.440 |
Right | 1.38±0.17 | 1.39±0.20 | 0.595 | |
GPC+PCh | Left | 0.42±0.05 | 0.42±0.06 | 0.896 |
Right | 0.40±0.05 | 0.39±0.05 | 0.843 | |
mIns | Left | 1.03±0.20 | 0.95±0.22 | 0.171 |
Right | 1.04±0.23 | 1.08±0.20 | 0.539 | |
Glu+Gln | Left | 1.85±0.36 | 1.75±0.43 | 0.068 |
Right | 1.75±0.44 | 1.71±0.29 | 0.479 | |
Group | Gender (Male/Female) | Age (year) | Education duration (year) | |
|---|---|---|---|---|
Youth group | NC (n=65) | 36/29 | 31.68±6.60 | 16.28±2.47 |
SCD (n=46) | 17/29 | 35.30±5.80 | 15.35±3.11 | |
SCD-P (n=41) | 19/22 | 34.56±5.64 | 15.13±3.40 | |
MCI (n=14) | 9/5 | 37.36±6.45 | 12.79±2.23 | |
P value | 0.161 | 0.002* | <0.001* | |
Middle-aged group | NC (n=30) | 19/11 | 49.93±4.32 | 13.95±3.49 |
SCD (n=30) | 19/11 | 51.30±3.98 | 12.77±2.98 | |
SCD-P (n=21) | 11/10 | 52.86±4.16 | 14.48±4.02 | |
MCI (n=34) | 12/22 | 53.71±3.60 | 10.40±3.10 | |
P value | 0.052 | 0.002* | <0.001* | |
Older group | NC (n=13) | 10/3 | 63.85±4.06 | 10.92±2.81 |
SCD (n=21) | 8/13 | 66.90±4.64 | 10.76±3.01 | |
SCD-P (n=17) | 3/14 | 65.71±5.19 | 11.76±3.23 | |
MCI (n=30) | 15/15 | 65.63±3.94 | 10.33±2.41 | |
P value | 0.011* | 0.194 | 0.559 | |
Group | NAA+NAAG | GPC+PCh | mIns | Glu+Gln | |||||
|---|---|---|---|---|---|---|---|---|---|
Left | Right | Left | Right | Left | Right | Left | Right | ||
Youth group | NC (n=65) | 1.60±0.19 | 1.37±0.18 | 0.42±0.06 | 0.39±0.06 | 0.94±0.21 | 1.08±0.23 | 1.86±0.36 | 1.73±0.38 |
SCD (n=46) | 1.60±0.16 | 1.39±0.16 | 0.42±0.06 | 0.39±0.06 | 0.95±0.18 | 0.96±0.17 | 1.87±0.28 | 1.77±0.35 | |
SCD-P (n=41) | 1.57±0.18 | 1.39±0.26 | 0.41±0.05 | 0.42±0.11 | 0.99±0.21 | 1.04±0.22 | 1.89±0.38 | 1.65±0.31 | |
MCI (n=14) | 1.56±0.19 | 1.37±0.17 | 0.41±0.05 | 0.41±0.07 | 0.98±0.24 | 1.06±0.18 | 1.85±0.30 | 1.71±0.30 | |
P value | 0.802 | 0.948 | 0.411 | 0.360 | 0.735 | 0.119 | 0.953 | 0.443 | |
Middle-aged group | NC (n=26) | 1.46±0.18 | 1.38±0.18 | 0.41±0.05 | 0.41±0.04 | 1.07±0.17 | 1.01±0.17 | 1.83±0.40 | 1.78±0.42 |
SCD (n=26) | 1.46±0.18 | 1.43±0.18 | 0.41±0.06 | 0.42±0.04 | 1.04±0.18 | 0.99±0.20 | 1.69±0.24 | 1.79±0.53 | |
SCD-P (n=18) | 1.44±0.19 | 1.41±0.17 | 0.45±0.06 | 0.41±0.05 | 1.06±0.18 | 1.03±0.15 | 1.58±0.29 | 1.75±0.39 | |
MCI (n=32) | 1.49±0.15 | 1.39±0.16 | 0.41±0.05 | 0.42±0.05 | 1.07±0.22 | 0.99±0.19 | 1.71±0.35 | 1.85±0.49 | |
P value | 0.488 | 0.603 | 0.113 | 0.436 | 0.838 | 0.368 | 0.148 | 0.912 | |
Older group | NC (n=13) | 1.39±0.20 | 1.44±0.20 | 0.42±0.05 | 0.42±0.05 | 1.09±0.23 | 1.05±0.28 | 1.52±0.42 | 1.63±0.25 |
SCD (n=21) | 1.41±0.16 | 1.40±0.12 | 0.43±0.05 | 0.41±0.06 | 1.06±0.15 | 1.17±0.15 | 1.70±0.33 | 1.87±0.36 | |
SCD-P (n=17) | 1.40±0.15 | 1.44±0.21 | 0.41±0.05 | 0.42±0.07 | 1.03±0.15 | 1.10±0.20 | 1.65±0.32 | 1.86±0.32 | |
MCI (n=30) | 1.43±0.22 | 1.43±0.21 | 0.42±0.06 | 0.44±0.04 | 1.08±0.19 | 1.17±0.21 | 1.77±0.39 | 1.93±0.43 | |
P value | 0.827 | 0.900 | 0.603 | 0.170 | 0.712 | 0.268 | 0.113 | 0.262 | |
Item | ApoE-ε4+(n=52) | ApoE-ε4-(n=231) | P value | |
|---|---|---|---|---|
Gender (Male/Female) | 25/27 | 113/118 | 0.586 | |
Age (year) | 48.92±12.63 | 46.44±13.56 | 0.239 | |
Education duration (year) | 12.81±3.68 | 13.65±3.88 | 0.272 | |
NAA+NAAG | Left | 1.51±0.20 | 1.53±0.19 | 0.738 |
Right | 1.40±0.16 | 1.38±0.19 | 0.959 | |
GPC+PCh | Left | 0.43±0.05 | 0.42±0.05 | 0.389 |
Right | 0.42±0.05 | 0.41±0.07 | 0.214 | |
mIns | Left | 1.05±0.17 | 1.02±0.20 | 0.276 |
Right | 1.05±0.24 | 1.04±0.20 | 0.761 | |
Glu+Gln | Left | 1.82±0.43 | 1.78±0.34 | 0.646 |
Right | 1.75±0.32 | 1.77±0.40 | 0.762 | |
| [1] | Villain N, Michalon R. What is Alzheimer's disease? An analysis of nosological perspectives from the 20th and 21st centuries. Eur J Neurol 2024; 31(11): e16302. |
| [2] | D'elia Y, Whitfield T, Schlosser M, et al. Impact of mindfulness-based and health self-management interventions on mindfulness, self-compassion, and physical activity in older adults with subjective cognitive decline: A secondary analysis of the SCD-Well randomized controlled trial. Alzheimers Dement (Amst) 2024; 16(1): e12558. |
| [3] | Botello-Marabotto M, Martínez-Bisbal MC, Calero M, et al. Non-invasive biomarkers for mild cognitive impairment and Alzheimer's disease. Neurobiol Dis 2023; 187: 106312. |
| [4] | Kara F, Kantarci K. Understanding Proton Magnetic Resonance Spectroscopy Neurochemical Changes Using Alzheimer's Disease Biofluid, PET, Postmortem Pathology Biomarkers, and APOE Genotype. Int J Mol Sci 2024; 25(18): 10064. |
| [5] | McKiernan E, Su L, O'Brien J. MRS in neurodegenerative dementias, prodromal syndromes and at-risk states: A systematic review of the literature. NMR Biomed 2023; 36(7): e4896. |
| [6] | Dubois B, Villain N, Frisoni GB, et al. Clinical diagnosis of Alzheimer's disease: recommendations of the International Working Group. Lancet Neurol 2021; 20(6): 484-496. |
| [7] | Palmqvist S, Schöll M, Strandberg O, et al. Earliest accumulation of β-amyloid occurs within the default-mode network and concurrently affects brain connectivity. Nat Commun 2017; 8(1): 1214. |
| [8] | Matsuoka K, Hirata K, Kokubo N, et al. Investigating neural dysfunction with abnormal protein deposition in Alzheimer's disease through magnetic resonance spectroscopic imaging, plasma biomarkers, and positron emission tomography. Neuroimage Clin 2024; 41: 103560. |
| [9] | Tullberg M, Fletcher E, DeCarli C, et al. White matter lesions impair frontal lobe function regardless of their location. Neurology 2004; 63(2): 246-53. |
| [10] | Hone-Blanchet A, Bohsali A, Krishnamurthy LC, et al. Frontal Metabolites and Alzheimer's Disease Biomarkers in Healthy Older Women and Women Diagnosed with Mild Cognitive Impairment. J Alzheimers Dis 2022; 87(3): 1131-1141. |
| [11] | Chen H-X. Functional magnetic resonance imaging-based exploration of mild cognitive impairment and the relationship between visual response and cognition [D]. Guangzhou Medical University, 2019. |
| [12] | Tang Z-L. In vivo detection of metabolites in bilateral frontal white matter and their correlation with cognitive function based on proton magnetic resonance spectroscopy [D], South China University of Technology, Guangzhou, 2021. |
| [13] | Ahmad, O, BoschipintoC, LopezA, et al. (2002). Age standardization of rates: a new WHO standard (GPE discussion paper Series: No. 31). |
| [14] | Xie Q, Xu H-X, Wang Y-J, et al. In vivo quantification of superficial cortical veins on susceptibility-weighted imaging with artificial intelligence image segmentation and the potential mechanism of human cognitive decline. Front. Aging Neurosci. 2025; 17: 1557397. |
| [15] | Dexheimer B, Sainburg R, Sharp S, et al. Roles of Handedness and Hemispheric Lateralization: Implications for Rehabilitation of the Central and Peripheral Nervous Systems: A Rapid Review. Am J Occup Ther 2024; 78(2): 7802180120. |
| [16] | Wan B, Saberi A, Paquola C, et al. Microstructural asymmetry in the human cortex. Nat Commun. 2024 Nov 22; 15(1): 10124. |
| [17] | Jayasundar R. Human brain: biochemical lateralization in normal subjects. Neurol India 2002; 50(3): 267-71. |
| [18] | Cichocka M, Kozub J, Karcz P, et al. Differences in Metabolite Concentrations Between the Hemispheres of the Brain in Healthy Children: A Proton Magnetic Resonance Spectroscopy Study (1HMRS). J Child Neurol 2016; 31(11): 1296-301. |
| [19] | Mahmoudi N, Dadak M, Bronzlik P, et al. Microstructural and Metabolic Changes in Normal Aging Human Brain Studied with Combined Whole-Brain MR Spectroscopic Imaging and Quantitative MR Imaging. Clin Neuroradiol 2023; 33(4): 993-1005. |
| [20] | Maghsudi H, Schütze M, Maudsley AA, et al. Age-related Brain Metabolic Changes up to Seventh Decade in Healthy Humans: Whole-brain Magnetic Resonance Spectroscopic Imaging Study. Clin Neuroradiol 2020; 30(3): 581-589. |
| [21] | Eylers VV, Maudsley AA, Bronzlik P, et al. Detection of Normal Aging Effects on Human Brain Metabolite Concentrations and Microstructure with Whole-Brain MR Spectroscopic Imaging and Quantitative MR Imaging. Am J Neuroradiol 2016; 37(3): 447-54. |
| [22] | Maghsudi H, Schmitz B, Maudsley AA, et al. Regional Metabolite Concentrations in Aging Human Brain: Comparison of Short-TE Whole Brain MR Spectroscopic Imaging and Single Voxel Spectroscopy at 3T. Clin Neuroradiol 2020; 30(2): 251-261. |
| [23] | Thomson AR, Hwa H, Pasanta D, et al. The developmental trajectory of 1H-MRS brain metabolites from childhood to adulthood. Cereb Cortex 2024; 34(3): bhae046. |
| [24] | Murray ME, Przybelski SA, Lesnick TG, et al. Early Alzheimer's disease neuropathology detected by proton MR spectroscopy. J Neurosci 2014; 34(49): 16247-55. |
| [25] | Kantarci K, Jack CR Jr, Xu YC, et al. Regional metabolic patterns in mild cognitive impairment and Alzheimer's disease: A 1H MRS study. Neurology 2000; 55(2): 210-7. |
| [26] | Rae CD. A guide to the metabolic pathways and function of metabolites observed in human brain 1H magnetic resonance spectra. Neurochem Res 2014; 39(1): 1-36. |
| [27] | Nutma E, Fancy N, Weinert M, et al. Translocator protein is a marker of activated microglia in rodent models but not human neurodegenerative diseases. Nat Commun 2023; 14(1): 5247. |
| [28] | Zeydan B, Deelchand DK, Tosakulwong N, et al. Decreased Glutamate Levels in Patients with Amnestic Mild Cognitive Impairment: An sLASER Proton MR Spectroscopy and PiB-PET Study. J Neuroimaging 2017; 27(6): 630-636. |
| [29] | Riese F, Gietl A, Zölch N, et al. Posterior cingulate γ-aminobutyric acid and glutamate/glutamine are reduced in amnestic mild cognitive impairment and are unrelated to amyloid deposition and apolipoprotein E genotype. Neurobiol Aging 2015; 36(1): 53-9. |
| [30] | Estevez-Gonzalez A, Kulisevsky J, Boltes A, et al. Rey verbal learning test is a useful tool for differential diagnosis in the preclinical phase of Alzheimer's disease: comparison with mild cognitive impairment and normal aging. Int J Geriatr Psychiatry, 2003; 18(11): 1021-1028. |
| [31] | Bittner DM, Heinze HJ, Kaufmann J. Association of 1H-MR spectroscopy and cerebrospinal fluid biomarkers in Alzheimer's disease: diverging behavior at three different brain regions. J Alzheimers Dis 2013; 36(1): 155-63. |
| [32] | Waragai M, Moriya M, Nojo T. Decreased N-Acetyl Aspartate/Myo-Inositol Ratio in the Posterior Cingulate Cortex Shown by Magnetic Resonance Spectroscopy May Be One of the Risk Markers of Preclinical Alzheimer's Disease: A 7-Year Follow-Up Study. J Alzheimers Dis 2017; 60(4): 1411-1427. |
| [33] | Voevodskaya O, Sundgren PC, Strandberg O, et al. Myo-inositol changes precede amyloid pathology and relate to APOE genotype in Alzheimer disease. Neurology 2016; 86(19): 1754-61. |
| [34] | Geerts H. Indicators of neuroprotection with galantamine. Brain Res Bull 2005; 64(6): 519-24. |
| [35] | Sun XY, Wei YP, Xiong Y, et al. Synaptic released zinc promotes tau hyperphosphorylation by inhibition of protein phosphatase 2A (PP2A). J Biol Chem 2012; 287(14): 11174-82. |
APA Style
Xie, Q., Tan, Z., Wang, Y., Chen, H. (2026). 1H-MRS Observation of Frontal White Matter Metabolites in Human Natural Aging and Early Cognitive Decline in Vivo. Clinical Neurology and Neuroscience, 10(2), 42-59. https://doi.org/10.11648/j.cnn.20261002.11
ACS Style
Xie, Q.; Tan, Z.; Wang, Y.; Chen, H. 1H-MRS Observation of Frontal White Matter Metabolites in Human Natural Aging and Early Cognitive Decline in Vivo. Clin. Neurol. Neurosci. 2026, 10(2), 42-59. doi: 10.11648/j.cnn.20261002.11
@article{10.11648/j.cnn.20261002.11,
  author = {Qi Xie and Zhi-lin Tan and Ya-jie Wang and Hui-xian Chen},
  title = {1H-MRS Observation of Frontal White Matter Metabolites in Human Natural Aging and Early Cognitive Decline in Vivo},
  journal = {Clinical Neurology and Neuroscience},
  volume = {10},
  number = {2},
  pages = {42-59},
  doi = {10.11648/j.cnn.20261002.11},
  url = {https://doi.org/10.11648/j.cnn.20261002.11},
  eprint = {https://article.sciencepublishinggroup.com/pdf/10.11648.j.cnn.20261002.11},
  abstract = {Proton magnetic resonance spectroscopy (1H-MRS) enables noninvasive in vivo detection of biochemical and neurotransmitter alterations in brain neurons, offering potential for early diagnosis of Alzheimer's disease (AD). This study investigates metabolite distribution patterns in bilateral frontal white matter and imaging biomarkers of early cognitive function across preclinical and prodromal stages of the AD continuum. A cohort of 362 right-handed participants underwent comprehensive neuropsychological assessments. Single-voxel 1H-MRS was employed to acquire metabolite spectra from bilateral frontal white matter, complemented by venous blood analysis for AD-associated genes and toxic proteins. Statistical analysis revealed the following key findings. Normal Controls (NC): (1) Higher relative concentrations of N-acetyl-aspartate/N-acetyl aspartyl-glutamate (NAA+NAAG) and glycerol-phosphocholine/phosphocholine (GPC+PCho) were observed in left versus right frontal white matter. (2) Age-related decline: NAA+NAAG levels in left frontal white matter demonstrated progressive reduction from younger to older age groups. (3) The elderly group exhibited significantly lower glutamate/glutamine (Glu+Gln) concentrations in left frontal white matter compared to middle-aged and younger groups. Mild Cognitive Impairment (MCI): (1) Inverse correlation between Auditory Verbal Learning Test (AVLT) scores and right frontal NAA+NAAG content. (2) Positive associations between Shape Trail Test (STT-A/B) completion times and right frontal myo-inositol (mIns) levels. Left frontal Glu+Gln concentrations correlated positively with plasma biomarkers: amyloid β-protein (Aβ1-42), total tau (t-tau), and phosphorylated tau181 (p-tau181). These 1H-MRS-detected metabolite alterations in bilateral frontal white matter may reflect both physiological brain aging and AD-related pathological changes, suggesting their utility as potential diagnostic indicators for early-stage AD. The integration of metabolic profiling with established biomarkers could enhance predictive accuracy in the AD continuum.},
 year = {2026}
}
TY  - JOUR
T1  - 1H-MRS Observation of Frontal White Matter Metabolites in Human Natural Aging and Early Cognitive Decline in Vivo
AU  - Qi Xie
AU  - Zhi-lin Tan
AU  - Ya-jie Wang
AU  - Hui-xian Chen
Y1  - 2026/05/12
PY  - 2026
N1  - https://doi.org/10.11648/j.cnn.20261002.11
DO  - 10.11648/j.cnn.20261002.11
T2  - Clinical Neurology and Neuroscience
JF  - Clinical Neurology and Neuroscience
JO  - Clinical Neurology and Neuroscience
SP  - 42
EP  - 59
PB  - Science Publishing Group
SN  - 2578-8930
UR  - https://doi.org/10.11648/j.cnn.20261002.11
AB  - Proton magnetic resonance spectroscopy (1H-MRS) enables noninvasive in vivo detection of biochemical and neurotransmitter alterations in brain neurons, offering potential for early diagnosis of Alzheimer's disease (AD). This study investigates metabolite distribution patterns in bilateral frontal white matter and imaging biomarkers of early cognitive function across preclinical and prodromal stages of the AD continuum. A cohort of 362 right-handed participants underwent comprehensive neuropsychological assessments. Single-voxel 1H-MRS was employed to acquire metabolite spectra from bilateral frontal white matter, complemented by venous blood analysis for AD-associated genes and toxic proteins. Statistical analysis revealed the following key findings. Normal Controls (NC): (1) Higher relative concentrations of N-acetyl-aspartate/N-acetyl aspartyl-glutamate (NAA+NAAG) and glycerol-phosphocholine/phosphocholine (GPC+PCho) were observed in left versus right frontal white matter. (2) Age-related decline: NAA+NAAG levels in left frontal white matter demonstrated progressive reduction from younger to older age groups. (3) The elderly group exhibited significantly lower glutamate/glutamine (Glu+Gln) concentrations in left frontal white matter compared to middle-aged and younger groups. Mild Cognitive Impairment (MCI): (1) Inverse correlation between Auditory Verbal Learning Test (AVLT) scores and right frontal NAA+NAAG content. (2) Positive associations between Shape Trail Test (STT-A/B) completion times and right frontal myo-inositol (mIns) levels. Left frontal Glu+Gln concentrations correlated positively with plasma biomarkers: amyloid β-protein (Aβ1-42), total tau (t-tau), and phosphorylated tau181 (p-tau181). These 1H-MRS-detected metabolite alterations in bilateral frontal white matter may reflect both physiological brain aging and AD-related pathological changes, suggesting their utility as potential diagnostic indicators for early-stage AD. The integration of metabolic profiling with established biomarkers could enhance predictive accuracy in the AD continuum.
VL  - 10
IS  - 2
ER  -
Medical Imaging Department of Nansha, Guangzhou First People's Hospital, School of Medicine, South China University of Technology, Guangzhou, China
Medical Imaging Department of Nansha, Guangzhou First People's Hospital, School of Medicine, South China University of Technology, Guangzhou, China; Department of Radiology, Shunde Hospital, Southern Medical University (The First People’s Hospital of Shunde), Shunde, China
Medical Imaging Department of Nansha, Guangzhou First People's Hospital, School of Medicine, South China University of Technology, Guangzhou, China; Department of Radiology, West China Hospital, Sichuan University, Chengdu, China
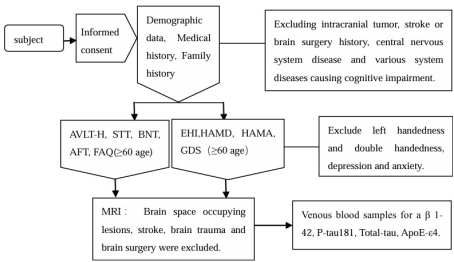
Figure 1. Flow chart of subject recruitment.
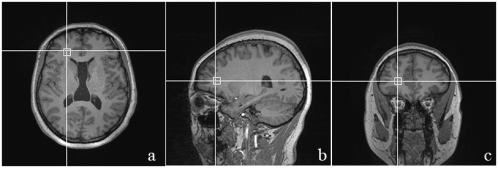
Figure 2. Location map of 1H-MRS (PRESS sequence) for data acquisition of the white matter in the right frontal lobe of the subject. White boxes represent the location of the region of interest (1.0cm × 1.0cm × 1.0cm) in T1_MPRAGE reconstruction axial (a), sagittal (b) and coronal (c) images.
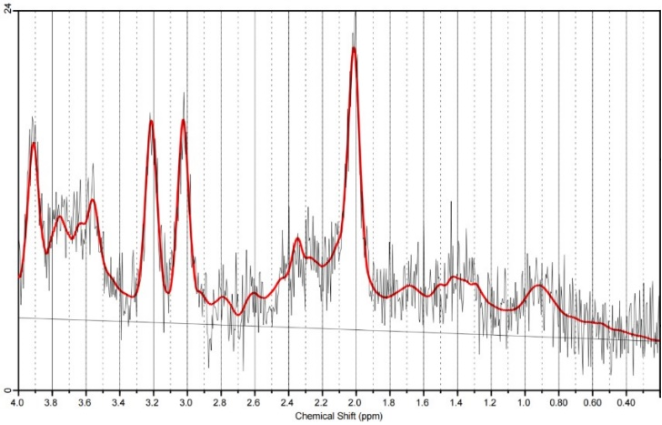
Figure 3. Spectrum of 1H-MRS in right frontal white matter of NC group after LCModel post-processing.
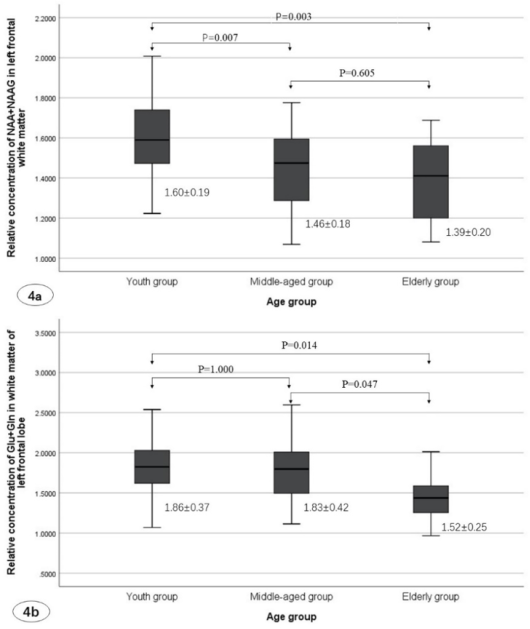
Figure 4. Relative concentrations of NAA+NAAG (a) and Glu+Gln (b) in the left frontal white matter across young, middle-aged, and older adult groups.
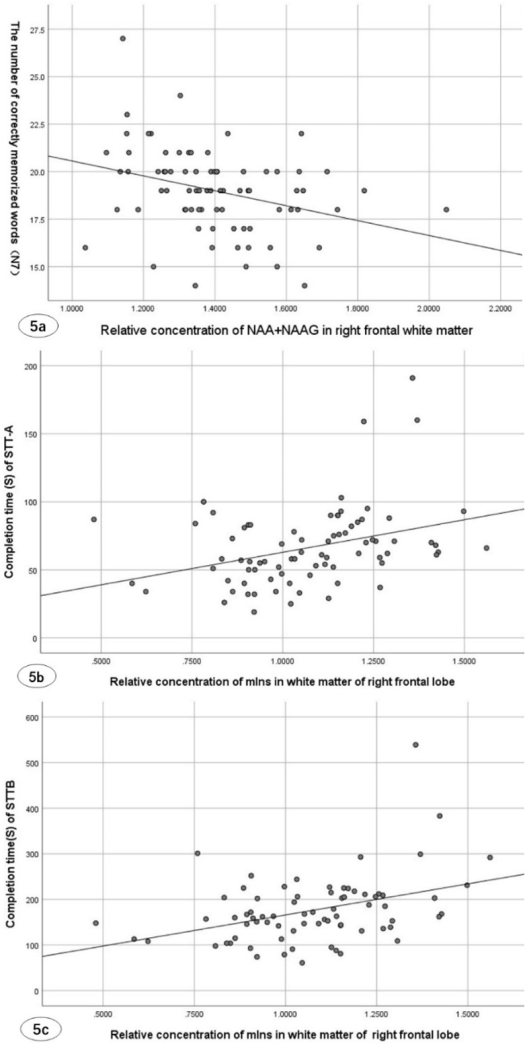
Figure 5. Associations between metabolite concentrations and neuropsychological test scores in the MCI group: (a) AVLT recognition and right frontal white matter NAA+NAAG; (b) STT-A completion time and right frontal white matter mIns; (c) STT-B completion time and right frontal white matter mIns.
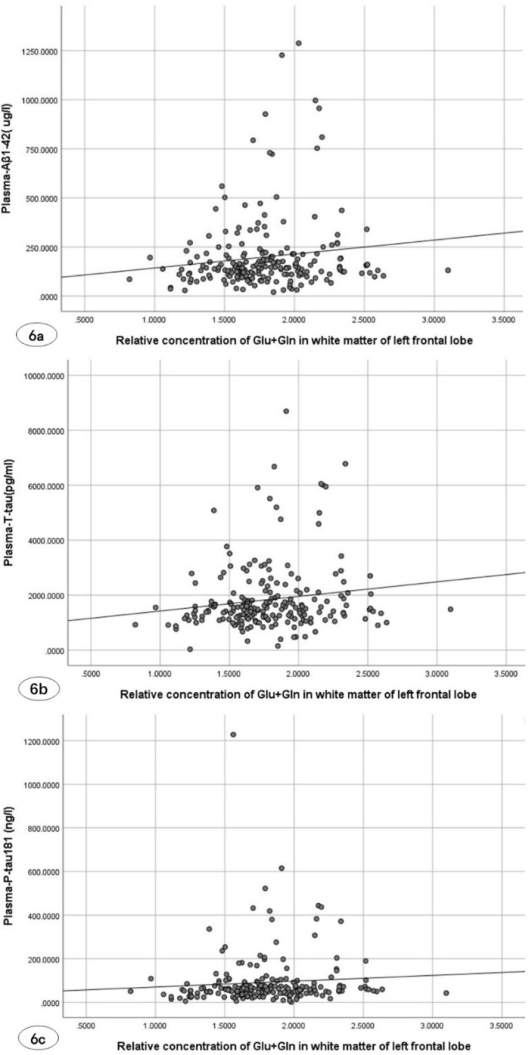
Figure 6. Associations between left frontal white matter Glu+Gln concentrations and (a) Aβ1-42, (b) t-tau, and (c) p-tau181 levels.
Information

