Marine jetties form an important link between land and sea areas for the transport of oil and gas products. Mooring forces are considered a key factor in marine jetties design, which can be calculated using static or dynamic mooring analysis. In general, the dynamic mooring analysis (DMA) is considered a more complex task compared to static mooring analysis (SMA), due to the dynamic behavior of mooring lines and body motion of moored vessels. So, DMA always provides the most accurate and reliable results. Although the DMA is the ideal choice for detailed engineering projects, in feasibility studies and the FEED phase it will be time-consuming and less added value. In this paper, a methodology for calculating mooring forces using a modified SMA was implemented through the so-called dynamic mooring analysis factor (FDMA), which will take into account the dynamic response of the wave forces. For this purpose, more than 190 sea state load combinations were carried out, including different return periods, water depths, and wide range of vessel sizes. To determine the mooring forces in vessels' mooring lines, SMA is performed using the OCIMF approach, while DMA is performed by the Finite Element Model (SESAM Marine Software). The nonlinear regression concept was used to correlate the results of the SMA and DMA in conjunction with the vessel’s dead weight tonnages (DWTs). Finally, the dynamic mooring results using the modified SMA were validated against the DMA results generated by SEASM Marine Software, which gave promising results. As a conclusion; using the modified SMA approach will be as an alternative solution to the DMA approach at earlier stages of any project. This will also facilitate selection of the appropriate mooring pattern on marine jetties and the determination of the size and material of the mooring lines, thus contributing effectively to the cost estimation phase.
| Published in | Engineering and Applied Sciences (Volume 11, Issue 1) |
| DOI | 10.11648/j.eas.20261101.14 |
| Page(s) | 20-32 |
| Creative Commons |
This is an Open Access article, distributed under the terms of the Creative Commons Attribution 4.0 International License (http://creativecommons.org/licenses/by/4.0/), which permits unrestricted use, distribution and reproduction in any medium or format, provided the original work is properly cited. |
| Copyright |
Copyright © The Author(s), 2026. Published by Science Publishing Group |
Dynamic Mooring Analysis, Static Mooring Analysis, Dynamic Mooring Factor (FDMA), Marine Jetties
Return Period | Direction | Wind speed | Wave | |
|---|---|---|---|---|
(º) | (knot) | Hs (m) | Tp (s) | |
1-year | 0 | 32.3 | 0.9 | 4.0 |
30 | 28.2 | 0.9 | 4.0 | |
60 | 24.6 | 0.8 | 3.6 | |
90 | 21.0 | 0.6 | 3.4 | |
120 | 22.7 | 0.7 | 3.8 | |
150 | 30.4 | 1.3 | 5.3 | |
180 | 34.0 | 1.0 | 4.0 | |
210 | 34.0 | 0.6 | 3.1 | |
240 | 34.0 | 0.4 | 2.2 | |
270 | 34.0 | N/A | N/A | |
300 | 34.0 | 0.3 | 2.5 | |
330 | 34.0 | 0.6 | 4.0 | |
Return Period | Direction | Wind speed | Wave | |
|---|---|---|---|---|
(º) | (knot) | Hs (m) | Tp (s) | |
50-year | 0 | 54.4 | 2.0 | 5.5 |
30 | 47.2 | 2.0 | 5.5 | |
60 | 39.5 | 1.6 | 4.8 | |
90 | 24.0 | 0.8 | 3.6 | |
120 | 24.0 | 0.8 | 4.0 | |
150 | 45.9 | 2.5 | 6.2 | |
180 | 54.4 | 2.2 | 5.6 | |
210 | 66.9 | 1.5 | 4.0 | |
240 | 68.2 | 0.9 | 3.0 | |
270 | 61.1 | 0.4 | 2.0 | |
300 | 62.2 | 0.7 | 3.3 | |
330 | 51.9 | 1.1 | 4.3 | |
Return period | Max. Extreme Current speed (knot) |
|---|---|
1-year | 0.41 |
50-year | 0.84 |
Vessels | Volume | LOA (m) | LBP (m) | Max. Draft (m) | Beam (m) |
|---|---|---|---|---|---|
LPG* | 5,000m3 | 102.3 | 96.2 | 6.5 | 17.7 |
Product Tanker | 15,000 DWT | 143.0 | 134.0 | 7.4 | 22.6 |
LPG* | 82,000m3 | 225.5 | 215.0 | 12.6 | 36.6 |
Product Tanker | 160,000 DWT | 274.3 | 264.0 | 17.1 | 48.0 |
Vessels Size (DWT) | 1-year return period | 50-year return period | ||||
|---|---|---|---|---|---|---|
Min. (kN) | Max. (kN) | Mean (kN) | Min. (kN) | Max. (kN) | Mean (kN) | |
5,400 | 47.55 | 324.9 | 155.6 | 80.30 | 441.3 | 210.5 |
15,000 | 231.5 | 1164 | 565.3 | 290.9 | 1554 | 736.6 |
52,000 | 2380 | 6439 | 3744 | 2972 | 8043 | 4890 |
160,000 | 4882 | 14004 | 8182 | 6285 | 17032 | 10473 |
Vessels Size (DWT) | Factor of Dynamic Mooring Analysis () | |||
|---|---|---|---|---|
1-year return period | 50-year return period | |||
Water Depth | Water Depth | |||
14m | 20m | 14m | 20m | |
5,400 | 3.21 | 3.15 | 2.81 | 2.75 |
15,000 | 2.69 | 2.65 | 2.78 | 2.65 |
52,000 | 2.26 | 2.15 | 2.34 | 2.15 |
160,000 | 2.03 | 1.95 | 2.02 | 1.95 |
Return period | Constants of Exponential Regression Equation | |
|---|---|---|
A | P | |
1-year | 10.38 | -0.14 |
50-year | 7.15 | -0.11 |
Vessels Size (DWT) | 1-year return period | 50-year return period | ||
|---|---|---|---|---|
MAE (kN) | SI% | MAE (kN) | SI% | |
5,400 | 2.74 | 2.37 | 4.34 | 2.57 |
15,000 | 15.90 | 3.34 | 65.61 | 11.60 |
52,000 | 173.61 | 5.25 | 212.01 | 5.54 |
160,000 | 231.44 | 3.91 | 393.78 | 4.45 |
DMA | Dynamic Mooring Analysis |
DMF | Dynamic Mooring Force |
DWT | Dead Weight Tonnage |
ECMWF | European Centre for Medium-Range Weather Forecasts |
FEED | Front-End Engineering Design |
LOA | Length Overall |
LBP | Length Between Perpendiculars |
LPG | Liquefied Petroleum Gas |
N/A | Not Applicable |
SMA | Static Mooring Analysis |
SMF | Static Mooring Force |
W.D | Water Depth |
| [1] | Papanikolaou, A., 1985. On the Evaluation of Motions and Loads of Arbitrary Bodies in Waves. In: Proc. Inc. Symp. On Ocean Space Util. 85, Tokyo pp- 75–86. |
| [2] | Lee S., 2015. A numerical study on ship-ship interaction in shallow and restricted waterway, Int. J. Nav. Archit. Ocean Eng. 7, 920–938. |
| [3] | OCIMF, 2008. Mooring Equipment Guidelines -MEG3. Oil Companies International Marine Forum, 3rd Edition. |
| [4] | PIANC (2002). Guidelines for the Design of Fenders Systems. Report of Maritime Navigation Commission Working Group 33, Permanent International Association of Navigation Congresses (PIANC). |
| [5] | British Standard BS 6349-1:2000, Maritime Structures - Part 1: Code of Practice for General Criteria. |
| [6] | British Standard BS 6349-4:2014, Maritime Works - Part 4: Code of Practice for Design of Fendering and Mooring Systems. |
| [7] | Natarajan, R., Ganapathy, C. Analysis of Moorings of a Berthed Ship. Marine Structures. 1995, 8(5), 481-499. |
| [8] | Schelfn, T. E., Östergaard, C., The Vessel in Port: Mooring Problems. Marine Structures. 1995, 8(5), 451-479. |
| [9] | Molen, V, W., Moes, H. General Characteristics of South African Ports and the Safe Mooring of Ships. The 28th Southern African Transport Conference (SATC 2009), 308-314. |
| [10] | Das, S. N., Kulkarni, S., Kudale, M. D. Design of Safe Mooring Arrangement for Large Oil Tankers. Procedia Engineering. 2015, (116), 528-534. |
| [11] | Molen, V. W., Scott, D., Taylor, D., Elliott, T. Improvement of Mooring Configurations in Geraldton Harbour. Journal of Marine Science and Engineering. 2016, 4(3), 1-20. |
| [12] | Stoschek, O., Leschka, S., Brüning, A., Hein, C. Optimizing Pier Structures using Dynamic Mooring Forces Modelling. The 34th PIANC-World Congress Panama City, Panama 2018. |
| [13] | Ports Designer’s Handbook: Recommendations and Guidelines, Carl A. Thoresen, 2003. |
| [14] | SESAM user manual HydroD, 2011. Det Norske Veritas Software. |
| [15] | SESAM user manual Wadam, 2011. Det Norske Veritas Software. |
| [16] | Salah, H. Prediction of wave parameters off the Nile delta coast of Egypt using nonlinear regression analysis. International Journal of Science and Research (IJSR). 2017, 6(9), 187-195. |
APA Style
Salah, H., Ali, W., Gamal, E. (2026). Modified Static Mooring Analysis of Oil and Gas Marine Jetties Compared with Dynamic Mooring Analysis. Engineering and Applied Sciences, 11(1), 20-32. https://doi.org/10.11648/j.eas.20261101.14
ACS Style
Salah, H.; Ali, W.; Gamal, E. Modified Static Mooring Analysis of Oil and Gas Marine Jetties Compared with Dynamic Mooring Analysis. Eng. Appl. Sci. 2026, 11(1), 20-32. doi: 10.11648/j.eas.20261101.14
AMA Style
Salah H, Ali W, Gamal E. Modified Static Mooring Analysis of Oil and Gas Marine Jetties Compared with Dynamic Mooring Analysis. Eng Appl Sci. 2026;11(1):20-32. doi: 10.11648/j.eas.20261101.14
@article{10.11648/j.eas.20261101.14,
  author = {Hassan Salah and Walid Ali and Eslam Gamal},
  title = {Modified Static Mooring Analysis of Oil and Gas Marine Jetties Compared with Dynamic Mooring Analysis},
  journal = {Engineering and Applied Sciences},
  volume = {11},
  number = {1},
  pages = {20-32},
  doi = {10.11648/j.eas.20261101.14},
  url = {https://doi.org/10.11648/j.eas.20261101.14},
  eprint = {https://article.sciencepublishinggroup.com/pdf/10.11648.j.eas.20261101.14},
  abstract = {Marine jetties form an important link between land and sea areas for the transport of oil and gas products. Mooring forces are considered a key factor in marine jetties design, which can be calculated using static or dynamic mooring analysis. In general, the dynamic mooring analysis (DMA) is considered a more complex task compared to static mooring analysis (SMA), due to the dynamic behavior of mooring lines and body motion of moored vessels. So, DMA always provides the most accurate and reliable results. Although the DMA is the ideal choice for detailed engineering projects, in feasibility studies and the FEED phase it will be time-consuming and less added value. In this paper, a methodology for calculating mooring forces using a modified SMA was implemented through the so-called dynamic mooring analysis factor (FDMA), which will take into account the dynamic response of the wave forces. For this purpose, more than 190 sea state load combinations were carried out, including different return periods, water depths, and wide range of vessel sizes. To determine the mooring forces in vessels' mooring lines, SMA is performed using the OCIMF approach, while DMA is performed by the Finite Element Model (SESAM Marine Software). The nonlinear regression concept was used to correlate the results of the SMA and DMA in conjunction with the vessel’s dead weight tonnages (DWTs). Finally, the dynamic mooring results using the modified SMA were validated against the DMA results generated by SEASM Marine Software, which gave promising results. As a conclusion; using the modified SMA approach will be as an alternative solution to the DMA approach at earlier stages of any project. This will also facilitate selection of the appropriate mooring pattern on marine jetties and the determination of the size and material of the mooring lines, thus contributing effectively to the cost estimation phase.},
 year = {2026}
}
TY  - JOUR
T1  - Modified Static Mooring Analysis of Oil and Gas Marine Jetties Compared with Dynamic Mooring Analysis
AU  - Hassan Salah
AU  - Walid Ali
AU  - Eslam Gamal
Y1  - 2026/01/26
PY  - 2026
N1  - https://doi.org/10.11648/j.eas.20261101.14
DO  - 10.11648/j.eas.20261101.14
T2  - Engineering and Applied Sciences
JF  - Engineering and Applied Sciences
JO  - Engineering and Applied Sciences
SP  - 20
EP  - 32
PB  - Science Publishing Group
SN  - 2575-1468
UR  - https://doi.org/10.11648/j.eas.20261101.14
AB  - Marine jetties form an important link between land and sea areas for the transport of oil and gas products. Mooring forces are considered a key factor in marine jetties design, which can be calculated using static or dynamic mooring analysis. In general, the dynamic mooring analysis (DMA) is considered a more complex task compared to static mooring analysis (SMA), due to the dynamic behavior of mooring lines and body motion of moored vessels. So, DMA always provides the most accurate and reliable results. Although the DMA is the ideal choice for detailed engineering projects, in feasibility studies and the FEED phase it will be time-consuming and less added value. In this paper, a methodology for calculating mooring forces using a modified SMA was implemented through the so-called dynamic mooring analysis factor (FDMA), which will take into account the dynamic response of the wave forces. For this purpose, more than 190 sea state load combinations were carried out, including different return periods, water depths, and wide range of vessel sizes. To determine the mooring forces in vessels' mooring lines, SMA is performed using the OCIMF approach, while DMA is performed by the Finite Element Model (SESAM Marine Software). The nonlinear regression concept was used to correlate the results of the SMA and DMA in conjunction with the vessel’s dead weight tonnages (DWTs). Finally, the dynamic mooring results using the modified SMA were validated against the DMA results generated by SEASM Marine Software, which gave promising results. As a conclusion; using the modified SMA approach will be as an alternative solution to the DMA approach at earlier stages of any project. This will also facilitate selection of the appropriate mooring pattern on marine jetties and the determination of the size and material of the mooring lines, thus contributing effectively to the cost estimation phase.
VL  - 11
IS  - 1
ER  -
Civil Engineering Department, Al-Azhar University, Cairo, Egypt;Special Offshore Structures Department, Engineering for the Petroleum and Process Industries Co., Cairo, Egypt
Biography: Hassan Salah, Ph.D. degree in Civil Engineering. He is a consultant for Ports and Coastal Protection. He works as an "Offshore Engineer, General Manager at ENPPI Petroleum Company, Cairo, Egypt. He has published many papers abroad and participated in many conferences. Areas of interest are Marine Engineering Works, Oil & Gas, Fixed Offshore Platforms, Ports & Terminals, Jetty, Shore Protection Works, Marine studies, Marine construction, Support Vector Machine. https://www.researchgate.net/profile/Hassan-Salah-2

Offshore Platforms Department, Engineering for the Petroleum and Process Industries Co., Cairo, Egypt
Offshore Platforms Department, Engineering for the Petroleum and Process Industries Co., Cairo, Egypt
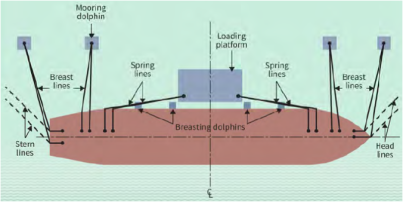
Figure 1. Components of Marine Jetties [3].
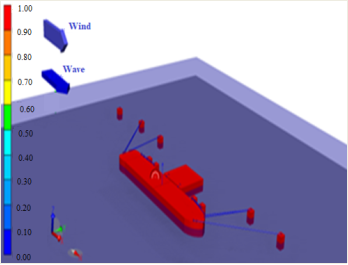
Figure 2. An example of 3D model for 15,000 DWT oil tanker using SESAM Marine Software.
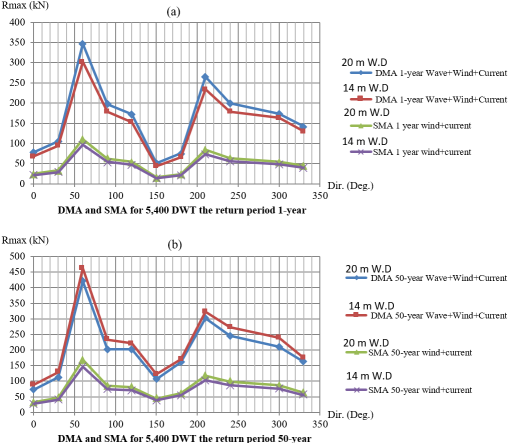
Figure 4. SMA and DMA for 5,400 DWT, (a) 1-year return period and (b) 50-year return period.
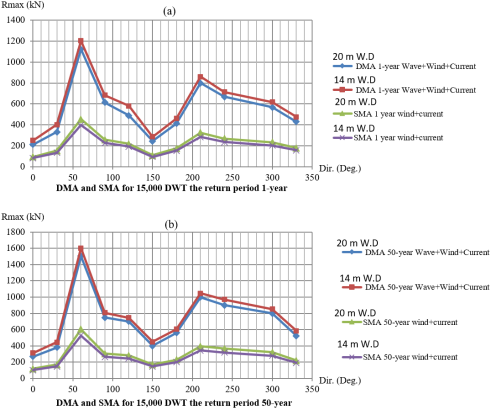
Figure 5. SMA and DMA for 15,000 DWT, (a) 1-year return period and (b) 50-year return period.
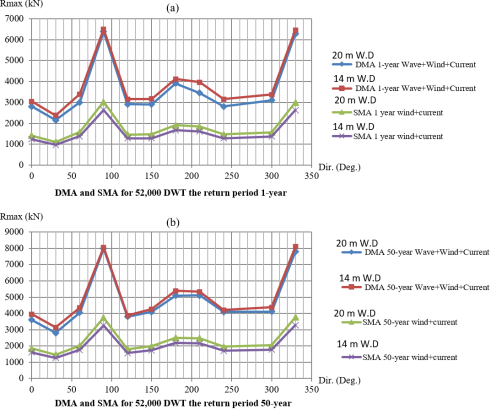
Figure 6. SMA and DMA for 52,000 DWT, (a) 1-year return period and (b) 50-year return period.
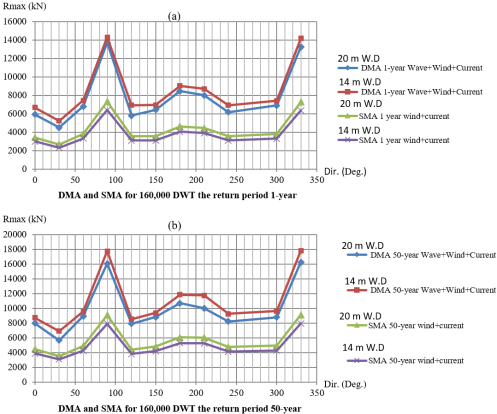
Figure 7. SMA and DMA for 160,000 DWT, (a) 1-year return period and (b) 50-year return period.
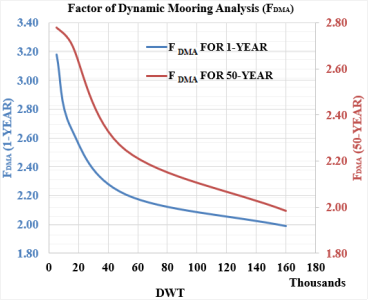
Figure 8. The relationship between DWTs and under 1-year and 50-year return periods.
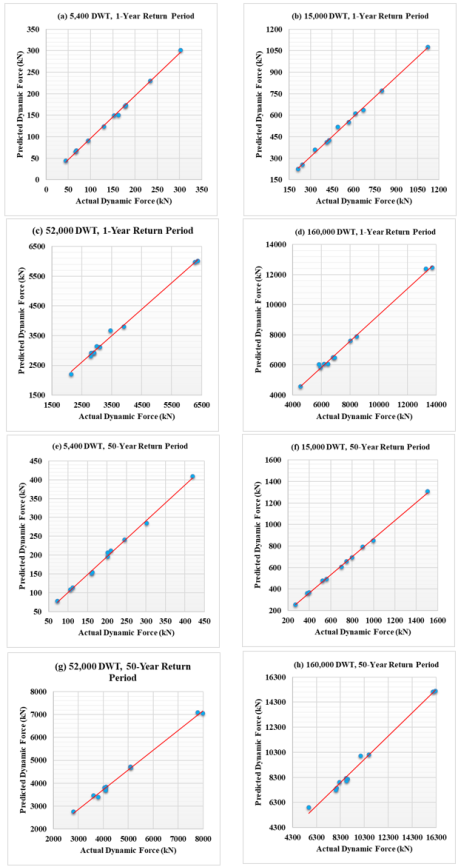
Figure 9. Correlation between Predicted and Actual dynamic mooring forces, (a), (b), (c) & (d) for 1-year return period and (e), (f), (g) & (h) for 50-year return period.
Information

