Research Article | | Peer-Reviewed

Beyond Insurance Enrolment: An Implementation-Constrained Stochastic Health-Financing Model of Out-of-Pocket Spending in Nigeria, 2024-2035

Received: 6 August 2026     Accepted: 14 August 2026     Published: 9 November 2026
Views:       Downloads:
Abstract

Background: Nigeria's health system remains dominated by direct household payment despite mandatory-insurance legislation. Policy debate often treats enrolment growth as equivalent to financial protection, although the effect of new pooled funds depends on budget execution, provider absorptive capacity and the extent to which prepayment replaces rather than supplements out-of-pocket expenditure. Methods: We developed a dynamic stochastic accounting model using annual Nigeria health-expenditure series for 2000-2023. Correlated mean-reverting processes generated reference trajectories for current health expenditure, domestic government health expenditure, external financing and voluntary prepayment. We simulated four 2024-2035 scenarios: status quo, insurance-led expansion, fiscal expansion and integrated reform. Policy funds were filtered through implementation and substitution parameters. One hundred thousand Monte Carlo trajectories propagated empirical and scenario uncertainty. Primary outcomes were the out-of-pocket share of current health expenditure in 2035 and the probability of reaching 50%, 35% and 20% thresholds. Rolling-origin validation assessed the reference model. Results: In 2023, out-of-pocket payments were 71.9% of current health expenditure and domestic government health expenditure was 0.60% of gross domestic product (GDP). The model's one-step rolling predictions had a mean absolute error of 2.58 percentage points. Median 2035 out-of-pocket shares were 74.0% (95% uncertainty interval [UI] 62.4-81.9) under the status quo, 62.6% (47.6-73.5) under insurance-led expansion, 46.5% (24.5-62.4) under fiscal expansion and 36.5% (9.2-56.0) under integrated reform. The integrated scenario had a 45.0% probability of reaching 35% and a 10.2% probability of reaching 20%. Target-seeking analysis indicated that a 35% share would require median budgeted domestic government health expenditure of 2.27% of GDP (95% UI 1.37-3.69); reaching 20% required 3.01% (1.84-4.83). Conclusions: Enrolment-led reform without commensurate public revenue and implementation capacity is unlikely to deliver financial protection. Nigeria's financing strategy should use the out-of-pocket share as an explicit outcome, link compulsory pooling to supply-side readiness and budget execution, and treat 2.2% of GDP as a plausible but not sufficient integrated-reform test rather than a guaranteed route to the 35% threshold.

Published in International Journal of Health Economics and Policy (Volume 11, Issue 4)
DOI 10.11648/j.hep.20261104.11
Page(s) 159-168
Creative Commons

This is an Open Access article, distributed under the terms of the Creative Commons Attribution 4.0 International License (http://creativecommons.org/licenses/by/4.0/), which permits unrestricted use, distribution and reproduction in any medium or format, provided the original work is properly cited.

Copyright

Copyright © The Author(s), 2026. Published by Science Publishing Group

Keywords

Health Financing, Out-of-pocket Expenditure, Universal Health Coverage, Monte Carlo Simulation, Fiscal Space, Health Insurance, Nigeria

1. Introduction
Health financing is not simply the volume of money spent on health. It is the interaction of revenue raising, pooling and purchasing that determines whether needed care is financed collectively or paid for at the point of use . A financing system can therefore expand nominal insurance enrolment while leaving households exposed to direct payment when the benefit package is narrow, providers lack medicines or funds are not executed. This distinction is especially important in settings where unmet need is high: new prepayment may finance previously forgone care as well as replace existing out-of-pocket (OOP) payments.
Nigeria illustrates this challenge at exceptional scale. The Global Health Expenditure Database and World Development Indicators show that OOP payments accounted for 71.9% of current health expenditure (CHE) in 2023, whereas domestic general government health expenditure was 0.60% of GDP . The 2018 Nigeria Health Financing System Assessment had already documented a structurally similar pattern: very low public expenditure, limited insurance coverage, high direct payment and weak financial protection . The persistence of the pattern implies that incremental programme expansion has not yet altered the financing architecture.
The National Health Insurance Authority (NHIA) Act 2022 requires residents to obtain health insurance and establishes mechanisms for vulnerable groups . The NHIA's mandate is universal health coverage by 2030 through resource mobilisation, pooling and strategic purchasing . These are consequential institutional changes, but legislation does not determine how much effective pooled financing reaches providers or how much direct payment is displaced. Recent national and subnational evidence continues to find a substantial and unequal burden of catastrophic payment , while regional monitoring associates higher public health spending with lower financial hardship .
The monitoring framework is also evolving. In 2025, the definition of Sustainable Development Goal indicator 3.8.2 changed from the proportion exceeding fixed shares of total household budgets to the proportion whose positive OOP payments exceed 40% of discretionary resources . That revision strengthens the case for modelling financing flows separately from household hardship. Aggregate OOP share is not a substitute for microdata-based financial-hardship measurement, but it is a timely structural indicator available annually and directly responsive to the balance between prepaid and point-of-service financing.
Financing primary health care requires both additional public resources and arrangements that direct those resources towards accessible, quality services . The WHO African Region has proposed an OOP share of 15-20% of CHE as a broad protection benchmark , far below Nigeria's current level. Global evidence similarly shows that direct payment remains a major barrier to universal coverage and exposes households to catastrophic expenditure . Yet a simple calculation that subtracts each new unit of public spending from OOP ignores execution failures, absorptive constraints and utilisation released when financial barriers fall.
Dynamic computational modelling is useful when policy effects depend on interacting stocks, flows, delays and uncertain implementation . Good modelling practice also requires transparent structure, explicit parameter uncertainty and validation against observed data . We therefore developed an implementation-constrained stochastic health-financing model for Nigeria. The study asks three questions: (1) how might the financing mix evolve to 2035 under alternative pooling and fiscal strategies; (2) what is the probability that each strategy reaches progressively lower OOP-share thresholds; and (3) what domestic government health budget would be required to reach 50%, 35% or 20% OOP shares under integrated implementation conditions?
2. Methods
2.1. Study Design and Analytic Perspective
This was a country-level, dynamic stochastic policy-simulation study. The analytic perspective was the Nigerian health-financing system. Financing flows were represented as percentage points of GDP, allowing the model to compare public, external, voluntary prepaid and OOP sources without introducing exchange-rate distortions. The model was designed for strategic planning rather than programme costing: it estimates the financing structure consistent with scenarios and does not attach costs or health effects to a specified benefits package.
2.2. Data Sources and Baseline Construction
We extracted annual Nigeria series for 2000-2023 from the World Bank application programming interface, whose health-expenditure indicators reproduce WHO Global Health Expenditure Database estimates . Variables were CHE as a percentage of GDP; domestic general government health expenditure as a percentage of GDP; OOP expenditure as a share of CHE; external health expenditure as a share of CHE; and domestic private health expenditure as a share of CHE. Voluntary prepaid/private insurance was derived as domestic private expenditure minus OOP expenditure. External, voluntary prepaid and OOP flows were converted to percentages of GDP by multiplying their CHE shares by CHE/GDP. Table 1 presents the 2023 starting values. All inputs were public aggregate country-level series; no human participants, identifiable records or individual-level linkage were used.
Table 1. Nigeria health-financing baseline, 2023.

Financing measure

% of CHE

% of GDP

Status in model

Current health expenditure

100.0

4.191

Observed total

Domestic government health expenditure

14.34

0.601

Observed prepaid pool

External health expenditure

11.28

0.473

Observed external pool

Voluntary prepaid/private insurance

2.48

0.104

Derived prepaid pool

Out-of-pocket expenditure

71.90

3.013

Observed residual/direct payment

CHE, current health expenditure; GDP, gross domestic product. Percentages may not sum exactly because of rounding. Source: WHO Global Health Expenditure Database via World Development Indicators ; voluntary prepayment derived by the authors.
2.3. Reference Financing Dynamics
The reference path comprised four positive state variables: CHE (C), domestic government health expenditure (G), external financing (X) and voluntary prepayment (V), each expressed as a percentage of GDP. For each variable z, a mean-reverting log autoregressive process was estimated:
Log(z[t]) = mu[z] + phi[z] x (log(z[t-1]) - mu[z]) + epsilon[z, t]
The long-run mean mu was the mean of the final ten log observations, while phi was estimated over the final fifteen transitions and constrained to 0.05-0.95 to prevent explosive extrapolation. The ten-observation mean window and fifteen-transition persistence window were specified a priori as a pragmatic compromise between recent-regime relevance and sampling stability in a 24-year series. The slightly longer persistence window reduces the influence of a single late transition, whereas the shorter mean window allows the long-run level to reflect more recent financing conditions. These window lengths were not statistically optimised, and window-length uncertainty was not propagated; results may therefore vary under alternative reference windows.
Residuals were retained jointly, and annual innovation vectors were sampled from a multivariate normal distribution with the empirical residual covariance matrix to preserve observed contemporaneous co-movement. Wide plausibility limits prevented impossible values. Pooled components were proportionally rescaled when they exceeded 92% of CHE in a reference draw. The 92% cutoff is a logical accounting safeguard rather than an empirical protection threshold: it preserves at least 8% of CHE as residual OOP before policy effects and avoids zero-residual artefacts. Sensitivity to this fixed cutoff was not evaluated. Reference OOP expenditure was the accounting residual:
O[0, t]= max(C[0, t]- G[0, t]- X[0, t]- V[0, t], 0)
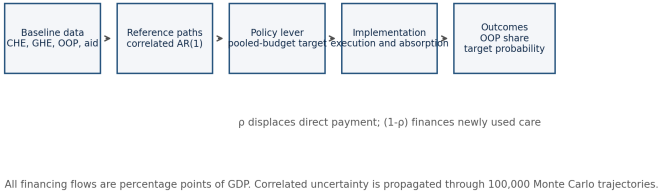
Figure 1. Architecture of the implementation-constrained stochastic health-financing model.
CHE, current health expenditure; GHE, government health expenditure; OOP, out-of-pocket expenditure. The substitution parameter ρ partitions implemented pooled financing between displacement of direct payment and financing of newly used care.
2.4. Policy Module and Accounting Identities
The reference variable G follows the System of Health Accounts concept of domestic general government financing and includes domestic government revenue and recorded social health insurance contributions . NHIA-mandated contributions are therefore captured to the extent that they are recorded in the national health accounts, even when they do not pass through a conventional ministry appropriation; unrecorded contributions are outside the model. For each policy scenario s, B [s, t] denotes planned total domestic government/compulsory health financing, not only a voted government budget. The model specified a linear trajectory for B [s, t] from the 2023 observed value to the scenario's 2035 target. These targets are analytical stress tests, not official government commitments. Only the amount above the simulated reference GHE was treated as incremental:
ΔBs, t= max{Bs, t−G0, t,0}
Incremental budget was multiplied by an implementation factor m [s] that jointly represents execution and provider/system absorptive capacity. The implemented increment was E [s, t] = m [s] x ΔBs, t. A substitution fraction ρ [s] determined the share of implemented financing that replaced OOP. The complement, 1-ρ, represented additional utilisation or quality financed when reduced point-of-service prices released unmet demand. The core identities were:
O[s, t] = max(O[0, t]- ρ[s] x E[s, t], 0)
C[s, t] = C[0, t]+ (1-ρ[s]) x E[s, t]
G[s, t] = G[0, t]+ E[s, t]
These equations preserve financing accounts: an implemented unit either displaces direct payment or adds financed use. They avoid the unrealistic assumption that every unit allocated to insurance reduces total OOP by the same amount.
2.5. Scenarios and Parameter Uncertainty
Four scenarios were evaluated (Table 2). The insurance-led scenario represented compulsory pooling growth without a commensurate implementation transformation. Fiscal expansion represented a larger public envelope with moderate execution and substitution. Integrated reform combined the largest budget target with stronger execution, absorptive capacity, benefits-package credibility and purchasing effectiveness. Implementation and substitution values were sampled once per trajectory from triangular distributions, allowing persistent programme quality differences across futures. Because directly transferable empirical estimates were unavailable, the ranges are transparent scenario assumptions rather than estimated causal parameters.
The ranges were evidence-informed bounds rather than fitted parameters. Nigeria's federal health ministry underspent approved budgets by 31% in 2018 and 47% in 2021 , while a World Bank cross-country assessment found average health-budget underspending of 13% in low- and lower-middle-income settings . These execution patterns informed implementation factors from 0.55 under severe constraints to 0.98 as an aspirational near-complete-execution stress test. For substitution, evidence from Ghana's National Health Insurance Scheme showed that enrolment increased utilisation by 26% but reduced OOP payment by only 4%, illustrating that pooled funds may finance newly used care rather than displace direct payment one-for-one . This comparator evidence motivated a broad 0.50-0.95 substitution span; the values remain scenario assumptions and are not Nigerian claims-ratio estimates.
Table 2. Scenario definitions and uncertainty ranges.

Scenario

2035 budgeted GHE target (% GDP)

Implementation factor

OOP substitution fraction (ρ)

Interpretation

Status quo

Reference process

Not applicable

Not applicable

No incremental policy financing

Insurance-led

1.20

Triangular 0.55, 0.70, 0.85

Triangular 0.50, 0.65, 0.80

Coverage expansion with current-type constraints

Fiscal expansion

2.00

Triangular 0.65, 0.78, 0.90

Triangular 0.60, 0.75, 0.90

Larger public envelope; moderate implementation

Integrated reform

2.20

Triangular 0.80, 0.90, 0.98

Triangular 0.75, 0.85, 0.95

Revenue, pooling, execution and capacity reform

GHE, domestic general government/compulsory health expenditure; OOP, out-of-pocket expenditure. Triangular distributions are reported as minimum, mode, maximum. Scenario targets and ranges are analytical assumptions chosen to span weak-to-strong reform conditions.
2.6. Outcomes and Target-seeking Analysis
The primary outcome was OOP as a percentage of CHE in 2035. We calculated median values, 95% uncertainty intervals (UIs) and the probability of reaching three thresholds: 50%, a minimal structural-transition threshold; 35%, an intermediate analytical target approximately halfway between the 2023 baseline and the protection benchmark; and 20%, the upper bound of the regional protection benchmark . The 35% threshold is not presented as an internationally validated cut-off.
For each reference trajectory, target-seeking analysis solved the budgeted GHE required to reach target share q under the integrated scenario's implementation and substitution distributions. Required effective incremental financing was:
E[required] = (O[0] - q x C[0]) / (ρ + q x (1-ρ))
Budgeted additional financing was E [required]/m, and required total budgeted GHE was reference GHE plus that amount. Values below zero were set to zero.
2.7. Simulation, Validation and Sensitivity Analysis
We generated 100,000 annual trajectories for 2024-2035 using a fixed random seed (20260806). The reference component was assessed with rolling-origin, one-step-ahead predictions for 2015-2023. We calculated mean absolute error (MAE), root-mean-square error (RMSE) and mean error for predicted OOP share. Global sensitivity for the integrated scenario used Spearman rank correlations between the 2035 outcome and reference CHE, reference GHE, external financing, voluntary prepayment, implementation and substitution inputs. All calculations were performed in Python 3.12 using NumPy and pandas; figures were produced with Matplotlib.
The rolling-origin exercise validated only the unconditional reference process. The policy module and its scenario-specific implementation and substitution distributions were not separately validated against observed reform outcomes; threshold probabilities are therefore conditional scenario results, not forecasts. The calibration-window lengths and the 92% rescaling cutoff were held fixed and were not included in the global sensitivity analysis.
3. Results
3.1. Historical Financing Pattern and Model Validation
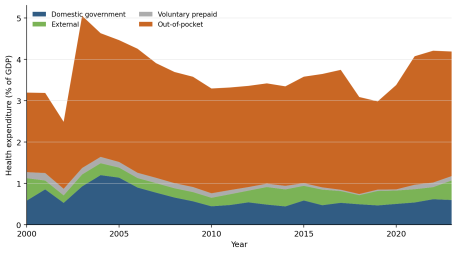
Nigeria's CHE fluctuated between approximately 2.5% and 5.0% of GDP during 2000-2023, but OOP remained the dominant source throughout most of the period (Figure 2). In 2023, CHE was 4.191% of GDP. OOP accounted for 3.013% of GDP, compared with 0.601% from domestic government sources, 0.473% from external sources and 0.104% from voluntary prepayment (Table 1). The resulting OOP share was 71.90%.
Rolling one-step predictions reproduced the OOP-share level with MAE 2.58 percentage points, RMSE 2.94 points and mean error 0.44 points. The largest absolute errors were 5.17 points in 2019 and 4.61 points in 2023, years in which the observed OOP share shifted down relative to the preceding pattern. This validation supports use of the unconditional reference process for conditional scenario comparison while confirming that annual point forecasts remain uncertain. It does not establish empirical validity of the scenario/policy module.
Figure 2. Observed composition of Nigeria's current health expenditure, 2000-2023.
Flows are percentages of GDP. Source: WHO Global Health Expenditure Database via World Development Indicators ; voluntary prepayment derived as domestic private expenditure minus OOP expenditure.
3.2. Scenario Projections to 2035
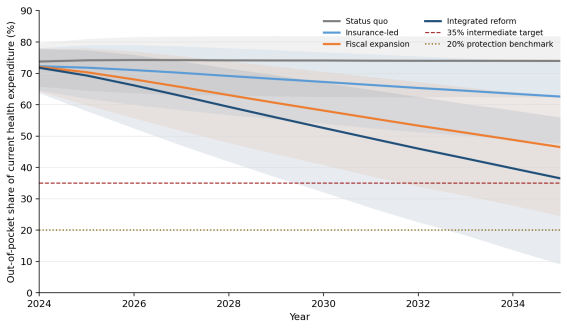
The status quo did not produce a structural financing transition. Its median OOP share was 73.97% in 2035 (95% UI 62.36-81.86), with effectively zero probability of reaching 35% (Table 3; Figure 3). Insurance-led expansion reduced the median to 62.60% (47.60-73.51), but the probability of reaching 50% was only 4.56% and the probability of reaching 35% was 0.07%.
Fiscal expansion generated a materially different financing mix: the median OOP share was 46.48% (24.47-62.42), with a 64.80% probability of reaching 50%. Nevertheless, the probability of reaching 35% was 13.33%, and only 1.12% of trajectories reached 20%. The integrated reform produced the largest shift, to a median of 36.52% (9.16-55.97). It reached 50% in 90.05% of trajectories, 35% in 45.01% and 20% in 10.17%.
Table 3. Projected 2035 financing outcomes by scenario.

Scenario

OOP share, median (95% UI)

Implemented GHE, G[s, t], median (95% UI),% GDP

Pr (OOP <=50%)

Pr (OOP <=35%)

Pr (OOP <=20%)

Status quo

73.97 (62.36-81.86)

0.52 (0.31-0.89)

0.04%

0.00%

0.00%

Insurance-led

62.60 (47.60-73.51)

1.00 (0.88-1.12)

4.56%

0.07%

0.00%

Fiscal expansion

46.48 (24.47-62.42)

1.68 (1.51-1.82)

64.80%

13.33%

1.12%

Integrated reform

36.52 (9.16-55.97)

2.03 (1.90-2.14)

90.05%

45.01%

10.17%

GHE, implemented domestic general government/compulsory health expenditure, G [s, t], after applying the implementation factor; this differs from the budgeted target B [s, t]. GDP, gross domestic product; OOP, out-of-pocket expenditure; Pr, probability; UI, uncertainty interval. Probability values are Monte Carlo proportions from 100,000 trajectories.
Figure 3. Projected out-of-pocket share of current health expenditure, 2024-2035.
Solid lines show medians; shaded bands show 95% uncertainty intervals. The 35% line is an intermediate analytical target; 20% is the upper bound of the WHO African Region protection benchmark . Scenario lines use grey, light blue, orange and dark blue with strong luminance contrast; target lines use dashed and dotted patterns for colour-blind accessibility. The embedded figure is 1781 x 1034 pixels (approximately 283 dpi at its 6.3-inch manuscript width).
3.3. Target-seeking Budget Requirements
Under integrated implementation conditions, the median budgeted GHE required for an OOP share of 50% was 1.57% of GDP (95% UI 0.91-2.61). The corresponding median was 2.27% of GDP (1.37-3.69) for 35% and 3.01% (1.84-4.83) for 20% (Table 4). A 2.2%-of-GDP budget was sufficient in 90.05% of draws for 50%, 45.01% for 35% and 10.17% for 20%. These probabilities are identical to the integrated-scenario threshold probabilities because 2.2% of GDP is that scenario's terminal budget target.
Table 4. Target-seeking domestic government health budget for 2035.

OOP-share target

Required budgeted GHE, median% GDP

95% UI, % GDP

Probability target is attainable at GHE <=2.2% GDP

50%

1.57

0.91-2.61

90.05%

35%

2.27

1.37-3.69

45.01%

20%

3.01

1.84-4.83

10.17%

GHE, domestic general government/compulsory health expenditure; GDP, gross domestic product; OOP, out-of-pocket expenditure; UI, uncertainty interval. Calculations use the integrated scenario's implementation and substitution distributions.
3.4. Sensitivity Analysis
The integrated scenario's 2035 OOP share was most strongly associated with the reference CHE envelope (Spearman r = 0.963). Reference GHE (r = 0.336), external financing (r = 0.176) and voluntary prepayment (r = 0.174) had smaller positive correlations because a fixed budget target creates less incremental policy financing when the reference prepaid pool is already higher. Implementation (r = -0.119) and substitution (r = -0.078) lowered OOP as expected. The dominance of CHE uncertainty shows that financing targets cannot be interpreted independently of the expenditure needs generated by population health, prices and utilisation.
4. Discussion
4.1. Principal Findings
This study makes a practical distinction that is often lost in health-insurance debate: coverage on paper is an institutional input, whereas displacement of point-of-service payment is an outcome. Starting from a 2023 OOP share of 71.9%, an insurance-led scenario that raised budgeted compulsory/public financing to 1.2% of GDP produced a median 2035 OOP share of 62.6%. Larger fiscal expansion was necessary to cross 50% in most trajectories, and integrated reform was necessary even to approach the 35% intermediate target.
The target-seeking analysis sharpens this conclusion. Under strong but uncertain implementation, a median budget of 2.27% of GDP was required for 35%, substantially above the 2023 domestic government level of 0.60%. Reaching the 20% benchmark required a median 3.01% of GDP and was achieved by the 2.2% integrated target in only one in ten trajectories. The results do not imply that 2.27% or 3.01% are universal spending norms. They are model-consistent financing requirements conditional on Nigeria's historical envelope, the accounting structure and explicit implementation assumptions.
4.2. Interpretation for Nigerian Health-financing Reform
The NHIA Act creates an enabling legal framework by making insurance mandatory and establishing a vulnerable-group fund . The model indicates that implementation should be judged by how much compulsory prepayment is converted into effective purchasing and how much user payment disappears at accredited facilities. Enrolment counts remain useful for administration, but they should be paired with OOP incidence, medicine availability, rejected claims, informal charges and service-readiness indicators. Otherwise, enrolment may increase while households continue to purchase medicines, diagnostics and treatment outside the covered pathway.
A second implication is that demand- and supply-side financing must move together. When financial barriers fall, people who previously delayed or forgone care begin to use services. The resulting expenditure is socially desirable if it addresses need, but it means that new pooled money cannot be expected to replace direct payment one-for-one. The model's substitution parameter makes this mechanism explicit. Integrated reform therefore combines revenue mobilisation with predictable facility financing, workforce and commodity availability, digital claims infrastructure, strategic purchasing and accountable execution. This aligns with the broader primary-health-care financing literature, which emphasises public funding and people-centred purchasing rather than insurance labels alone .
Third, donor volatility is a fiscal risk rather than a residual technical issue. External sources financed 11.28% of Nigeria's CHE in 2023. Global projections show tightening government health-spending prospects in many low- and lower-middle-income countries , and WHO reported major aid reductions in 2025 . Nigeria has itself described OOP financing at approximately 72% and called for domestic resource mobilisation . A medium-term financing framework should therefore include explicit replacement rules for externally financed essential services, instead of assuming that aid remains a stable share of CHE.
4.3. Policy Priorities
The findings support a sequenced compact. First, federal and state authorities should specify an annual path for domestic pooled health financing as a share of GDP and publish executed, not merely appropriated, amounts. Second, the NHIA and state agencies should define the covered service and medicine package that new funds are expected to purchase, with independent reporting of effective coverage and residual payment. Third, part of each financing increment should be protected for supply readiness so that increased entitlement does not meet empty pharmacies, unavailable diagnostics or absent personnel. Fourth, financial-protection monitoring should combine annual health-account indicators with periodic microdata estimation using the revised SDG 3.8.2 definition .
The 35% threshold can function as an intermediate planning checkpoint, not a declaration of adequate protection. The 20% benchmark remains the more protective structural objective, while household-level financial hardship should be monitored directly. The wide UIs in this study are therefore decision-relevant: they indicate that a nominal 2.2%-of-GDP target should be accompanied by triggers for additional revenue, efficiency action or benefits-package adjustment if OOP reduction falls behind trajectory.
4.4. Strengths and Limitations
The model has four strengths. It uses a consistent 24-year national expenditure series; preserves correlated uncertainty among financing sources; separates budget ambition from implemented financing; and distinguishes OOP substitution from newly financed utilisation. The rolling validation error was modest relative to the historical OOP level, and all scenario assumptions, equations and thresholds are reported transparently. The target-seeking component converts a descriptive projection into a decision quantity that ministries of health and finance can interrogate.
Several limitations are important. First, aggregate health accounts cannot measure distributional protection. A lower national OOP share may coexist with severe hardship among poor, rural, older or chronically ill households. The revised SDG 3.8.2 indicator must be estimated from microdata . Second, the model is an accounting-policy simulation, not a causal estimate of insurance or public-spending effects. Implementation and substitution ranges are scenarios; their transfer to particular programmes requires empirical calibration. Third, the model does not disaggregate federal, state and local financing, benefits packages, provider types, diseases or medicines. Fourth, CHE/GDP uncertainty dominates the results, and health prices, epidemiological change and macro-fiscal shocks are represented only through the historical stochastic process. Fifth, only the unconditional reference process was internally, not externally, validated; the scenario/policy module was not separately validated, and its probabilities should not be interpreted as forecasts. Sixth, the ten- and fifteen-observation calibration windows and the 92% rescaling safeguard were fixed rather than varied, so structural sensitivity to these choices remains. Seventh, the 2023 data were the latest complete comparable health-account observations available at extraction; subsequent revisions could alter the baseline.
These limitations favour cautious use. The model should be updated when new health accounts, expenditure surveys, budget-execution records and claims data become available. Programme-specific versions should replace scenario ranges with observed execution, service-readiness and benefit-incidence parameters.
5. Conclusion
Nigeria is unlikely to finance its way out of high direct payment through insurance enrolment alone. In this model, a 1.2%-of-GDP insurance-led path left OOP above 60% of CHE in the median trajectory. Larger public financing changed the structure, but only an integrated 2.2%-of-GDP pathway approached a 35% OOP share, and it did so with a probability of 45%. A credible reform contract should therefore bind together domestic revenue, compulsory pooling, executed purchasing, provider capacity and direct measurement of residual household payment. Computational modelling cannot choose the political pathway, but it can make the financing consequences and uncertainty visible before commitments are mistaken for protection.
Abbreviations

AR (1)

First-order Autoregressive Process

CHE

Current Health Expenditure

GDP

Gross Domestic Product

GHE

Domestic General Government/compulsory Health Expenditure

MAE

Mean Absolute Error

NHIA

National Health Insurance Authority

OOP

Out-of-pocket Health Expenditure

Pr

Probability

RMSE

Root Mean Squared Error

SDG

Sustainable Development Goal

UI

Uncertainty Interval

WHO

World Health Organization

ρ

Substitution Fraction Representing the Share of Implemented Pooled Financing That Displaces OOP Spending.

Author Contributions
Adesegun Nurudeen Osijirin: Data curation, Formal Analysis, Methodology, Software, Visualization, Writing – original draft
Felicia Nonye Egbeh: Conceptualization, Validation, Writing – review & editing
Deborah Ngozi Umah: Conceptualization, Validation, Writing – review & editing
Charles Ifeanyi Anumaka: Conceptualization, Validation, Writing – review & editing
Data Availability Statement
All input series are openly available from the WHO Global Health Expenditure Database and the World Bank World Development Indicators. Indicator codes were SH.XPD.CHEX.GD.ZS, SH.XPD.GHED.GD.ZS, SH.XPD.OOPC.CH.ZS, SH.XPD.EHEX.CH.ZS and SH.XPD.PVTD.CH.ZS. The equations, scenario distributions, random seed and transformation rules needed to reproduce the analysis are reported in the Methods and Supplementary Model Specification. Executable code is available from the corresponding author on reasonable request.
Conflicts of Interest
The authors declare no conflicts of interest.
References
[1] Aniebo, C. L., Lawani, L. O., & Eze, P. (2026). The burden and socioeconomic inequality in catastrophic out-of-pocket health expenditure in post-pandemic Nigeria. Global Social Welfare, 13, 205-218.
[2] Aregbeshola, B. S., & Khan, S. M. (2018). Out-of-pocket payments, catastrophic health expenditure and poverty among households in Nigeria 2010. International Journal of Health Policy and Management, 7(9), 798-806.
[3] Briggs, A. H., Weinstein, M. C., Fenwick, E. A. L., Karnon, J., Sculpher, M. J., & Paltiel, A. D. (2012). Model parameter estimation and uncertainty analysis: A report of the ISPOR-SMDM Modeling Good Research Practices Task Force Working Group-6. Medical Decision Making, 32(5), 722-732.
[4] Caro, J. J., Briggs, A. H., Siebert, U., & Kuntz, K. M. (2012). Modeling good research practices—Overview: A report of the ISPOR-SMDM Modeling Good Research Practices Task Force-1. Value in Health, 15(6), 796-803.
[5] Eddy, D. M., Hollingworth, W., Caro, J. J., Tsevat, J., McDonald, K. M., & Wong, J. B. (2012). Model transparency and validation: A report of the ISPOR-SMDM Modeling Good Research Practices Task Force-7. Medical Decision Making, 32(5), 733-743.
[6] Federal Ministry of Health and Social Welfare, Nigeria. (2025). Nigeria statement on health financing and universal health coverage at the Seventy-eighth World Health Assembly.
[7] Hafez, R. (2018). Nigeria health financing system assessment. World Bank.
[8] Hanson, K., Brikci, N., Erlangga, D., Alebachew, A., De Allegri, M., Balabanova, D., Blecher, M., Cashin, C., Esperato, A., Hipgrave, D., Kalisa, I., Kurowski, C., Meng, Q., Morgan, D., Mtei, G., Nolte, E., Onoka, C., Powell-Jackson, T., Roland, M., … Wurie, H. (2022). The Lancet Global Health Commission on financing primary health care: Putting people at the centre. The Lancet Global Health, 10(5), e715-e772.
[9] Homer, J. B., & Hirsch, G. B. (2006). System dynamics modeling for public health: Background and opportunities. American Journal of Public Health, 96(3), 452-458.
[10] Kutzin, J. (2013). Health financing for universal coverage and health system performance: Concepts and implications for policy. Bulletin of the World Health Organization, 91(8), 602-611.
[11] Kurowski, C., Schmidt, M., Evans, D. B., Tandon, A., Eozenou, P. H.-V., Cain, J. S., & Pambudi, E. S. (2024). Government health spending outlook: Projections through 2029—Diverging fiscal pressures, uneven constraints. World Bank.
[12] Leerapan, B., Teekasap, P., Urwannachotima, N., Jaichuen, W., Chiangchaisakulthai, K., Udomaksorn, K., Meeyai, A., Noree, T., & Sawaengdee, K. (2021). System dynamics modelling of health workforce planning to address future challenges of Thailand’s Universal Health Coverage. Human Resources for Health, 19, Article 31.
[13] National Health Insurance Authority. (n.d.). About us. Retrieved August 6, 2026, from
[14] National Health Insurance Authority Act, 2022, No. 17, A 625-A 653 (Nigeria).
[15] Sterman, J. D. (2000). Business dynamics: Systems thinking and modeling for a complex world. Irwin/McGraw-Hill.
[16] Wagstaff, A., Flores, G., Hsu, J., Smitz, M.-F., Chepynoga, K., Buisman, L. R., van Wilgenburg, K., & Eozenou, P. (2018). Progress on catastrophic health spending in 133 countries: A retrospective observational study. The Lancet Global Health, 6(2), e169-e179.
[17] World Bank. (n.d.). World Development Indicators: Nigeria health expenditure indicators. Retrieved August 6, 2026, from
[18] World Health Organization. (2010). The world health report 2010: Health systems financing—The path to universal coverage.
[19] World Health Organization. (n.d.-a). Financial hardship in health and components (SDG 3.8.2, 2025 definition): Indicator metadata. Retrieved August 6, 2026, from
[20] World Health Organization. (n.d.-b). Global health expenditure database. Retrieved August 6, 2026, from
[21] World Health Organization. (n.d.-c). Health financing. Retrieved August 6, 2026, from
[22] World Health Organization. (2025, November 3). WHO issues guidance to address drastic global health financing cuts.
[23] World Health Organization, & World Bank. (2023). Tracking universal health coverage: 2023 global monitoring report. World Health Organization.
[24] World Health Organization Regional Office for Africa. (2024a). Regional brief: Trends in financial hardship due to out-of-pocket health spending in the WHO African Region.
[25] World Health Organization Regional Office for Africa. (2024b). WHO African Region health expenditure atlas 2023.
[26] World Health Organization Regional Office for Africa. (2025). Nigeria health system and services profile: Health financing. African Health Observatory Platform.
[27] International Budget Partnership. (2023). Examining budget credibility in Nigeria's health sector.
[28] World Bank. (2025). Budget execution in health: From bottlenecks to solutions. World Bank.
[29] Sarkodie, A. O. (2021). Effect of the National Health Insurance Scheme on healthcare utilization and out-of-pocket payment: Evidence from GLSS 7. Humanities and Social Sciences Communications, 8, Article 293.
Cite This Article
  • APA Style

    Osijirin, A. N., Egbeh, F. N., Umah, D. N., Anumaka, C. I. (2026). Beyond Insurance Enrolment: An Implementation-Constrained Stochastic Health-Financing Model of Out-of-Pocket Spending in Nigeria, 2024-2035. International Journal of Health Economics and Policy, 11(4), 159-168. https://doi.org/10.11648/j.hep.20261104.11

    Copy | Download

    ACS Style

    Osijirin, A. N.; Egbeh, F. N.; Umah, D. N.; Anumaka, C. I. Beyond Insurance Enrolment: An Implementation-Constrained Stochastic Health-Financing Model of Out-of-Pocket Spending in Nigeria, 2024-2035. Int. J. Health Econ. Policy 2026, 11(4), 159-168. doi: 10.11648/j.hep.20261104.11

    Copy | Download

    AMA Style

    Osijirin AN, Egbeh FN, Umah DN, Anumaka CI. Beyond Insurance Enrolment: An Implementation-Constrained Stochastic Health-Financing Model of Out-of-Pocket Spending in Nigeria, 2024-2035. Int J Health Econ Policy. 2026;11(4):159-168. doi: 10.11648/j.hep.20261104.11

    Copy | Download

  • @article{10.11648/j.hep.20261104.11,
      author = {Adesegun Nurudeen Osijirin and Felicia Nonye Egbeh and Deborah Ngozi Umah and Charles Ifeanyi Anumaka},
      title = {Beyond Insurance Enrolment: An Implementation-Constrained Stochastic Health-Financing Model of Out-of-Pocket Spending in Nigeria, 2024-2035},
      journal = {International Journal of Health Economics and Policy},
      volume = {11},
      number = {4},
      pages = {159-168},
      doi = {10.11648/j.hep.20261104.11},
      url = {https://doi.org/10.11648/j.hep.20261104.11},
      eprint = {https://article.sciencepublishinggroup.com/pdf/10.11648.j.hep.20261104.11},
      abstract = {Background: Nigeria's health system remains dominated by direct household payment despite mandatory-insurance legislation. Policy debate often treats enrolment growth as equivalent to financial protection, although the effect of new pooled funds depends on budget execution, provider absorptive capacity and the extent to which prepayment replaces rather than supplements out-of-pocket expenditure. Methods: We developed a dynamic stochastic accounting model using annual Nigeria health-expenditure series for 2000-2023. Correlated mean-reverting processes generated reference trajectories for current health expenditure, domestic government health expenditure, external financing and voluntary prepayment. We simulated four 2024-2035 scenarios: status quo, insurance-led expansion, fiscal expansion and integrated reform. Policy funds were filtered through implementation and substitution parameters. One hundred thousand Monte Carlo trajectories propagated empirical and scenario uncertainty. Primary outcomes were the out-of-pocket share of current health expenditure in 2035 and the probability of reaching 50%, 35% and 20% thresholds. Rolling-origin validation assessed the reference model. Results: In 2023, out-of-pocket payments were 71.9% of current health expenditure and domestic government health expenditure was 0.60% of gross domestic product (GDP). The model's one-step rolling predictions had a mean absolute error of 2.58 percentage points. Median 2035 out-of-pocket shares were 74.0% (95% uncertainty interval [UI] 62.4-81.9) under the status quo, 62.6% (47.6-73.5) under insurance-led expansion, 46.5% (24.5-62.4) under fiscal expansion and 36.5% (9.2-56.0) under integrated reform. The integrated scenario had a 45.0% probability of reaching 35% and a 10.2% probability of reaching 20%. Target-seeking analysis indicated that a 35% share would require median budgeted domestic government health expenditure of 2.27% of GDP (95% UI 1.37-3.69); reaching 20% required 3.01% (1.84-4.83). Conclusions: Enrolment-led reform without commensurate public revenue and implementation capacity is unlikely to deliver financial protection. Nigeria's financing strategy should use the out-of-pocket share as an explicit outcome, link compulsory pooling to supply-side readiness and budget execution, and treat 2.2% of GDP as a plausible but not sufficient integrated-reform test rather than a guaranteed route to the 35% threshold.},
     year = {2026}
    }
    

    Copy | Download

  • TY  - JOUR
    T1  - Beyond Insurance Enrolment: An Implementation-Constrained Stochastic Health-Financing Model of Out-of-Pocket Spending in Nigeria, 2024-2035
    AU  - Adesegun Nurudeen Osijirin
    AU  - Felicia Nonye Egbeh
    AU  - Deborah Ngozi Umah
    AU  - Charles Ifeanyi Anumaka
    Y1  - 2026/11/09
    PY  - 2026
    N1  - https://doi.org/10.11648/j.hep.20261104.11
    DO  - 10.11648/j.hep.20261104.11
    T2  - International Journal of Health Economics and Policy
    JF  - International Journal of Health Economics and Policy
    JO  - International Journal of Health Economics and Policy
    SP  - 159
    EP  - 168
    PB  - Science Publishing Group
    SN  - 2578-9309
    UR  - https://doi.org/10.11648/j.hep.20261104.11
    AB  - Background: Nigeria's health system remains dominated by direct household payment despite mandatory-insurance legislation. Policy debate often treats enrolment growth as equivalent to financial protection, although the effect of new pooled funds depends on budget execution, provider absorptive capacity and the extent to which prepayment replaces rather than supplements out-of-pocket expenditure. Methods: We developed a dynamic stochastic accounting model using annual Nigeria health-expenditure series for 2000-2023. Correlated mean-reverting processes generated reference trajectories for current health expenditure, domestic government health expenditure, external financing and voluntary prepayment. We simulated four 2024-2035 scenarios: status quo, insurance-led expansion, fiscal expansion and integrated reform. Policy funds were filtered through implementation and substitution parameters. One hundred thousand Monte Carlo trajectories propagated empirical and scenario uncertainty. Primary outcomes were the out-of-pocket share of current health expenditure in 2035 and the probability of reaching 50%, 35% and 20% thresholds. Rolling-origin validation assessed the reference model. Results: In 2023, out-of-pocket payments were 71.9% of current health expenditure and domestic government health expenditure was 0.60% of gross domestic product (GDP). The model's one-step rolling predictions had a mean absolute error of 2.58 percentage points. Median 2035 out-of-pocket shares were 74.0% (95% uncertainty interval [UI] 62.4-81.9) under the status quo, 62.6% (47.6-73.5) under insurance-led expansion, 46.5% (24.5-62.4) under fiscal expansion and 36.5% (9.2-56.0) under integrated reform. The integrated scenario had a 45.0% probability of reaching 35% and a 10.2% probability of reaching 20%. Target-seeking analysis indicated that a 35% share would require median budgeted domestic government health expenditure of 2.27% of GDP (95% UI 1.37-3.69); reaching 20% required 3.01% (1.84-4.83). Conclusions: Enrolment-led reform without commensurate public revenue and implementation capacity is unlikely to deliver financial protection. Nigeria's financing strategy should use the out-of-pocket share as an explicit outcome, link compulsory pooling to supply-side readiness and budget execution, and treat 2.2% of GDP as a plausible but not sufficient integrated-reform test rather than a guaranteed route to the 35% threshold.
    VL  - 11
    IS  - 4
    ER  - 

    Copy | Download

Author Information
  • Abstract
  • Keywords
  • Document Sections

    1. 1. Introduction
    2. 2. Methods
    3. 3. Results
    4. 4. Discussion
    5. 5. Conclusion
    Show Full Outline
  • Abbreviations
  • Author Contributions
  • Data Availability Statement
  • Conflicts of Interest
  • References
  • Cite This Article
  • Author Information