Abstract
Rainfall, a critical determinant of agriculture, water resources, and socioeconomic stability, was analyzed for seasonal and annual variability in the Dawuro Zone, Ethiopia, from 1991 to 2020. Using time series data from seven meteorological stations and four virtual stations, statistical methods such as the Coefficient of Variation (CV), Standard Anomaly Index (SAI), Sen’s Slope Estimator, and Modified Mann-Kendall test were employed, alongside Inverse Distance Weighted interpolation in ArcGIS for spatial analysis. The study revealed significant variability, with Tocha recording the highest mean annual rainfall (1998 mm) and Tercha the lowest (1399.5 mm). Tercha exhibited the least consistent rainfall, while Gasechere showed the highest variability (CV 31.82%, SD 600.37 mm). The Kiremt season (June-September) contributed the most to annual rainfall, with Tocha receiving 973.99 mm and Tercha 696.03 mm, while the Belg (February-May) and Bega (October-January) seasons showed lower contributions and higher variability, particularly at Gena Bossa and Gasechere. Spatially, the southwest, south, and southeast regions received higher rainfall, while the north and northeast experienced the lowest amount. This study investigates the onset, cessation, and duration of the rainy season in the Dawuro Zone, Ethiopia, from 1991 to 2020, with particular attention to the Kiremt season (June-September). The start of the rainy season, characterized by heavy rainfall, varies considerably, from mid-September to late September, with delays in years like 1994, 2000, and 2015 (around September 27-28) and earlier starts in 1992 and 2006 (around September 19-20). Cessation dates, occurring between mid-December and late December, show similar variability, with longer seasons ending around December 19-20 (e.g., 1995, 2005, 2015) and shorter ones around December 15-16 (e.g., 2000, 2010). The length of the growing season ranges from 90 to 110 days, reaching a maximum of 106-108 days in 1994, 2002, and 2016, and decreasing to 96-98 days in 1998 and 2012. This variability, driven by factors such as the Inter-Tropical Convergence Zone and El Niño-Southern Oscillation, presents challenges for agricultural planning by affecting crop selection and increasing the risk of failure due to shortened seasons or waterlogging in extended ones. The next study will consider the association between seasonal rainfall variability and global systems like El Niño-Southern Oscillation, Indian Dipole oscillation, and other global systems over the study area. The study recommends expanding meteorological stations, integrating findings into regional policies for sustainable agriculture and water management, and enhancing early warning systems to address the variable rainfall patterns across the Kiremt, Belg, and Bega seasons.
|
Published in
|
Innovation (Volume 6, Issue 3)
|
|
DOI
|
10.11648/j.innov.20250603.18
|
|
Page(s)
|
112-125 |
|
Creative Commons
|

This is an Open Access article, distributed under the terms of the Creative Commons Attribution 4.0 International License (http://creativecommons.org/licenses/by/4.0/), which permits unrestricted use, distribution and reproduction in any medium or format, provided the original work is properly cited.
|
|
Copyright
|
Copyright © The Author(s), 2025. Published by Science Publishing Group
|
Keywords
Rainfall Variability, Seasonal Rainfall, Trends, Dawuro Zone, Ethiopia
1. Introduction
Background
Climate variability and change are disrupting socio-ecological systems worldwide, and while climate change is a global problem, its negative impacts may vary in severity among countries, nations, and levels of socioeconomic status
| [16] | IPCC-FIELD, C.B., BARROS, V., MACH, K. and MASTRANDREA, M., 2014. Climate Change 2014: Impacts, Adaptation, and Vulnerability. |
[16]
. Climate change is one of the most significant problems facing the planet in the twenty-first century
| [1] | Abidoye, B. O., & Odusola, A. F. (2015). Climate Change and Economic Growth in Africa: An Econometric Analysis. Journal of African Economies, 24(2), 277-301. https://doi.org/10.1093/jae/eju033 |
[1]
. Notably, climatic variability and change are caused by either natural or anthropogenic (human) factors. Globally, variations in rainfall throughout both space and time have an impact on all facets of human endeavor, particularly social and agricultural economies. Climate change has a substantial impact on vulnerable areas, especially in Africa
| [5] | Syaharuddin, Fatmawati, & Suprajitno, H. (2022). Investigations on Impact of Feature Normalization Techniques for Prediction of Hydro-Climatology Data Using Neural Network Backpropagation with Three Layer Hidden. International Journal of Sustainable Development and Planning, 17(7), 2069-2074. https://doi.org/10.18280/ijsdp.170707 |
[5]
. One of the most food-insecure regions in the world, East Africa requires humanitarian assistance due to its erratic seasonal and annual rainfall patterns and catastrophic weather occurrences
| [15] | Gwam, C.U., 2010. 22. World Meteorological Organization (WMO). |
[15]
.
Rainfall has a significant impact on the distribution and availability of soil moisture, which is critical for crop production, especially in sub-Saharan African nations that depend on rain-fed agricultural systems
| [17] | Adane, A. and Asmerom, B., 2025. Analysis of spatiotemporal distribution, variability, and trends of rainfall in Wollo area, Northeastern Ethiopia. PloS one, 20(1), p. e0312889. |
[17]
. Since rain-fed agriculture employs around 85% of Ethiopia's labor force and is heavily dependent on rainfall availability, which is crucial for crop production, rainfall is specifically the most important meteorological indicator in Ethiopia
| [4] | Hailu, D., Woldetsadik, M., & Ayal, D. Y. (2024). Trends and variability in annual and seasonal rainfall amount and timing in Wereilu district, Northeastern Highlands of Ethiopia. Environmental Challenges, 17(November), 101055. https://doi.org/10.1016/j.envc.2024.101055 |
[4]
. Rainfall trends are less stable; in some places, especially during the extended rains, precipitation is decreasing, while in other places, extreme rainfall events are becoming more intense. In Ethiopia, rainfall displays significant seasonal and annual variability, influenced by large-scale climatic phenomena such as the El Niño-Southern Oscillation (ENSO), sea surface temperatures (SSTs) in the Atlantic and Indian Oceans, and regional topographic variations
| [18] | Alhamshry, A., Ayele, F. A., Yasuda, H., Kimura, R., & Shimizu, K. (2019). Seasonal Rainfall Variability in Ethiopia and Its. Water, 12(55), 1-19. |
[18]
.
Agriculture in Ethiopia, especially in the Dawuro Zone, depends heavily on rain-fed systems, making it highly vulnerable to seasonal and annual rainfall variability and trends. Located in southwestern Ethiopia, the Dawuro Zone experiences a complex climate influenced by its diverse topography and the seasonal movement of the Intertropical Convergence Zone (ITCZ). The region has three main seasons: Kiremt (June-September, the primary rainy season), Belg (February-May, a shorter rainy season), and Bega (October-January, the dry season). However, recent studies across Ethiopia reveal significant variability in rainfall over time and space, with some areas seeing increases in annual and Kiremt rainfall, while Belg rainfall often shows a decreasing trend. These changes, along with high variability from year to year, pose serious risks to agriculture, water management, and food security in the Dawuro Zone. The lack of region-specific studies on rainfall variability and trends in the Dawuro Zone limits the ability to develop effective climate adaptation strategies tailored to local conditions. Without a comprehensive understanding of historical rainfall patterns, including onset, cessation, and extreme events like droughts and floods, farmers and policymakers struggle to plan agricultural activities, manage water resources, and reduce climate-related risks. Furthermore, the potential impact of global climate phenomena such as El Niño-Southern Oscillation (ENSO) on local rainfall patterns remains underexplored in this region, adding uncertainty to long-term planning. This study aims to fill this critical knowledge gap by analyzing seasonal and annual rainfall variability and trends in the Dawuro Zone using historical meteorological data. By employing statistical methods such as the Mann-Kendall trend test, Sen’s slope estimator, coefficient of variation (CV), and standardized anomaly index (SAI), the research will quantify the extent of rainfall variability, identify significant trends, and assess their implications for agriculture and livelihoods. The findings will serve as a foundation for developing specific adaptation strategies, such as improved crop varieties, water harvesting methods, and early warning systems, to boost resilience against climate variability and change in the Dawuro Zone.
2. Materials and Methods
2.1. Description of the Study Area
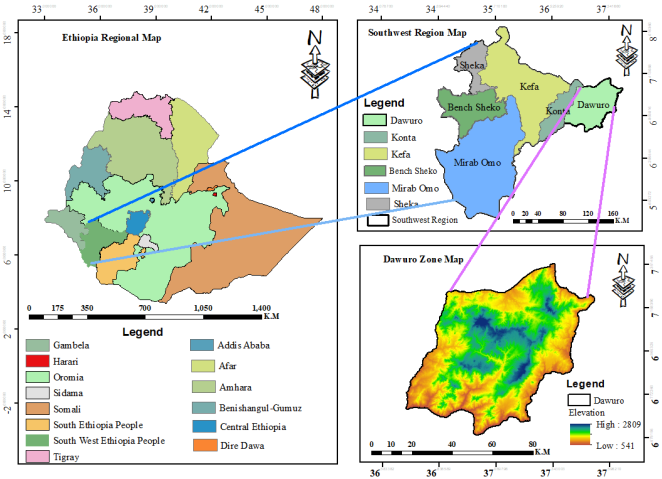
The Dawuro zone is located in the South-West region of Ethiopia between the latitudes of 6° 58' 11" North and a Longitude of 37° 6' 31" East. Dawuro, which means “heroic people”. Their language is Dawurotsuwa, which belongs to the Omotic family. In addition, the Dawuro Zone, also known as Dawro, is situated in the Southwest Ethiopia Peoples' Region of Ethiopia, roughly 500 kilometers southwest of Addis Ababa, the country's capital; 111 kilometers west of Wolaita Sodo; and 319 kilometers from Hawassa, the Sidama Region. According to the 2007 Ethiopian Population and Housing Census, the population of the Dawuro nationality was projected to be 846,199 in 2014. The majority of the Dawuro Zone's economy is derived from mixed crop-livestock farming, where about 85% of the workforce is employed. Esete (Ensete ventricosum), a staple crop, is planted extensively alongside other crops like teff and maize. The zone's forest cover, which makes up around 137,308.825 hectares (30% of the total land area), encompasses a range of vegetation types, including highland moist evergreen forests, midland dry evergreen montane forests, and lowland Combretum-Terminalia woodlands. Additionally, Dawuro is home to 274 traditional medicinal plant species that are used by local healers to treat human and animal diseases. The Gilgel Gibe III Dam, Ethiopia's second-largest hydroelectric dam, is located on the Omo River between the Dawuro and Wolayita zones. One of the local tourist attractions is the Halala Kela Luxury Resort in Loma Woreda. Tercha serves as the capital city of the Dawuro Zone, which is composed of several woredas (districts), including Tocha, Mareka, and Loma. According to numerous studies, Ethiopia as a whole has seen discernible changes in its climate over the past few decades, including variations in the distribution of rainfall and rising temperatures. These changes are ascribed to both local and global climate change influences, such as deforestation and changes in land use, as well as the migration of the Intertropical Convergence Zone (ITCZ).
Figure 1. The study area description of the Dawuro zone map.
2.2. Climate Patterns of the Dawuro Zone
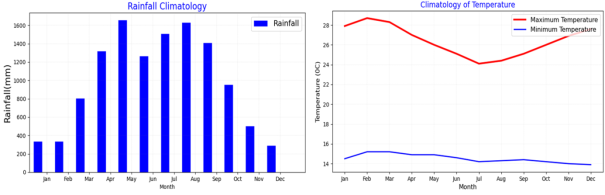
The climate of the Dawuro zone is influenced by the Intertropical Convergence Zone (ITCZ), which shifts north and south with the seasons. The ITCZ generates winds during the rainy season in the zone, often accompanied by heavy rainfall. The regions receive minimal rainfall during short rainy seasons; specifically, Bega (October to January) experiences between 0 and approximately 200 mm of precipitation. However, January and December show the lowest rainfall amounts, indicating a pronounced dry period. In contrast, the Belg seasons, from February to May, see an increase in rainfall, starting at around 200 mm in February and peaking in April and May at around 600-800 mm. This suggests a transitional period with moderate rains across the study area. Conversely, the main rainy season is the Kirmet season, which lasts from June to September. During the Kirmet season, the study area receives a substantial amount of rainfall, peaking in June, July, and August at over 1400-1600 mm. In September, while the rainfall amount declines, it remains significant at around 800 mm, marking the end of the wet season in the study area. Overall, the regions exhibit a unimodal rainfall pattern, with the majority of precipitation concentrated in the June-to-September period, consistent with the Kirmet season, while the rest of the year remains relatively dry. For a detailed explanation, please refer to the figure below.
Figure 2. Climatology of Mean Annual rainfall and Temperature of the study area (1991-2020).
2.3. Data Types and Sources
2.3.1. Meteorological Data
For this study, daily rainfall data for seven meteorological stations in the Dawuro Zone were obtained from the Ethiopian Meteorological Institute (EMI) for the years 1991-2020. Additionally, the Enhanced National Climate Services (ENACTS) dataset (1991-2020) was acquired from the same institute and used to fill in missed data. The ENACTS dataset is a high-resolution gridded dataset (4 km x 4 km), and it is essential for a country like Ethiopia, where stations are sparse. The data are integrated with quality-controlled station data from the national observation network and regionally calibrated satellite-derived data
| [3] | Dinku, T., Faniriantsoa, R., Cousin, R., Khomyakov, I., Vadillo, A., Hansen, J. W., & Grossi, A. (2022). ENACTS: Advancing Climate Services Across Africa. Frontiers in Climate, 3(January), 1-16. https://doi.org/10.3389/fclim.2021.787683 |
[3]
.
2.3.2. Spatial Data
In this study, we used a 12.5 m * 12.5 m resolution Digital Elevation Model (DEM) from the USGS Earth Explorer website (https://earthexplorer.usgs.gov/). The DEM provided important basin attributes, including slope gradient, slope length, stream network, and stream characteristics, and was utilized to set the basin boundaries (channel slope, width, and length).
3. Methods
3.1. Data Homogeneity Test by Climate Data Tools (CDT)
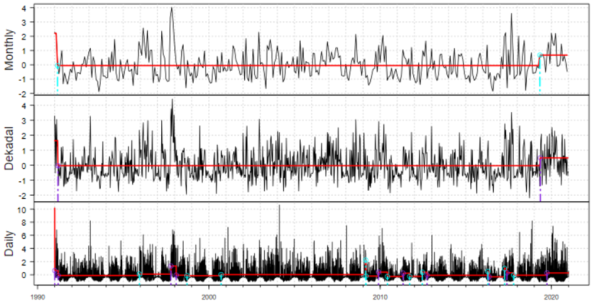
Figure 3. Inhomogeneous Rainfall Time Series data for the Esara station.
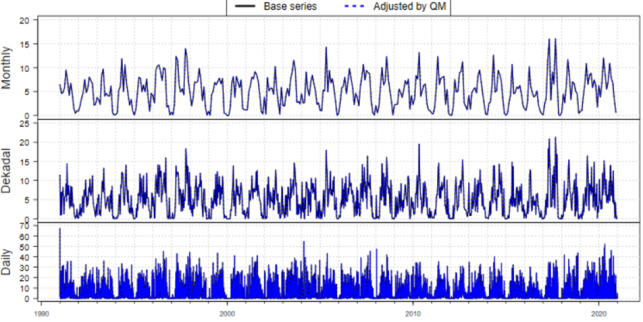
Figure 4. Homogeneous rainfall Time series data for the Esara station.
The International Research Institute for Climate and Society (IRI) created the Climate Data Tool (CDT), an open-source R-based program for combining satellite and reanalysis data with meteorological data and for quality control and homogenization. In order to guarantee that climate time series are free from non-climatic influences such as instrument modifications, station relocations, or observational routines, which could produce fictitious trends or breakpoints, it incorporates particular functions for homogeneity testing. For accurate climatic trend analysis, variability, and evaluations of extreme events, a homogeneity test is essential
| [3] | Dinku, T., Faniriantsoa, R., Cousin, R., Khomyakov, I., Vadillo, A., Hansen, J. W., & Grossi, A. (2022). ENACTS: Advancing Climate Services Across Africa. Frontiers in Climate, 3(January), 1-16. https://doi.org/10.3389/fclim.2021.787683 |
[3]
. The Pettit, Standard Normal Homogeneity, Buishand, and other tests are some of the techniques used to take into consideration for homogeneity. The Standard Normal Homogeneity approach strategy yielded the best results when the various homogeneity test techniques were assessed. This study used the Standard Normal Homogeneity approach. This standard normal homogeneity test (SNHT), created by
| [2] | Alexandersson, H., & Moberg, A. (1997). Homogenization of Swedish temperature data. Part I: Homogeneity test for linear trends. International Journal of Climatology: A Journal of the Royal Meteorological Society, 17(1), 25-34. |
[2]
, is an effective method for identifying and evaluating minute variations in the mean value of a candidate series relative to a homogeneous reference series. For the homogeneity tests, we utilized the R package software Climate Data Tools (CDT). Both the homogeneity test and outlier identification were employed to assess the quality of the data. As shown in the figures, the outliers are examined through both temporal and spatial dimensions. The use of quantile matching was made to address non-homogeneities, referring to the
Figures 3&4.
3.2. Trend Analysis
There are several approaches to trend analysis. Parametric and non-parametric approaches are the two kinds used to identify meaningful trends in climatological time series
| [8] | Duhan, D., & Pandey, A. (2013). Statistical analysis of long term spatial and temporal trends of precipitation during 1901-2002 at Madhya Pradesh, India. Atmospheric Research, 122, 136-149. https://doi.org/10.1016/j.atmosres.2012.10.010 |
[8]
. According to
| [7] | Kocsis, T., Kovács-Székely, I., & Anda, A. (2017). Comparison of parametric and non-parametric time-series analysis methods on a long-term meteorological data set. Central European Geology, 60(3), 316-332. https://doi.org/10.1556/24.60.2017.011 |
[7]
, trend tests are used to determine whether a random variable's values are generally increasing or decreasing over time. The Mann-Kendall (MK) trend test was applied to determine the monotonic trend of extreme climatic indices. The MK trend test was first proposed by
| [9] | Henry, M. (1945). Nonparametric Tests Against Trend Author: Henry B. Mann Published by : The Econometric Society Stable. Econometrica, 13(3), 245-259. https://www.jstor.org/stable/1907187 |
[9]
and further studied by
. The method was later improved by allowing seasonality to be taken into consideration
| [10] | Hirsch, R. M., Slack, J. R., & Geological, U. S. (1984). Rill R. Water Resources, 20(6), 727-732. |
[10]
. On the other hand, the MK trend test requires the observations to be serially independent. Therefore, the modified MK test is used in this study. The modified MK test estimates the autocorrelation between the ranks of the data after removing the apparent trend to examine the effect of autocorrelation. In this method, adjusted variance (Var(S)) is used to calculate Z statistics from the standard Mann-Kendall test
| [13] | Theil, H., 1950. A rank-invariant method of linear and polynomial regression analysis. Indagationes mathematicae, 12(85), p. 173. |
[13]
. The following Smk statistics are used to first determine the mathematical form of the MK test.
(1)
(2)
(4)
(6)
(7)
(8)
According to the test principle, the values of the data over time, jth and kth, must be greater than 10, and Sgn(xi-xj) is the Sgn function. As Var(Smmk), the autocorrelated value for the modified MK, W represents the modified coefficient of autocorrelated data, rk represents the kth out-correlated coefficient, and X represents the series means. The confidence level was bounded (𝛼 = 5%) and used to compare the expected Zcal value to the standard normal distribution
| [9] | Henry, M. (1945). Nonparametric Tests Against Trend Author: Henry B. Mann Published by : The Econometric Society Stable. Econometrica, 13(3), 245-259. https://www.jstor.org/stable/1907187 |
| [11] | Kampata, J. M., Parida, B. P., & Moalafhi, D. B. (2008). Trend analysis of rainfall in the headstreams of the Zambezi River Basin in Zambia. Physics and Chemistry of the Earth, 33(8-13), 621-625. https://doi.org/10.1016/j.pce.2008.06.012 |
| [12] | Kendall, K. (1975). Thin-film peeling-the elastic term. Journal of Physics D: Applied Physics, 8(13), 1449-1452. https://doi.org/10.1088/0022-3727/8/13/005 |
[9, 11, 12]
. The Sen’s slope is used to investigate the trendline. It is based on studies by
| [13] | Theil, H., 1950. A rank-invariant method of linear and polynomial regression analysis. Indagationes mathematicae, 12(85), p. 173. |
[13]
and
| [14] | Sen, P.K., 1968. Estimates of the regression coefficient based on Kendall's tau. Journal of the American Statistical Association, 63(324), pp. 1379-1389. |
[14]
. It is calculated as shown in the equation below:
(9)
Qβ shows the trend line estimate, while it reflects the measured data. The direction and size of an ascending trend are shown by Q's positive value, while a descending trend is expressed by Q's negative value
| [6] | Yue, S., Pilon, P., & Phinney, B. (2003). Canadian streamflow trend detection: Impacts of serial and cross-correlation. Hydrological Sciences Journal, 48(1), 51-63. https://doi.org/10.1623/hysj.48.1.51.43478 |
[6]
.
3.3. Standardized Rainfall Anomaly
To prevent regions and seasons with very high rainfall from dominating the utilized data, it needed to be normalized
| [6] | Yue, S., Pilon, P., & Phinney, B. (2003). Canadian streamflow trend detection: Impacts of serial and cross-correlation. Hydrological Sciences Journal, 48(1), 51-63. https://doi.org/10.1623/hysj.48.1.51.43478 |
[6]
. The standardized rainfall anomaly Z is computed as expressed in equation (
10) below.
Where X represents the observed rainfall, μ denotes the long-term mean rainfall, and σ indicates the rainfall standard deviation. The value of Z gives immediate information about the significance of a specific deviation from the mean. Negative values indicate a rainfall deficit, while positive values denote an excess of rainfall relative to the climatological mean.
3.4. Method for Rainfall Variability
Coefficient of Variation (CV)
The temporal and spatial variability of rainfall will be described by the coefficient of variation (CV) derived from existing rain gauge stations in the study area. The CV of rainfall records is estimated using an equation,
Where CV is the coefficient of variation, σ is the standard deviation, and μ is the rainfall record mean. The CV quantifies the overall variability of rainfall records of an area. Based on the CV values, rainfall variability is categorized into low (CV < 20), moderate (20 < CV < 30), and high (CV > 30)
| [19] | Addisu, S., Selassie, Y. G., Fissha, G., & Gedif, B. (2015). Time series trend analysis of temperature and rainfall in Lake Tana Sub-basin, Ethiopia. Environmental Systems Research, 4(1). https://doi.org/10.1186/s40068-015-0051-0 |
[19]
. The temporal and spatial variability of rainfall for the study area was generated based on the CV of seasonal and annual rainfall.
4. Discussion and Results
4.1. Trend Analysis of Annual and Seasonal Rainfall over Dawuro Zone
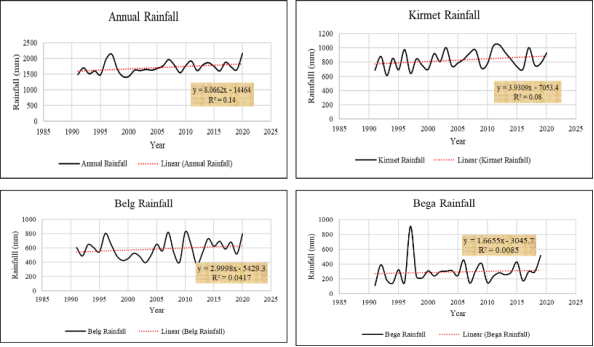
This study examined the annual and seasonal rainfall trends over the Dawuro Zone, Ethiopia. The Annual, Kirmet, Belg, and Bega rainfall graphs from 1991 to 2020 offer information on precipitation patterns in various areas or times of year. A linear equation of y = 5.068x + 1446 and an R2 value of 0.14 show a small upward trend in the annual rainfall chart, suggesting a slight rise over time but significant variability.
The Kirmet rainfall graph indicates a little upward movement with a linear trend of y = 3.030x - 705.4 and an R2 of 0.063; nevertheless, the low R2 indicates significant swings and poor linearity. Belg rainfall exhibits a similar pattern, with a weak upward trend amid irregular variations (y = 2.999x - 5429, R2 = 0.0417). In contrast, the Bega rainfall chart stands out with a noticeable peak, demonstrated by y = 1.665x - 3045.7 and an R² of 0.0085, the lowest among the four, indicating the weakest linear correlation and highlighting a highly variable pattern, likely influenced by a significant event or seasonal anomaly. Overall, the low R² values (ranging from 0.0085 to 0.14) across all datasets suggest that rainfall patterns are not strongly predictable with linear models, pointing to the influence of complex climatic factors, such as El Niño, local geography, or seasonal shifts.
Figure 5. Trend analysis of Annual and seasonal rainfall over Dawuro Zone (1991-2020).
4.2 Assessment of Annual and Seasonal Rainfall Distribution over Dawuro Zone
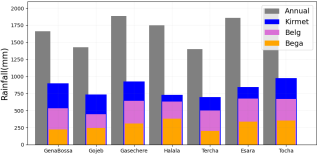
The study area is characterized by three distinct seasons. The Belg seasons start from February to May, Bega (Octeber to December), and Kiremt (June to August) seasons. The seasonal rainfall pattern shows variability at various stations. The findings show that the Tercha station had the lowest mean annual rainfall (1399.57 mm), while the Tocha station had the highest mean annual rainfall (1998.92 mm). Additionally, Tercha has the lowest rainfall predictability, while the Gasechere stations have the most variability (600.37 mm) in their standard deviation, suggesting less predictable rainfall. For the detail information
Figure 6. The coefficient of variation (CV) across the study area is also examined in this study. According to the results, Tocha has the lowest CV (14.45%), indicating more regular rainfall, while Gasechere station has the greatest (31.82%), showing considerable relative variability. The seasonal rainfall variability (Kirmet (JJAS), Belg (FMAM), and Bega (ONDJ) was examined. The findings show that across all stations, the kirmet season (JJAS) is the primary contributor to annual rainfall, with Tercha receiving the least amount (696.03 mm) and Tocha receiving the most (973.99 mm). We make a comparison between the Belg season (FMAM) and the Kirmet season (JJAS). The Kirmet season contributes more than the Belg season, with Gojeb receiving the least amount (449.03 mm) and Esara the most (675.78 mm). Lastly, comparing the Bega seasons to the Kirmet and Belg seasons. Tercha receives the least amount of rainfall (200.01 mm) and Halala the most (383.82 mm) during the dry Bega season. During kirmet season often accounts for the greatest portion of the annual rainfall in all places, ranging from around 50% in Halala to about 65% in Tercha. Tocha's low CV (14.45%) suggests stable rainfall patterns, while Gasechere's high CV (31.82%) and standard deviation (600.37 mm) suggest the study area gets the most variable rainfall. Tercha is especially dry (200.01 mm), and the Bega season contributes little to the yearly rainfall, which may cause problems for the supply of water. For the detailed explanation, refer to
Table 1 below.
Figure 6. Seasonal and Mean Annual Rainfall Distribution (1991-2020).
Table 1. The statistical description of seasonal and annual rainfall variability for various stations.
| | Annual and seasonal rainfall descriptive statistics and test results | | | |
| | Meteorological stations | | | | | | |
No | Seasons | Tests | GenaBossa | Gojeb | Gasechere | Halala | Tercha | Esara | Tocha |
1 | Kirmet | P-value | 0.04 | 0.91 | 0.00 | 0.11 | 0.71 | 0.03 | 0.11 |
Sen's slope | 11.20 | -0.07 | 24.87 | 8.66 | 1.32 | 7.64 | 7.98 |
Tau | 0.26 | -0.01 | 0.52 | 0.20 | 0.05 | 0.27 | 0.20 |
Mean | 901.35 | 736.54 | 927.38 | 732.22 | 696.03 | 842.73 | 973.99 |
Std. Dev | 282.93 | 118.27 | 314.55 | 225.52 | 114.27 | 163.55 | 177.95 |
CV% | 31.39 | 16.06 | 33.92 | 30.80 | 16.42 | 19.41 | 18.27 |
2 | Belg | P-value | 0.88 | 0.02 | 0.01 | 0.39 | 0.03 | 0.20 | 0.11 |
Sen's slope | 0.60 | 2.22 | 15.77 | 3.73 | 6.37 | 5.87 | 4.05 |
Tau | 0.02 | 0.19 | 0.32 | 0.08 | 0.27 | 0.16 | 0.15 |
Mean | 535.62 | 449.03 | 645.91 | 630.39 | 500.20 | 675.78 | 670.38 |
Std. Dev | 231.76 | 93.64 | 298.49 | 152.03 | 128.60 | 164.23 | 145.94 |
CV% | 43.27 | 20.85 | 46.21 | 24.12 | 25.71 | 24.30 | 21.77 |
3 | Bega | P-value | 0.03 | 0.10 | 0.00 | 0.29 | 0.07 | 0.14 | 0.04 |
Sen's slope | 6.50 | 4.74 | 11.14 | 3.82 | 3.78 | 5.41 | 8.41 |
Tau | 0.34 | 0.21 | 0.45 | 0.14 | 0.23 | 0.19 | 0.27 |
Mean | 222.63 | 247.12 | 312.84 | 383.82 | 200.01 | 336.62 | 352.73 |
Std. Dev | 138.37 | 111.84 | 175.42 | 211.38 | 117.82 | 201.75 | 205.50 |
CV% | 62.15 | 45.26 | 56.07 | 55.07 | 58.91 | 59.93 | 58.26 |
4 | Annual | P-value | 0.10 | 0.09 | 0.00 | 0.25 | 0.17 | 0.01 | 0.05 |
Sen's slope | 14.74 | 5.80 | 41.96 | 9.15 | 6.50 | 13.12 | 11.86 |
Tau | 0.23 | 0.13 | 0.58 | 0.15 | 0.17 | 0.28 | 0.25 |
Mean | 1663.55 | 1429.93 | 1886.91 | 1751.01 | 1399.57 | 1861.32 | 1998.92 |
Std. Dev | 432.84 | 219.31 | 600.37 | 338.67 | 205.66 | 272.73 | 288.86 |
CV% | 26.02 | 15.34 | 31.82 | 19.34 | 14.69 | 14.65 | 14.45 |
P-value was less than or equal to 0.05% (95% confidence level).
4.3. Analyze the Rainfall Anomaly over the Study Area
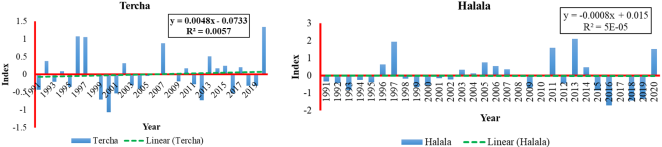
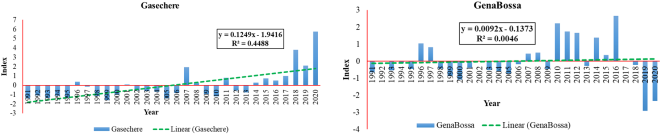
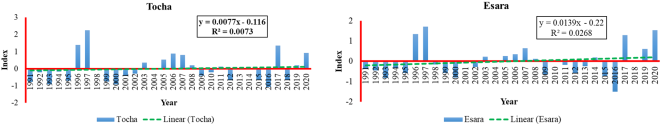
We looked at the rainfall-standardized anomaly for the six weather stations. Both positive and negative anomalies are present, according to the results, which show inter-annual rainfall variability at every station in the study area. According to the common definition of rainfall anomalies, both positive and negative, a positive anomaly (>0) denotes conditions that are wetter than usual (for example, +1.5 indicates rainfall that is 1.5 standard deviations above the mean, indicating abnormally high rainfall). Conditions that are drier than typical are indicated by a negative anomaly (<0); for example, -2.0 indicates that rainfall is two standard deviations below the mean, indicating drought or abnormally low rainfall. Rainfall is nearly at the long-term average (≈0). According the above definition, our findings show what in the demonstrate that the Tercha station's standardized rainfall anomaly in 1996, 2017, and 2020 had a positive anomaly ranging from +1 to +1.4 which indicate wetter condition, whereas the 2001 anomaly ranged from -1 to 1.3 which indicates low rainfall. In comparison, the halal station experienced a positive anomaly in 1997, 2011, 2013, and 2020, with a range of 1.5 to 2.4, which indicate unusually high rainfall and a negative anomaly in 2016, with a range of -1 to 1.5 indicate low rainfall over the research region. According to the Gasechare Station data, the years 2018 and 2020 saw the greatest positive rainfall anomaly and there is high probability of the unusually high rainfall amount. On the other hand, the Gena Boss station experienced positive rainfall between 2010 and 2016, with a range of 2 to 3, while 2019 and 2020 saw negative rainfall anomalies. This indicates that the research area has a significant amount of climate variability; see
Figures 7, 8, and 9 for a detailed reference. The normalized rainfall anomaly at the Esara station is shown in
Figure 9. The findings show that while there was a negative rainfall anomaly in 2016, there was a positive rainfall anomaly in 1996 and 1997, with values ranging from +1 to 1.5. Additionally, a positive rainfall anomaly ranging from +1.5 to 2.5 was seen at the Tocha station in 1996 and 1997, indicating high and consistent rainfall patterns.
Figure 7. Standardized rainfall anomaly for Tercha and Halala stations.
Figure 8. Standardized rainfall anomaly for Gaschere and GenaBossa stations.
Figure 9. Standardized rainfall anomaly for Tocha and Esara stations.
4.4. Spatial Analysis of Seasonal and Annual Rainfall Variability
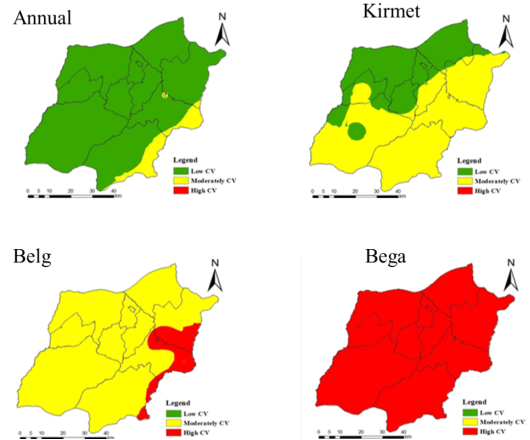
This study examined spatial patterns of seasonal and annual rainfall by using the coefficient variation. The findings show that in all the parts of the region, there is low variability in annual rainfall, whereas in the same southeast part there is moderate rainfall variation was occur. In the Kiremt season, the north, northwest and some western parts of region experienced low rainfall variability, whereas in the southern, southwest, southeast and some central parts of the region was moderate rainfall variation occurred. However, in the Belg season (FMAM), all parts of the region are experienced moderate rainfall variability, whereas in the some eastern tips of the region had high rainfall variability. In other hand, the Bega season (ONDJ), most parts of the region experienced high rainfall availability of the region. In generally the findings show that in the Belg seasons some the east parts of the regions and in the Bega season all parts of the regions was high rainfall variability was occur during the research period. This study suggest that harvesting Kirmet and Belg seasons rainwater, Ground water potential, and use the Ethiopia Meteorology Institute (EMI) advisory.
Figure 10. Coefficient of Variation (CV) of seasonal and annual rainfall for the study area.
4.5. Spatial Patterns of Annual and Seasonal Rainfall Distribution (1991-2020)
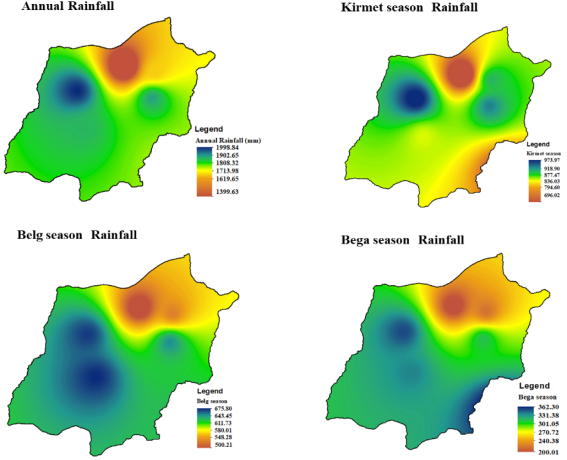
The study analyzed the spatial patterns of annual and seasonal rainfall over the region. The findings show that high amounts of annual rainfall occur in the south west, southern, and southeast parts of the region. Where the low annual rainfall occurs, it is in the north and north east of the region. During the Kirmet season, the annual amount of rainfall occurred in the western and eastern parts of the region. The low amount of Kirmet seasonal rainfall occurs in the North West and southeast parts of the region. In addition, in the Belg seasons the high amounts of rainfall occur in the south, southeast, southwest, and central parts of the regions. Where us in the Belg season the lowest amount rainfall occur in the northeast and northwest parts of the regions. However, in the Bega season the high amount annual rainfall distribution occur in the south, southeast, southwest and central parts of the regions. The lowest Bega occur in the north east and northwest of the parts of the regions.
Figure 11. Spatial Patterns of Seasonal and Annual Rainfall Variability (1991-2020).
4.6. Onset, Cessation, and Length of Growth Period over the Dawuro Zone
4.6.1. Onset of the Rainy Season
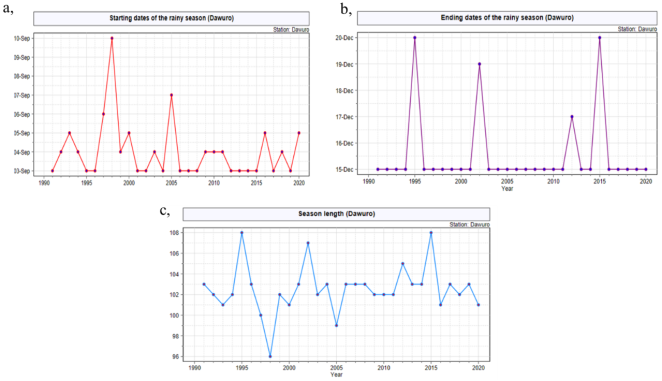
The "Starting dates of the rainy season (Dawuro)" graph shows the beginning of the rainy season, which is usually connected to the Kiremt season (June-September) and is indicated by the start of heavy rainfall. Plotting the data points in red from 1991 to 2020 reveals significant inter-annual fluctuation. The onset dates range from late August to late September, with certain years (such as 1994, 2000, and 2015) showing delayed starts, with the rainy season starting as late as 27-28 September. On the other hand, earlier onsets are noted in years like 1992 and 2006, which are closer to September 19-20. Farmers who depend on timely rainfall may find their planting schedules disrupted by this fluctuation, which implies that the onset of the rainy season is quite unpredictable. For detail below (
Figure 12a). Short-cycle crops that need consistent precipitation early in the season are more vulnerable to crop failure due to delayed onsets, which can reduce the growth season, as shown in peak years. Such variability is consistent with patterns in other monsoon-dependent regions around the world, where teleconnections like the El Niño-Southern Oscillation (ENSO) and climate change are connected to altering onset dates.
4.6.2. Cessation of the Rainy Season
Below
Figure 12b, the cessation of the rainy season is plotted in purple, which spans from mid-December to late-December, on the graph "Ending dates of the rainy season (Dawuro)", showing when the rainy season ends. There is a notable variation in the dates of cessation, with peaks occurring around December 19-20 in 1995, 2005, and 2015, indicating longer rainy seasons, and troughs occurring around December 15-16 in 2000 and 2010, indicating earlier finishes. The erratic ITCZ departure, which propels the Kiremt rains, is reflected in the variation in cessation dates. The growth season may be shortened by an early halt, as seen in certain years, which would especially affect crops that need rainfall far into their cycle. On the other hand, a longer rainy season can be advantageous for crops that mature later, but if improperly managed, it might potentially raise the risk of waterlogging or the spread of pests. This tendency is consistent with observations made worldwide in tropical locations where shifting climatic conditions are making the conclusion of the rainy season less predictable.
4.6.3. Length of the Growth Period
The rainy season's duration in days is depicted in blue in
Figure 12c, below "Season length (Dawuro)"; values vary from roughly 90 to 110 days during the study period. The growing season's duration exhibits a somewhat erratic pattern, peaking in years 1994, 2002, and 2016 at 106-108 days and troughing in years 1998 and 2012 at 96-98 days. The variable onset and cessation dates are the direct cause of this diversity. Crops having a shorter growing season (96 days, for example) might require early-maturing or drought-tolerant cultivars, whereas crops with longer growing seasons (108 days, for example) might be able to support a wider variety of crops, including ones with longer growth cycles. The season's average length of 100-104 days corresponds to Ethiopia's normal Kiremt season duration, but the notable variations from year to year underscore the difficulties in organizing agricultural operations.
Figure 12. Onset, Cessation, and Length of Growth Period over the Dawuro Zone.
5. Conclusions and Recommendations
This study analyzed rainfall variability and trends in the Dawuro Zone, Ethiopia, from 1991 to 2020 using time series data from eleven meteorological stations. Tocha recorded the highest mean annual rainfall (1998.92 mm) with stable patterns (CV 14.45%), while Tercha had the lowest (1399.57 mm) and least predictability. Gasechere showed the highest variability (CV 31.82%, SD 600.37 mm). The Kiremt season (June-September) was the main rainfall contributor, with Tocha receiving the most (973.99 mm) and Tercha the least (696.03 mm); Gena Bossa, Gasechere, and Halala had high variability (CVs 31.39-33.92%), while Tocha, Tercha, Esara, and Gojeb were stable. The Belg season (February-May) had less rainfall, with Esara highest (675.78 mm) and Gojeb lowest (449.03 mm), and high variability at Gena Bossa (CV 43.27%) and Gasechere (CV 46.21%). The Bega season (October-January) showed high variability across all stations, with Halala highest (383.82 mm) and Tercha lowest (200.01 mm). In generally, at all sites, the Kirmet season usually contributes the most to the annual rainfall, with Tercha receiving over 65% of the total and Halala receiving roughly 50%. Tocha's low CV (14.45%) indicates consistent rainfall patterns, whereas Gasechere's high CV (31.82%) and standard deviation (600.37 mm) show the most fluctuating rainfall. In the study area, annual rainfall is mostly unaffected by the Bega season, which could provide problems for the short-season crop, demand of water. This study analyzed the spatial patterns of the annual and seasonal rainfall over the region. The findings show that high amounts of annual rainfall occur in the south west, southern, and southeast parts of the region. Where the low annual rainfall occurs, it is in the north and north east of the region. During the Kirmet season, the annual amount of rainfall occurs in the western and eastern parts of the region. The low amount of Kirmet seasonal rainfall occurs in the North West and the southeast parts of the region. In addition, in the Belg and Bega seasons the high amounts of rainfall occur in the south, southeast, southwest, and central parts of the regions. The lowest amount of rainfall occurs in the northeast and northwest parts of the region. Generally, the findings suggest that addressing these issues should include community-based adaptation strategies, improved water management systems, and the adoption of climate-resilient farming practices. To enhance resilience, local capacity will be strengthened through early warning systems, education, and access to climate-smart technologies. Additionally, since climate change is unpredictable, collaboration among academics, stakeholders, and local governments is essential for developing policies that promote sustainable development and environmental protection.
Abbreviations
CV | Coefficient of Variation |
CDT | Climate Data Tools |
ITCZ | Intertropical Convergence Zone |
ENACTS | Enhanced Climate Service |
SNHT | Standard Normal Homogeneity Test |
SAI | Standard Anomaly Index |
MMK | Modified Mann-Kendall |
Author Contributions
Sintayehu Abera Wondimu is the sole author. The author read and approved the final manuscript.
Data Availability Statement
The datasets generated during and/or analysed during the current study are available from the corresponding author upon reasonable request.
Funding
The authors did not receive support from any organization for the submitted work.
Conflicts of Interest
The authors declare no conflicts of interest.
References
| [1] |
Abidoye, B. O., & Odusola, A. F. (2015). Climate Change and Economic Growth in Africa: An Econometric Analysis. Journal of African Economies, 24(2), 277-301.
https://doi.org/10.1093/jae/eju033
|
| [2] |
Alexandersson, H., & Moberg, A. (1997). Homogenization of Swedish temperature data. Part I: Homogeneity test for linear trends. International Journal of Climatology: A Journal of the Royal Meteorological Society, 17(1), 25-34.
|
| [3] |
Dinku, T., Faniriantsoa, R., Cousin, R., Khomyakov, I., Vadillo, A., Hansen, J. W., & Grossi, A. (2022). ENACTS: Advancing Climate Services Across Africa. Frontiers in Climate, 3(January), 1-16.
https://doi.org/10.3389/fclim.2021.787683
|
| [4] |
Hailu, D., Woldetsadik, M., & Ayal, D. Y. (2024). Trends and variability in annual and seasonal rainfall amount and timing in Wereilu district, Northeastern Highlands of Ethiopia. Environmental Challenges, 17(November), 101055.
https://doi.org/10.1016/j.envc.2024.101055
|
| [5] |
Syaharuddin, Fatmawati, & Suprajitno, H. (2022). Investigations on Impact of Feature Normalization Techniques for Prediction of Hydro-Climatology Data Using Neural Network Backpropagation with Three Layer Hidden. International Journal of Sustainable Development and Planning, 17(7), 2069-2074.
https://doi.org/10.18280/ijsdp.170707
|
| [6] |
Yue, S., Pilon, P., & Phinney, B. (2003). Canadian streamflow trend detection: Impacts of serial and cross-correlation. Hydrological Sciences Journal, 48(1), 51-63.
https://doi.org/10.1623/hysj.48.1.51.43478
|
| [7] |
Kocsis, T., Kovács-Székely, I., & Anda, A. (2017). Comparison of parametric and non-parametric time-series analysis methods on a long-term meteorological data set. Central European Geology, 60(3), 316-332.
https://doi.org/10.1556/24.60.2017.011
|
| [8] |
Duhan, D., & Pandey, A. (2013). Statistical analysis of long term spatial and temporal trends of precipitation during 1901-2002 at Madhya Pradesh, India. Atmospheric Research, 122, 136-149.
https://doi.org/10.1016/j.atmosres.2012.10.010
|
| [9] |
Henry, M. (1945). Nonparametric Tests Against Trend Author: Henry B. Mann Published by : The Econometric Society Stable. Econometrica, 13(3), 245-259.
https://www.jstor.org/stable/1907187
|
| [10] |
Hirsch, R. M., Slack, J. R., & Geological, U. S. (1984). Rill R. Water Resources, 20(6), 727-732.
|
| [11] |
Kampata, J. M., Parida, B. P., & Moalafhi, D. B. (2008). Trend analysis of rainfall in the headstreams of the Zambezi River Basin in Zambia. Physics and Chemistry of the Earth, 33(8-13), 621-625.
https://doi.org/10.1016/j.pce.2008.06.012
|
| [12] |
Kendall, K. (1975). Thin-film peeling-the elastic term. Journal of Physics D: Applied Physics, 8(13), 1449-1452.
https://doi.org/10.1088/0022-3727/8/13/005
|
| [13] |
Theil, H., 1950. A rank-invariant method of linear and polynomial regression analysis. Indagationes mathematicae, 12(85), p. 173.
|
| [14] |
Sen, P.K., 1968. Estimates of the regression coefficient based on Kendall's tau. Journal of the American Statistical Association, 63(324), pp. 1379-1389.
|
| [15] |
Gwam, C.U., 2010. 22. World Meteorological Organization (WMO).
|
| [16] |
IPCC-FIELD, C.B., BARROS, V., MACH, K. and MASTRANDREA, M., 2014. Climate Change 2014: Impacts, Adaptation, and Vulnerability.
|
| [17] |
Adane, A. and Asmerom, B., 2025. Analysis of spatiotemporal distribution, variability, and trends of rainfall in Wollo area, Northeastern Ethiopia. PloS one, 20(1), p. e0312889.
|
| [18] |
Alhamshry, A., Ayele, F. A., Yasuda, H., Kimura, R., & Shimizu, K. (2019). Seasonal Rainfall Variability in Ethiopia and Its. Water, 12(55), 1-19.
|
| [19] |
Addisu, S., Selassie, Y. G., Fissha, G., & Gedif, B. (2015). Time series trend analysis of temperature and rainfall in Lake Tana Sub-basin, Ethiopia. Environmental Systems Research, 4(1).
https://doi.org/10.1186/s40068-015-0051-0
|
Cite This Article
-
-
@article{10.11648/j.innov.20250603.18,
  author = {Sintayehu Abera Wondimu},
  title = {Seasonal and Annual Rainfall Variability and Trends in the Dawuro Zone, Ethiopia
},
  journal = {Innovation},
  volume = {6},
  number = {3},
  pages = {112-125},
  doi = {10.11648/j.innov.20250603.18},
  url = {https://doi.org/10.11648/j.innov.20250603.18},
  eprint = {https://article.sciencepublishinggroup.com/pdf/10.11648.j.innov.20250603.18},
  abstract = {Rainfall, a critical determinant of agriculture, water resources, and socioeconomic stability, was analyzed for seasonal and annual variability in the Dawuro Zone, Ethiopia, from 1991 to 2020. Using time series data from seven meteorological stations and four virtual stations, statistical methods such as the Coefficient of Variation (CV), Standard Anomaly Index (SAI), Sen’s Slope Estimator, and Modified Mann-Kendall test were employed, alongside Inverse Distance Weighted interpolation in ArcGIS for spatial analysis. The study revealed significant variability, with Tocha recording the highest mean annual rainfall (1998 mm) and Tercha the lowest (1399.5 mm). Tercha exhibited the least consistent rainfall, while Gasechere showed the highest variability (CV 31.82%, SD 600.37 mm). The Kiremt season (June-September) contributed the most to annual rainfall, with Tocha receiving 973.99 mm and Tercha 696.03 mm, while the Belg (February-May) and Bega (October-January) seasons showed lower contributions and higher variability, particularly at Gena Bossa and Gasechere. Spatially, the southwest, south, and southeast regions received higher rainfall, while the north and northeast experienced the lowest amount. This study investigates the onset, cessation, and duration of the rainy season in the Dawuro Zone, Ethiopia, from 1991 to 2020, with particular attention to the Kiremt season (June-September). The start of the rainy season, characterized by heavy rainfall, varies considerably, from mid-September to late September, with delays in years like 1994, 2000, and 2015 (around September 27-28) and earlier starts in 1992 and 2006 (around September 19-20). Cessation dates, occurring between mid-December and late December, show similar variability, with longer seasons ending around December 19-20 (e.g., 1995, 2005, 2015) and shorter ones around December 15-16 (e.g., 2000, 2010). The length of the growing season ranges from 90 to 110 days, reaching a maximum of 106-108 days in 1994, 2002, and 2016, and decreasing to 96-98 days in 1998 and 2012. This variability, driven by factors such as the Inter-Tropical Convergence Zone and El Niño-Southern Oscillation, presents challenges for agricultural planning by affecting crop selection and increasing the risk of failure due to shortened seasons or waterlogging in extended ones. The next study will consider the association between seasonal rainfall variability and global systems like El Niño-Southern Oscillation, Indian Dipole oscillation, and other global systems over the study area. The study recommends expanding meteorological stations, integrating findings into regional policies for sustainable agriculture and water management, and enhancing early warning systems to address the variable rainfall patterns across the Kiremt, Belg, and Bega seasons.},
 year = {2025}
}
 Copy
|
Copy
|
 Download
-
TY  - JOUR
T1  - Seasonal and Annual Rainfall Variability and Trends in the Dawuro Zone, Ethiopia

AU  - Sintayehu Abera Wondimu
Y1  - 2025/08/19
PY  - 2025
N1  - https://doi.org/10.11648/j.innov.20250603.18
DO  - 10.11648/j.innov.20250603.18
T2  - Innovation
JF  - Innovation
JO  - Innovation
SP  - 112
EP  - 125
PB  - Science Publishing Group
SN  - 2994-7138
UR  - https://doi.org/10.11648/j.innov.20250603.18
AB  - Rainfall, a critical determinant of agriculture, water resources, and socioeconomic stability, was analyzed for seasonal and annual variability in the Dawuro Zone, Ethiopia, from 1991 to 2020. Using time series data from seven meteorological stations and four virtual stations, statistical methods such as the Coefficient of Variation (CV), Standard Anomaly Index (SAI), Sen’s Slope Estimator, and Modified Mann-Kendall test were employed, alongside Inverse Distance Weighted interpolation in ArcGIS for spatial analysis. The study revealed significant variability, with Tocha recording the highest mean annual rainfall (1998 mm) and Tercha the lowest (1399.5 mm). Tercha exhibited the least consistent rainfall, while Gasechere showed the highest variability (CV 31.82%, SD 600.37 mm). The Kiremt season (June-September) contributed the most to annual rainfall, with Tocha receiving 973.99 mm and Tercha 696.03 mm, while the Belg (February-May) and Bega (October-January) seasons showed lower contributions and higher variability, particularly at Gena Bossa and Gasechere. Spatially, the southwest, south, and southeast regions received higher rainfall, while the north and northeast experienced the lowest amount. This study investigates the onset, cessation, and duration of the rainy season in the Dawuro Zone, Ethiopia, from 1991 to 2020, with particular attention to the Kiremt season (June-September). The start of the rainy season, characterized by heavy rainfall, varies considerably, from mid-September to late September, with delays in years like 1994, 2000, and 2015 (around September 27-28) and earlier starts in 1992 and 2006 (around September 19-20). Cessation dates, occurring between mid-December and late December, show similar variability, with longer seasons ending around December 19-20 (e.g., 1995, 2005, 2015) and shorter ones around December 15-16 (e.g., 2000, 2010). The length of the growing season ranges from 90 to 110 days, reaching a maximum of 106-108 days in 1994, 2002, and 2016, and decreasing to 96-98 days in 1998 and 2012. This variability, driven by factors such as the Inter-Tropical Convergence Zone and El Niño-Southern Oscillation, presents challenges for agricultural planning by affecting crop selection and increasing the risk of failure due to shortened seasons or waterlogging in extended ones. The next study will consider the association between seasonal rainfall variability and global systems like El Niño-Southern Oscillation, Indian Dipole oscillation, and other global systems over the study area. The study recommends expanding meteorological stations, integrating findings into regional policies for sustainable agriculture and water management, and enhancing early warning systems to address the variable rainfall patterns across the Kiremt, Belg, and Bega seasons.
VL  - 6
IS  - 3
ER  -
Copy
|
Download